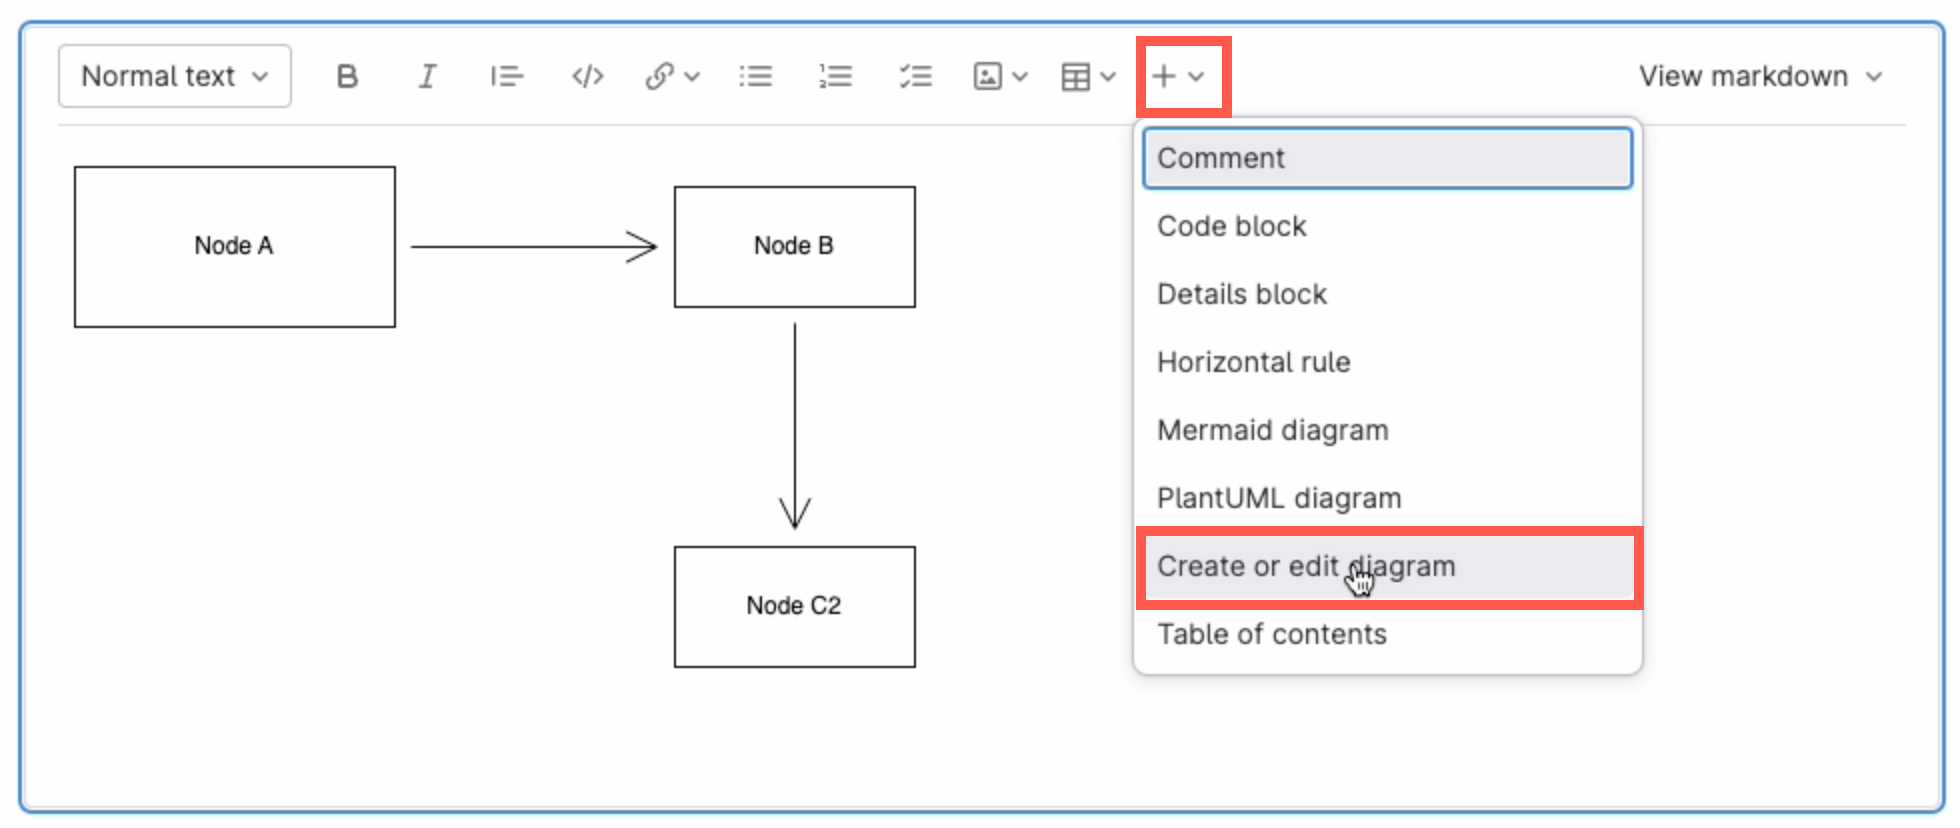
Mermaid is a text-based syntax that you can use to describe a diagram, and automatically lay it out neatly on the diagram canvas. Enter your Mermaid diagram description in draw.io via Arrange > Insert > Mermaid in the draw.io menu or + > Mermaid from the toolbar. draw.io has updated to Mermaid version 10.9.1 to support the new ELK automatic layout.
Text to diagram tools in draw.io
There are several text-to-diagram tools built into draw.io:
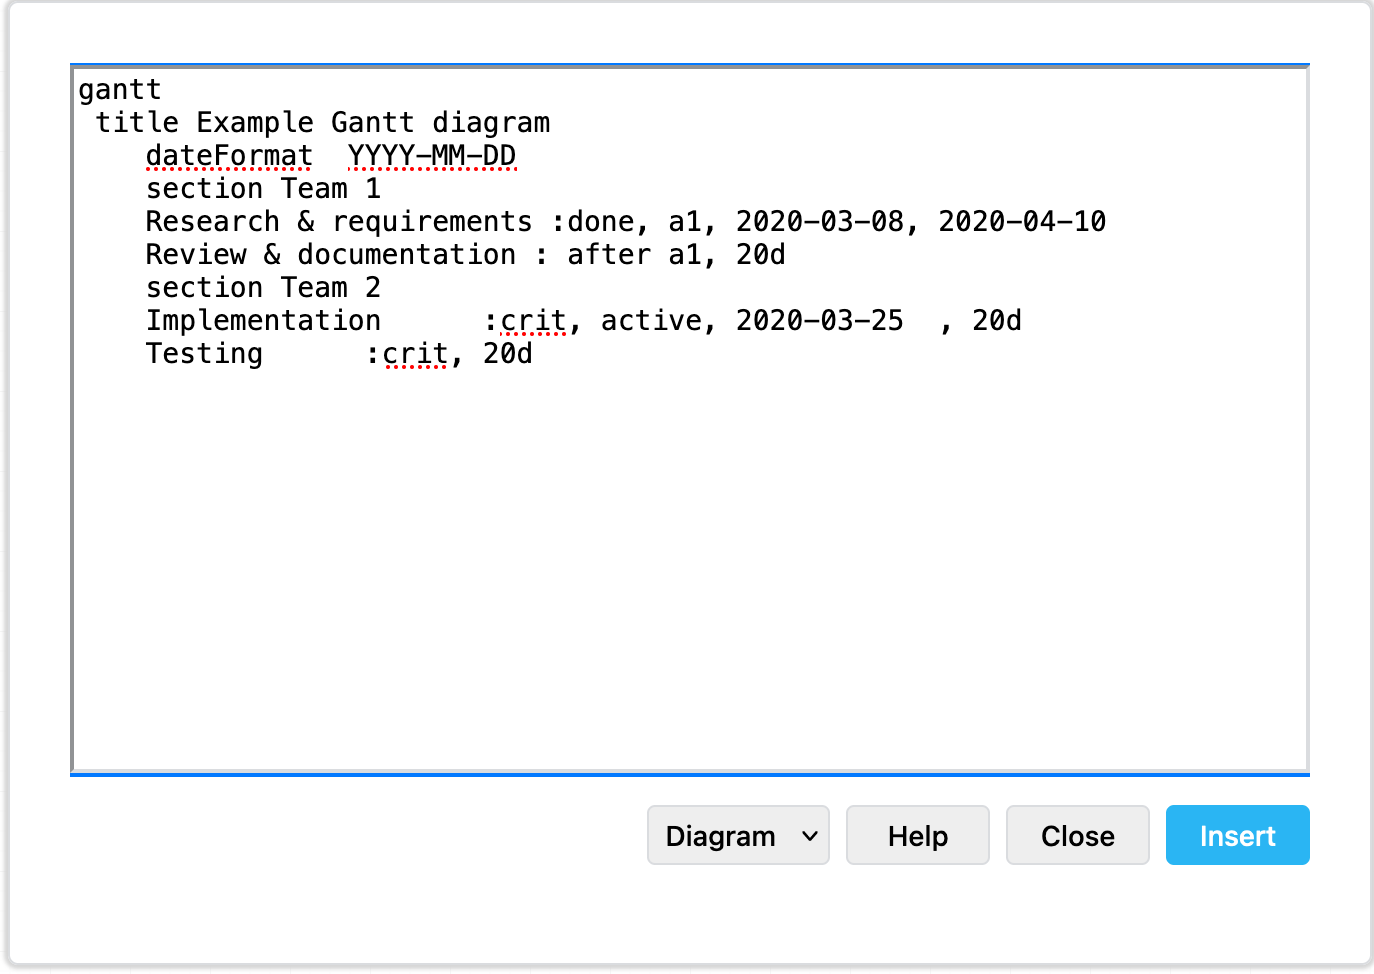
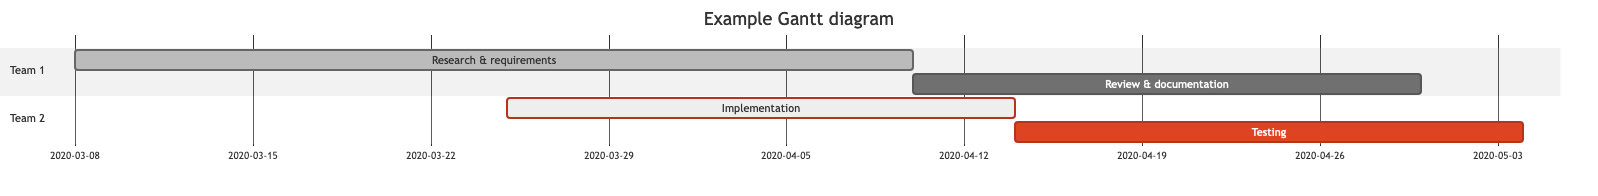
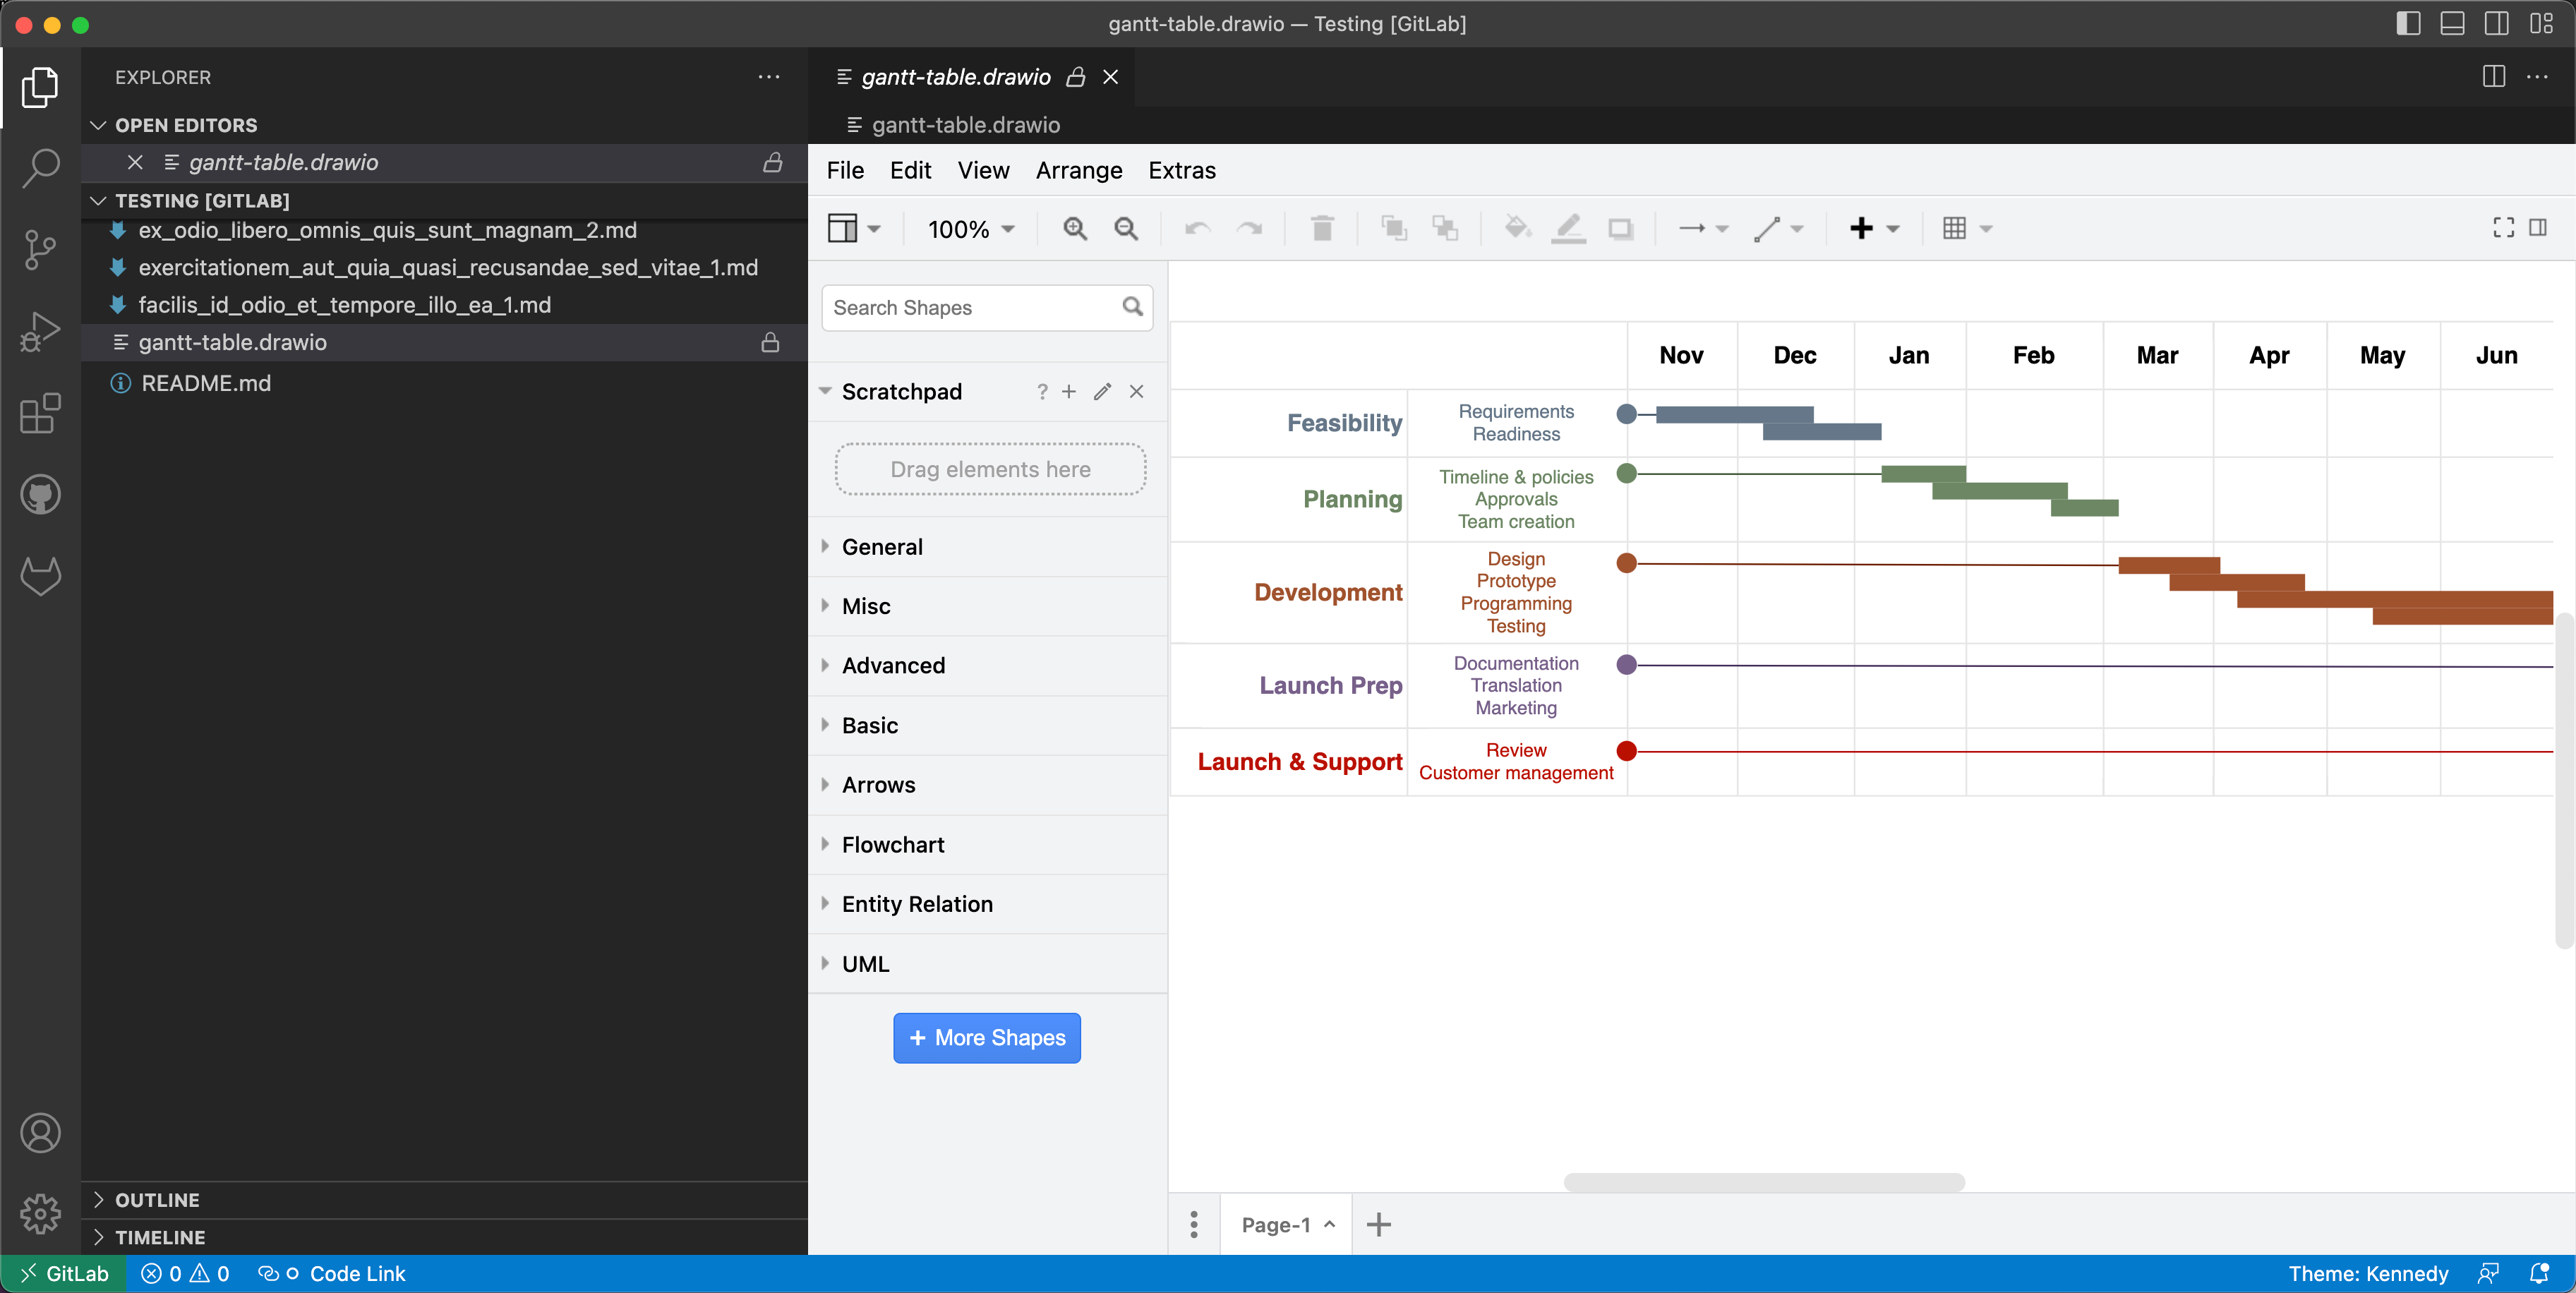
Example Gantt chart generated from Mermaid syntax
Some of these text-to-diagram features generate a diagram as an image on the drawing canvas, and some use draw.io shapes to automatically layout your diagram and let you continue styling and dding draw.io shapes and connectors to it.
You can choose your preferred output when you generate a diagram from Mermaid syntax. By default, your Mermaid diagram will be generated and layed out inside a Mermaid container group using draw.io shapes and connectors.
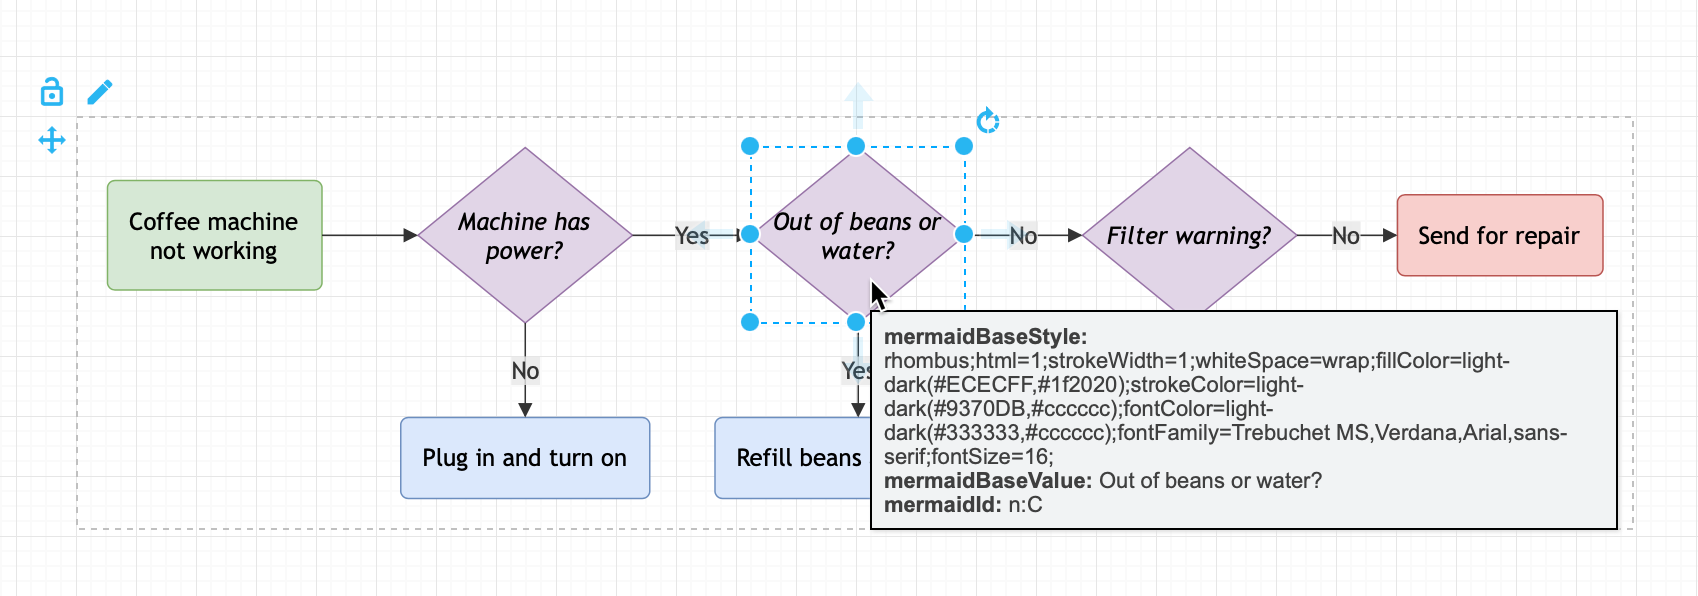
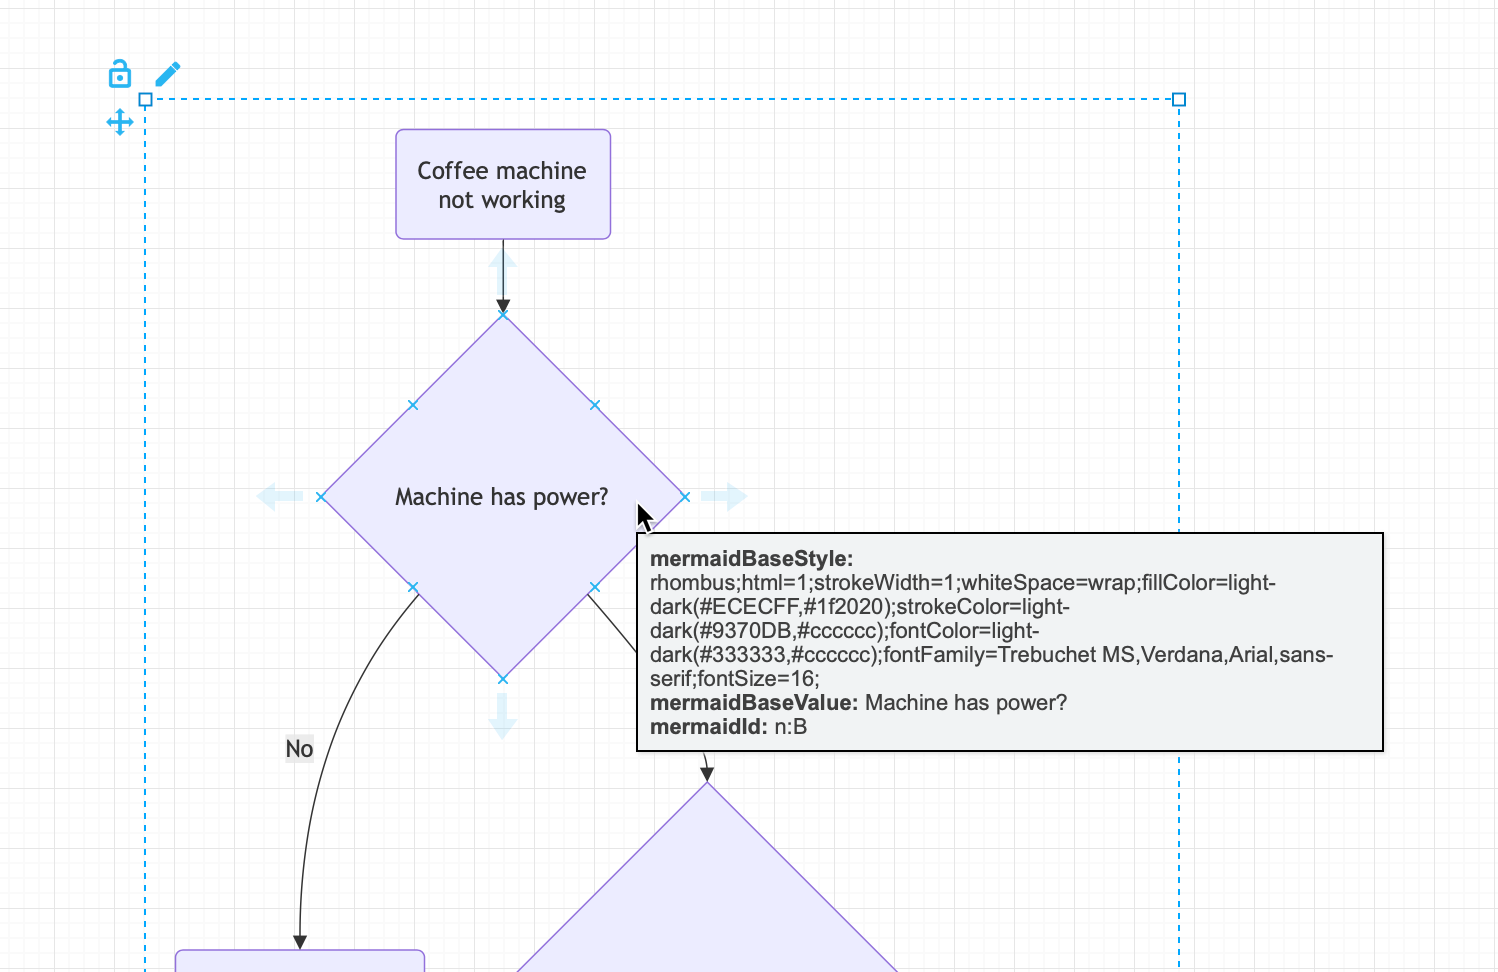
You can style the shapes, connectors and text in this container group, edit the Mermaid source, and the draw.io styles will be reapplied to any elements that continue to exist. However, any geometry changes (resize, reposition, connector arrow ends) will be reset if you edit the Mermaid source.
Insert a Mermaid diagram in draw.io
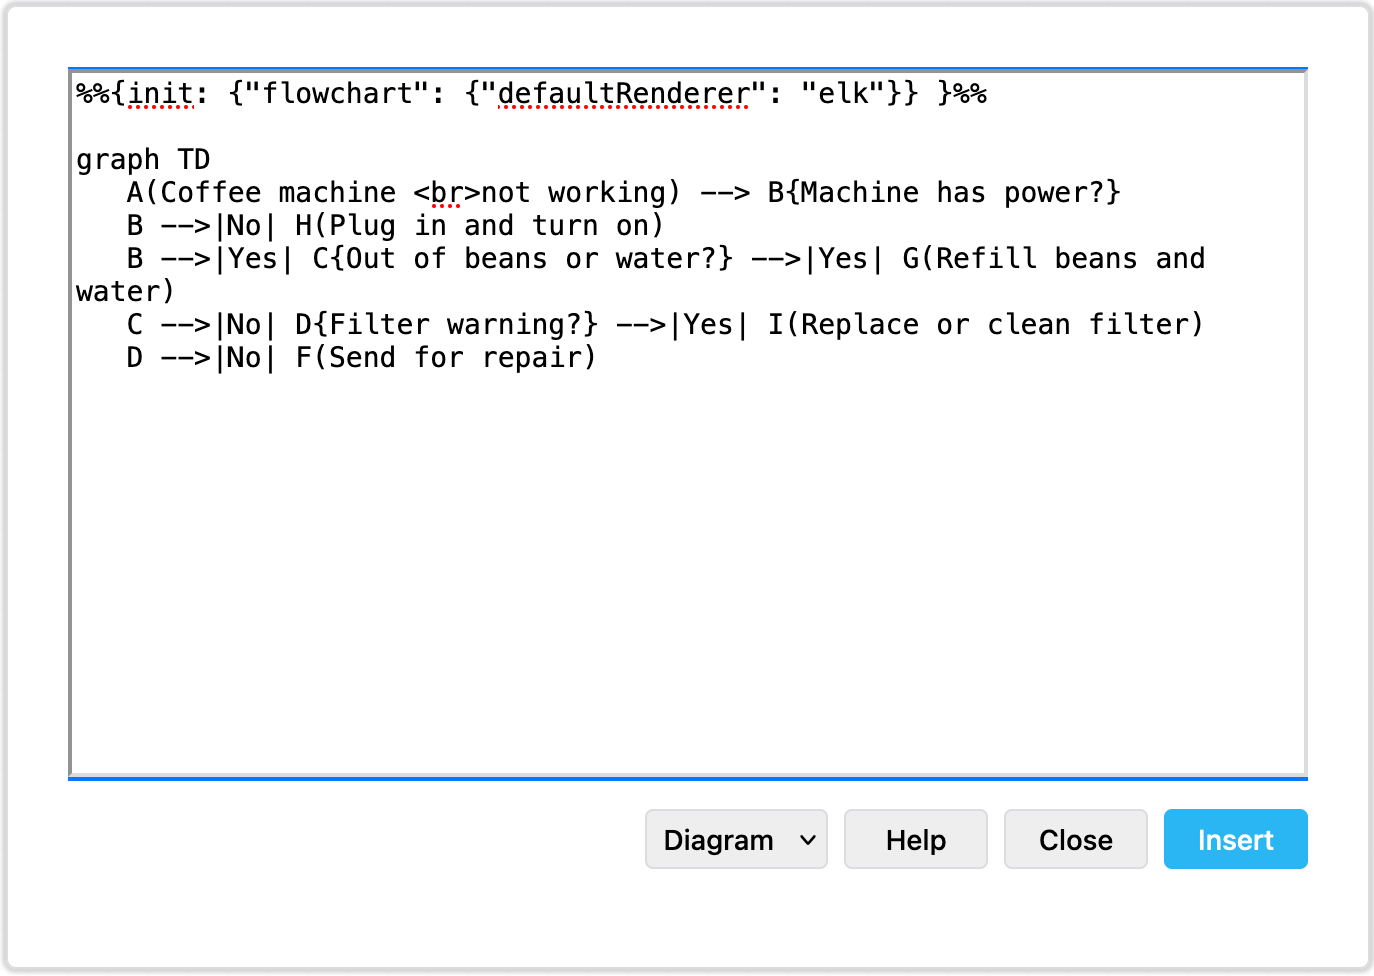
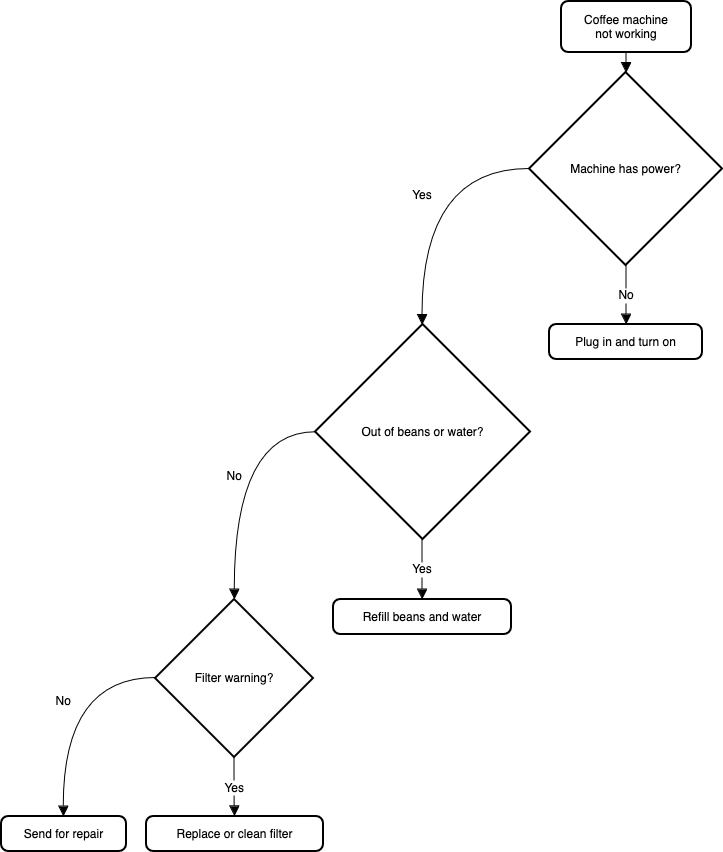
An example coffee machine debugging flow is described in Mermaid syntax below.
flowchart TD
   A(Coffee machine <br />not working) --> B{Machine has power?}
   B -->|No| H(Plug in and turn on)
   B -->|Yes| C{Out of beans or water?} -->|Yes| G(Refill beans and water)
   C -->|No| D{Filter warning?} -->|Yes| I(Replace or clean filter)
   D -->|No| F(Send for repair)
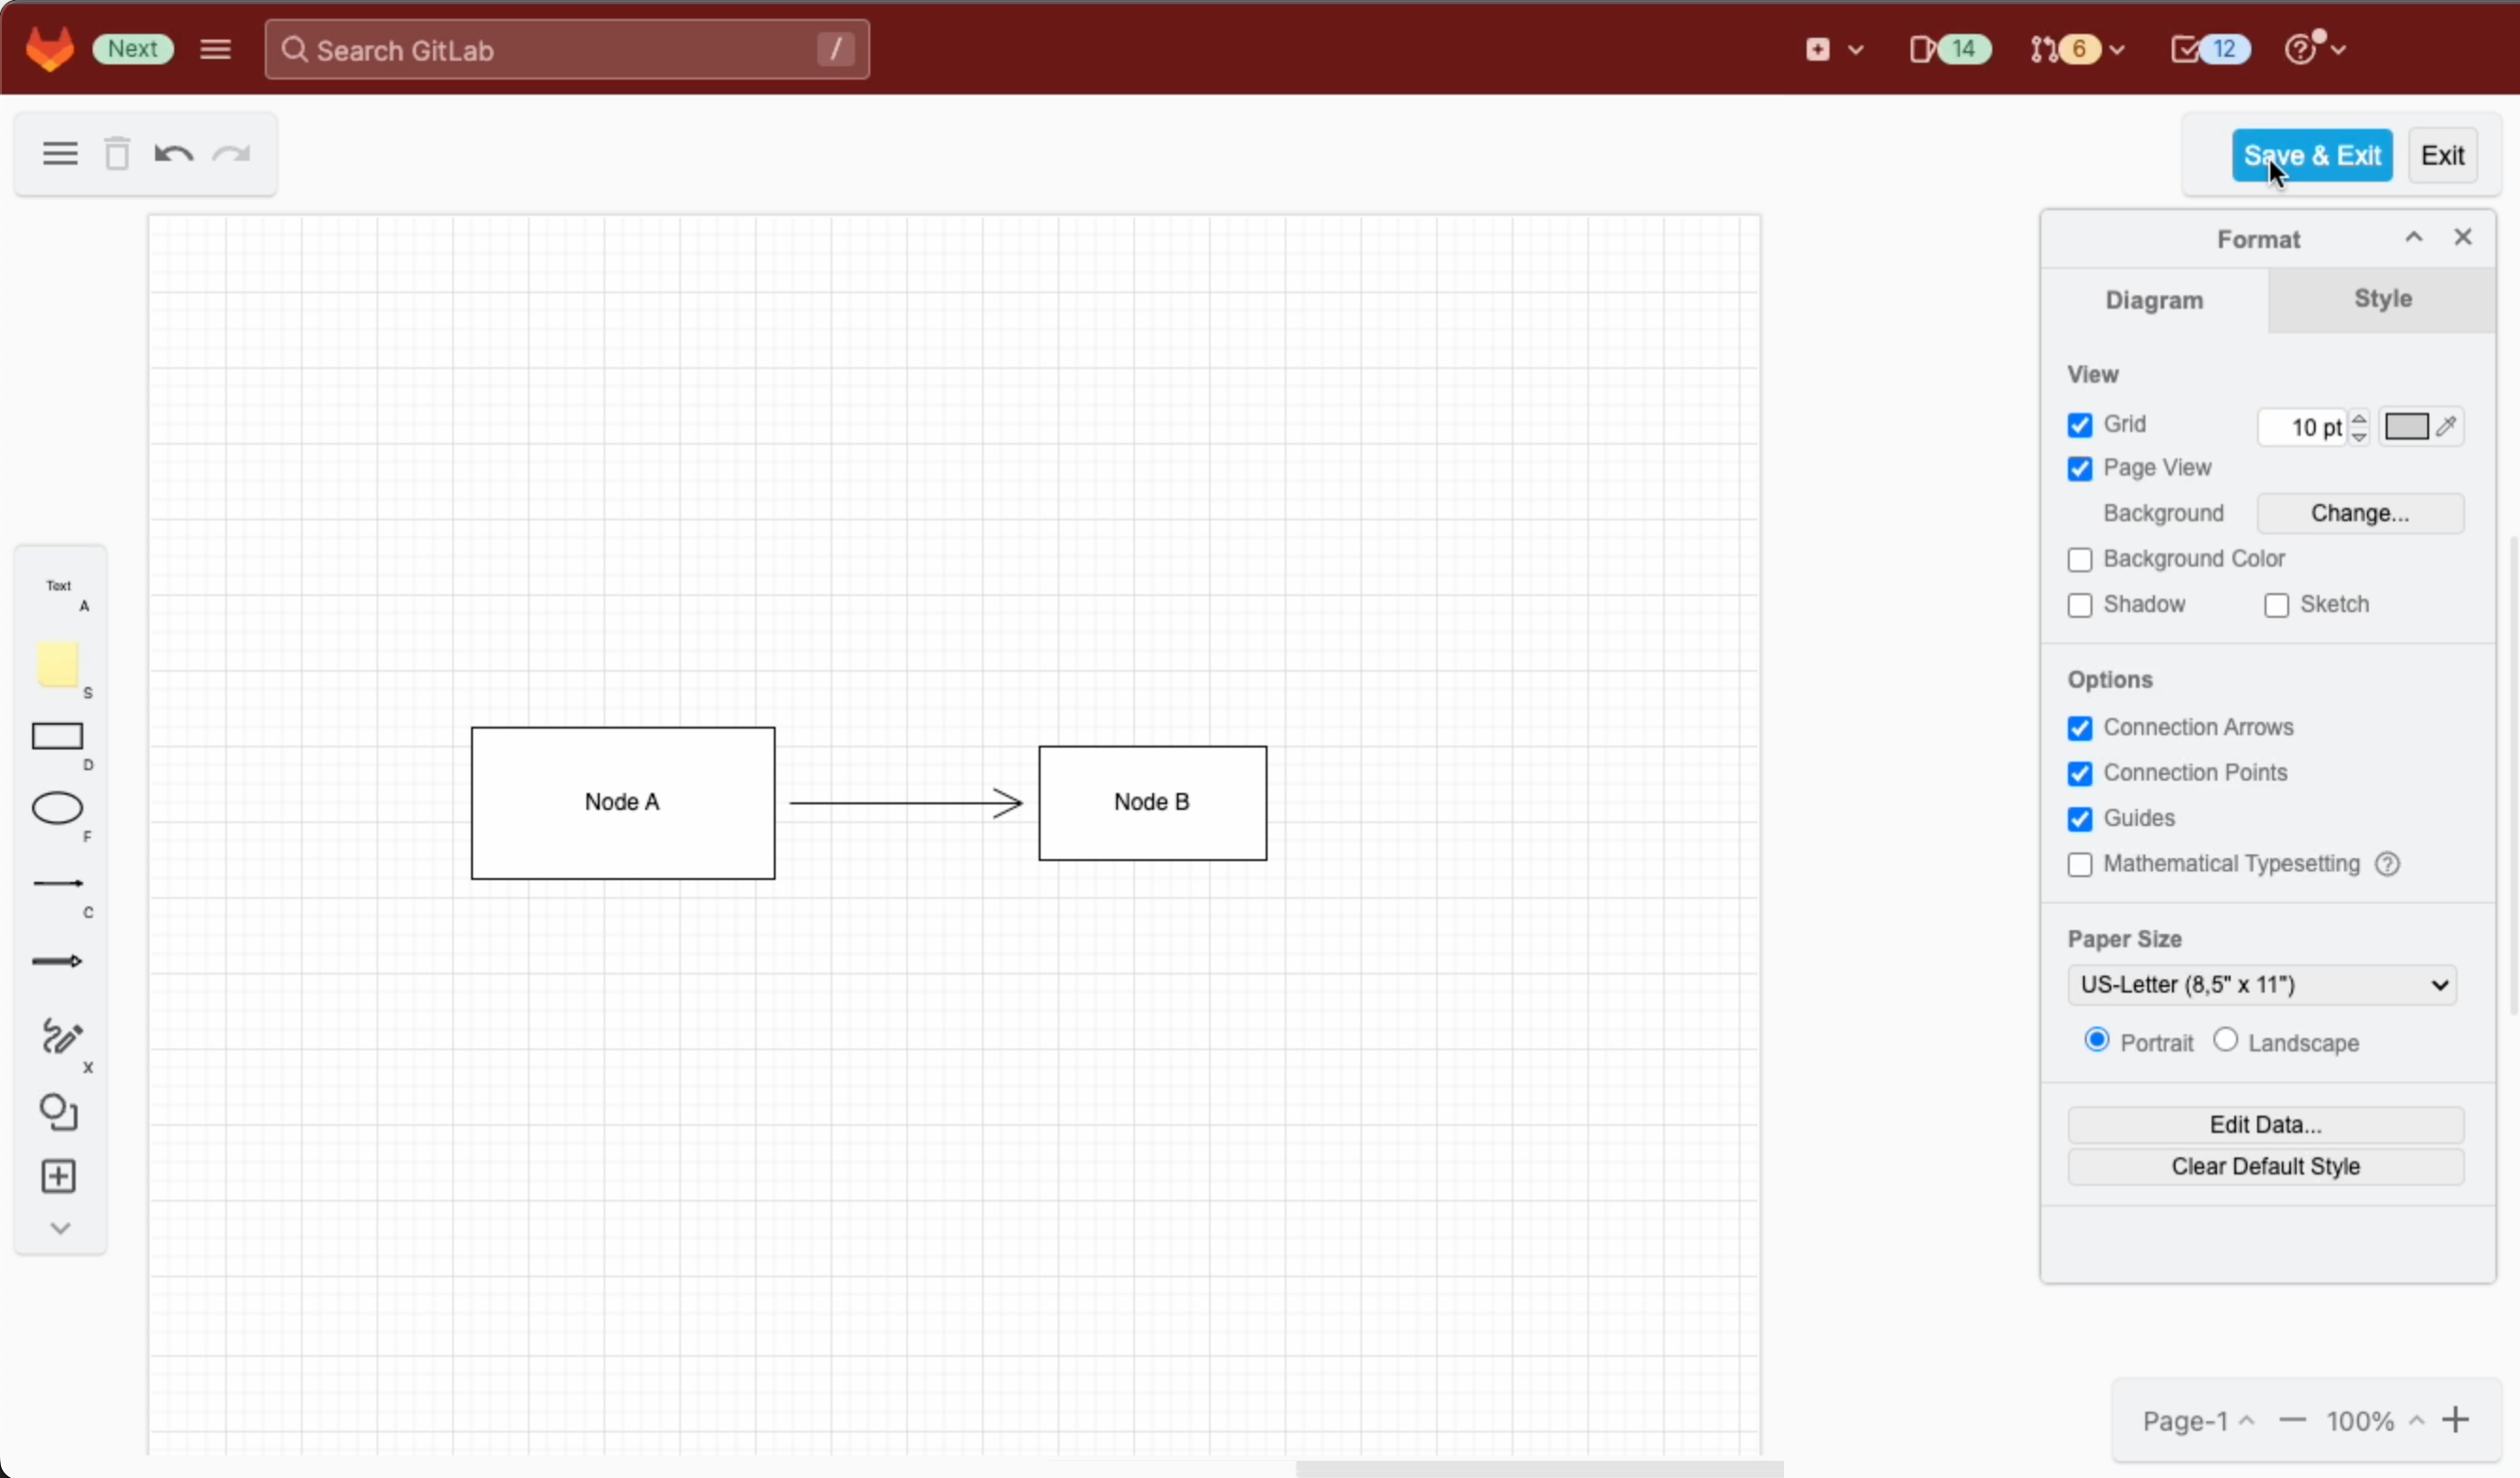
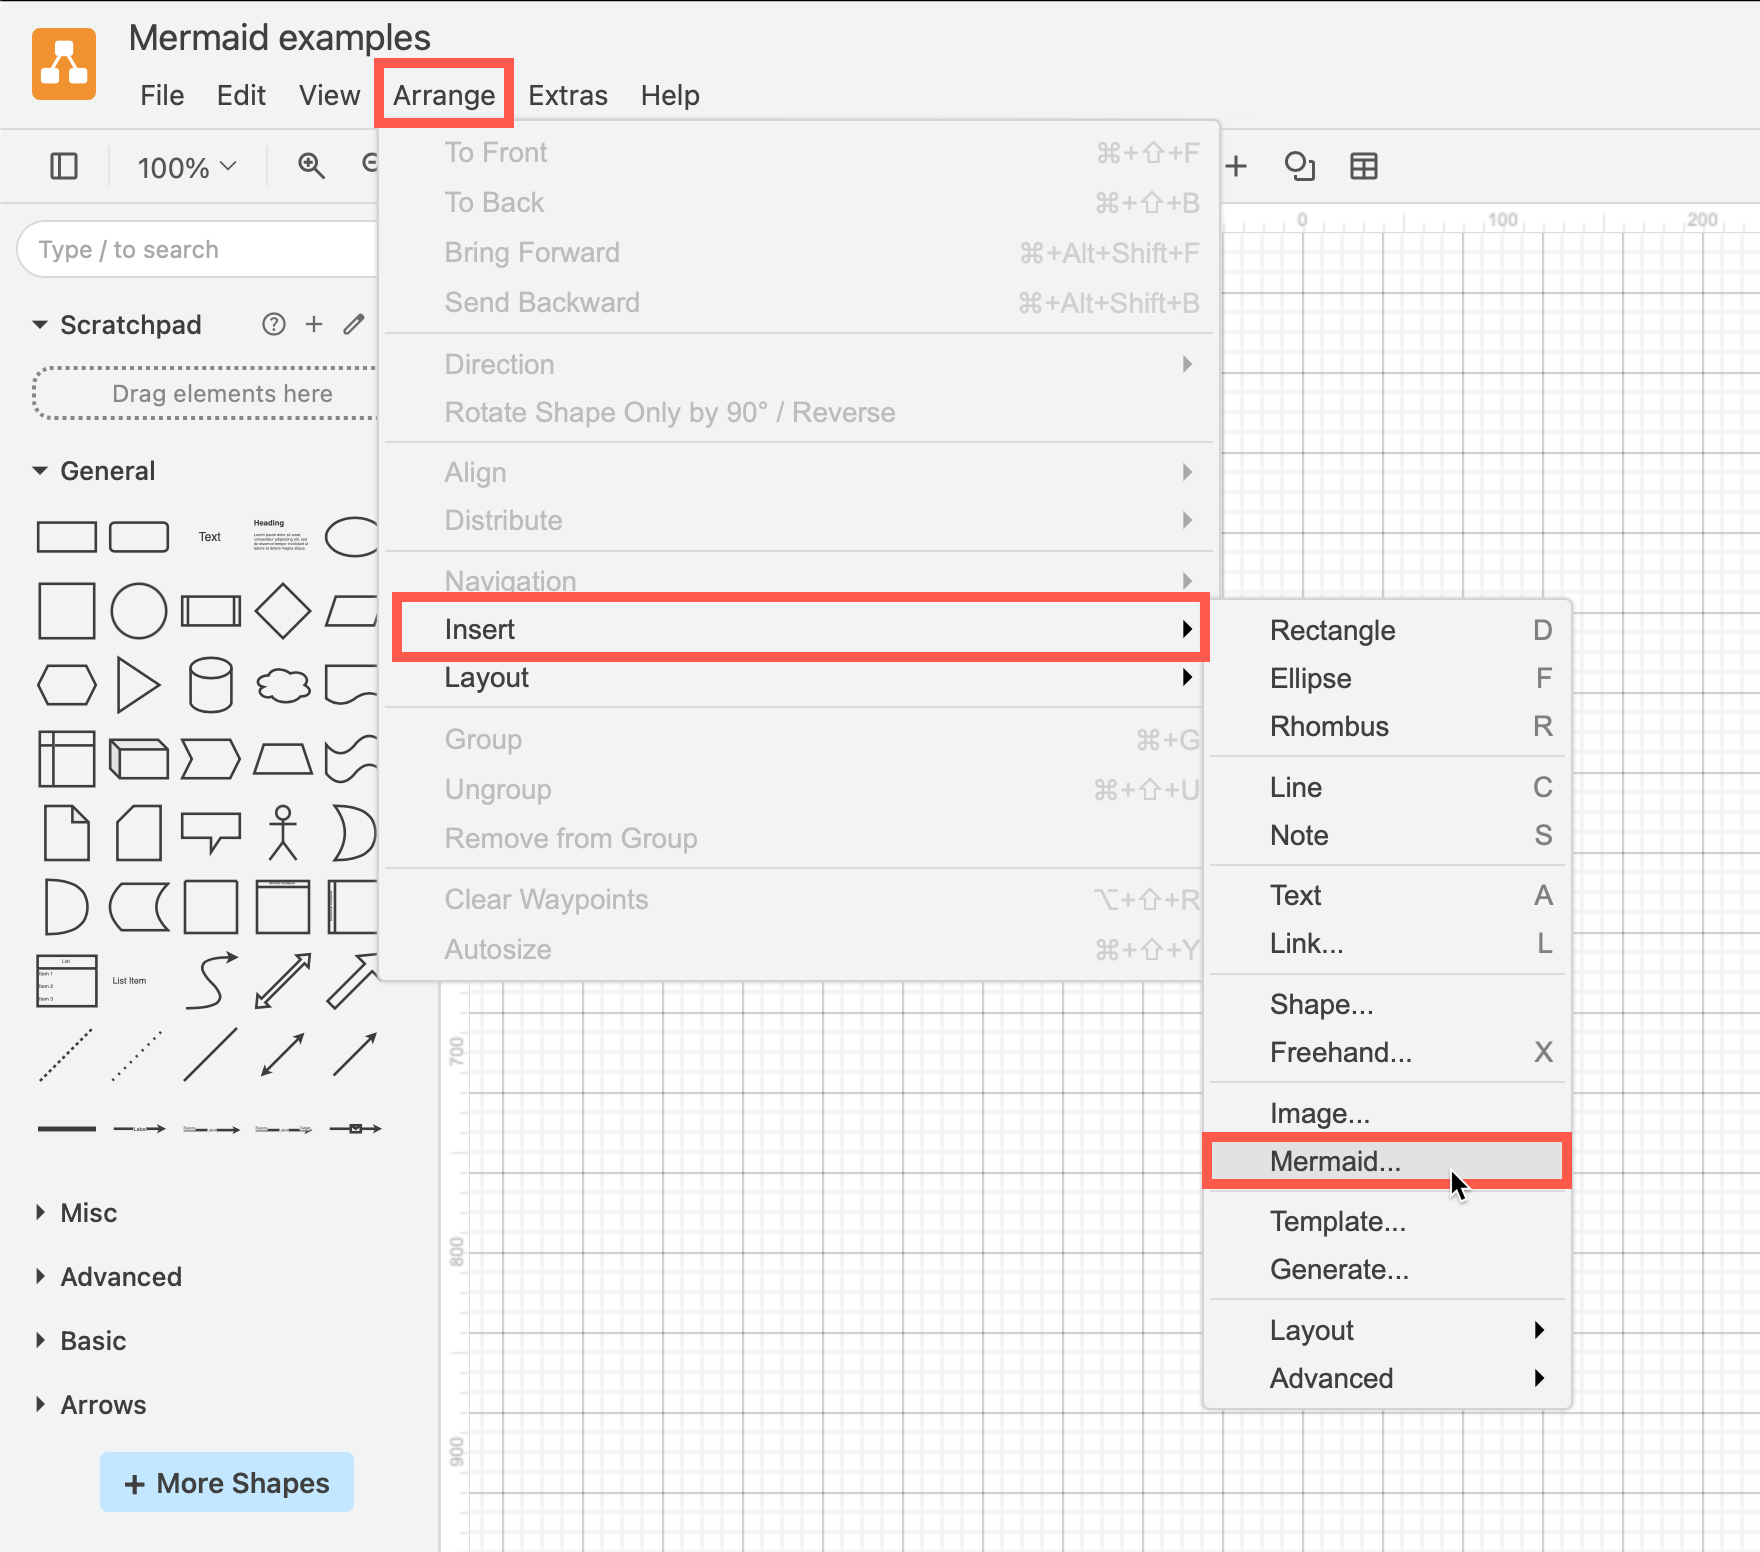
Add this Mermaid diagram to draw.io.
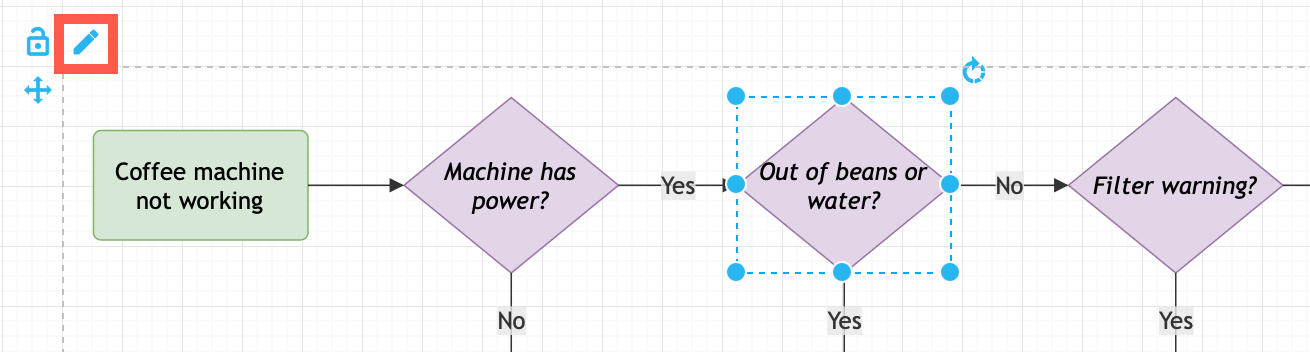
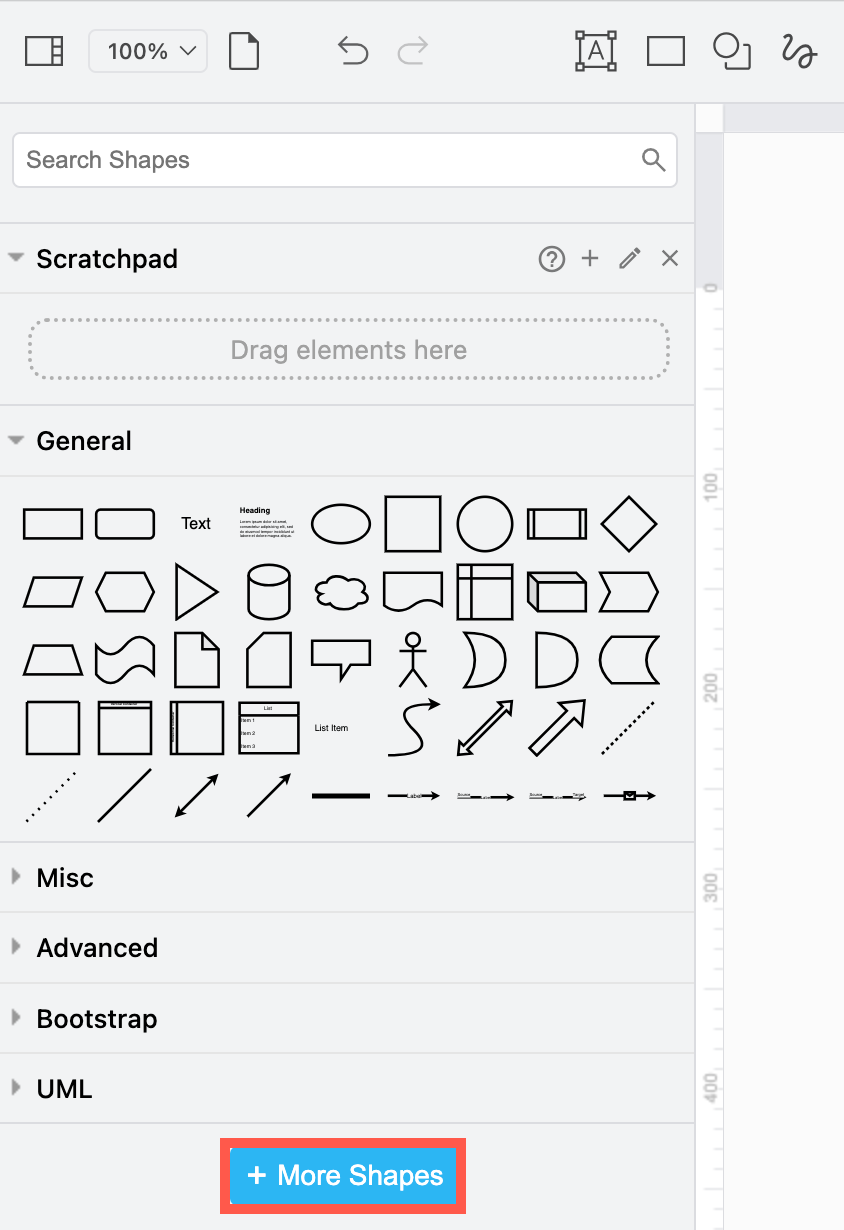
- Select Arrange > Insert > Mermaid from the menu or + > Mermaid from the toolbar if you are using the Simple mode or the Sketch editor theme.
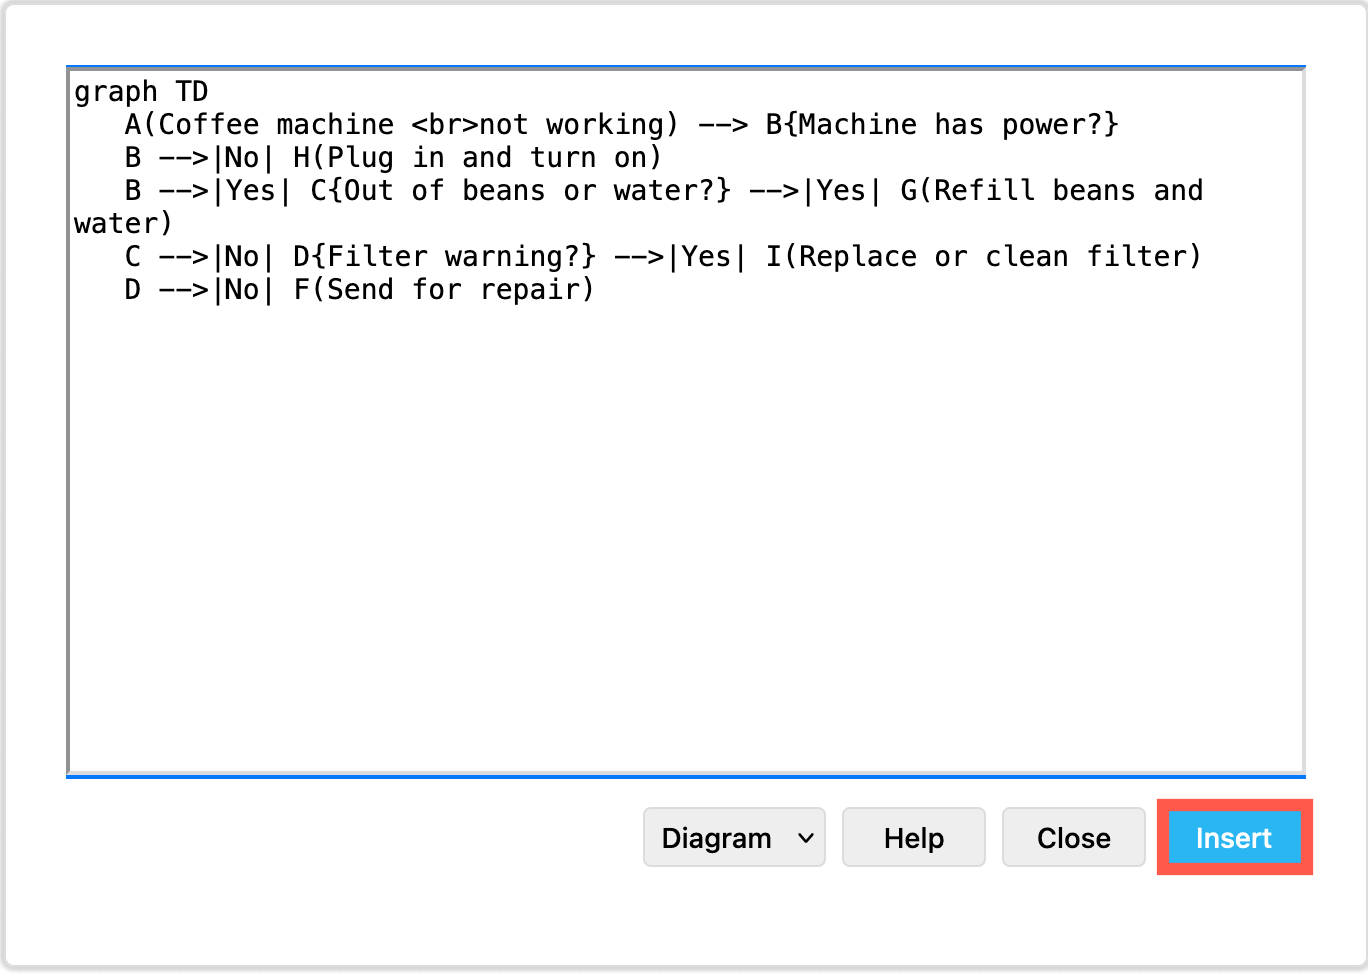
- Enter the text description of your diagram using Mermaid syntax in the large text box.
- From the drop-down list, select whether you want to insert the diagram with draw.io shapes (Diagram), or as a single SVG image (Image), and click Insert.
Please refer to the Mermaid documentation for the complete syntax and styling options.
New ELK layouts for large flowcharts
The new ELK layout option, introduced in Mermaid version 9.4, can generate compacter versions of large and complex flowcharts.
Add the following renderer directive to the top your Mermaid diagram text description:
%%{init: {"flowchart": {"defaultRenderer": "elk"}} }%%
For example, to layout the example Mermaid graph shown above with the ELK renderer initialisation command, the insert Mermaid dialog looks as follows.
Click Insert, and the Mermaid diagram will be generated ad drawn with draw.io shapes.
While this example is small and simple, larger flows with complex decisions and many branches may be displayed better using this ELK renderer option.
Note: As this is an experimental feature from the Mermaid developers, it currently only supports the flowchart layout.
See more about configuring the Mermaid layout engine
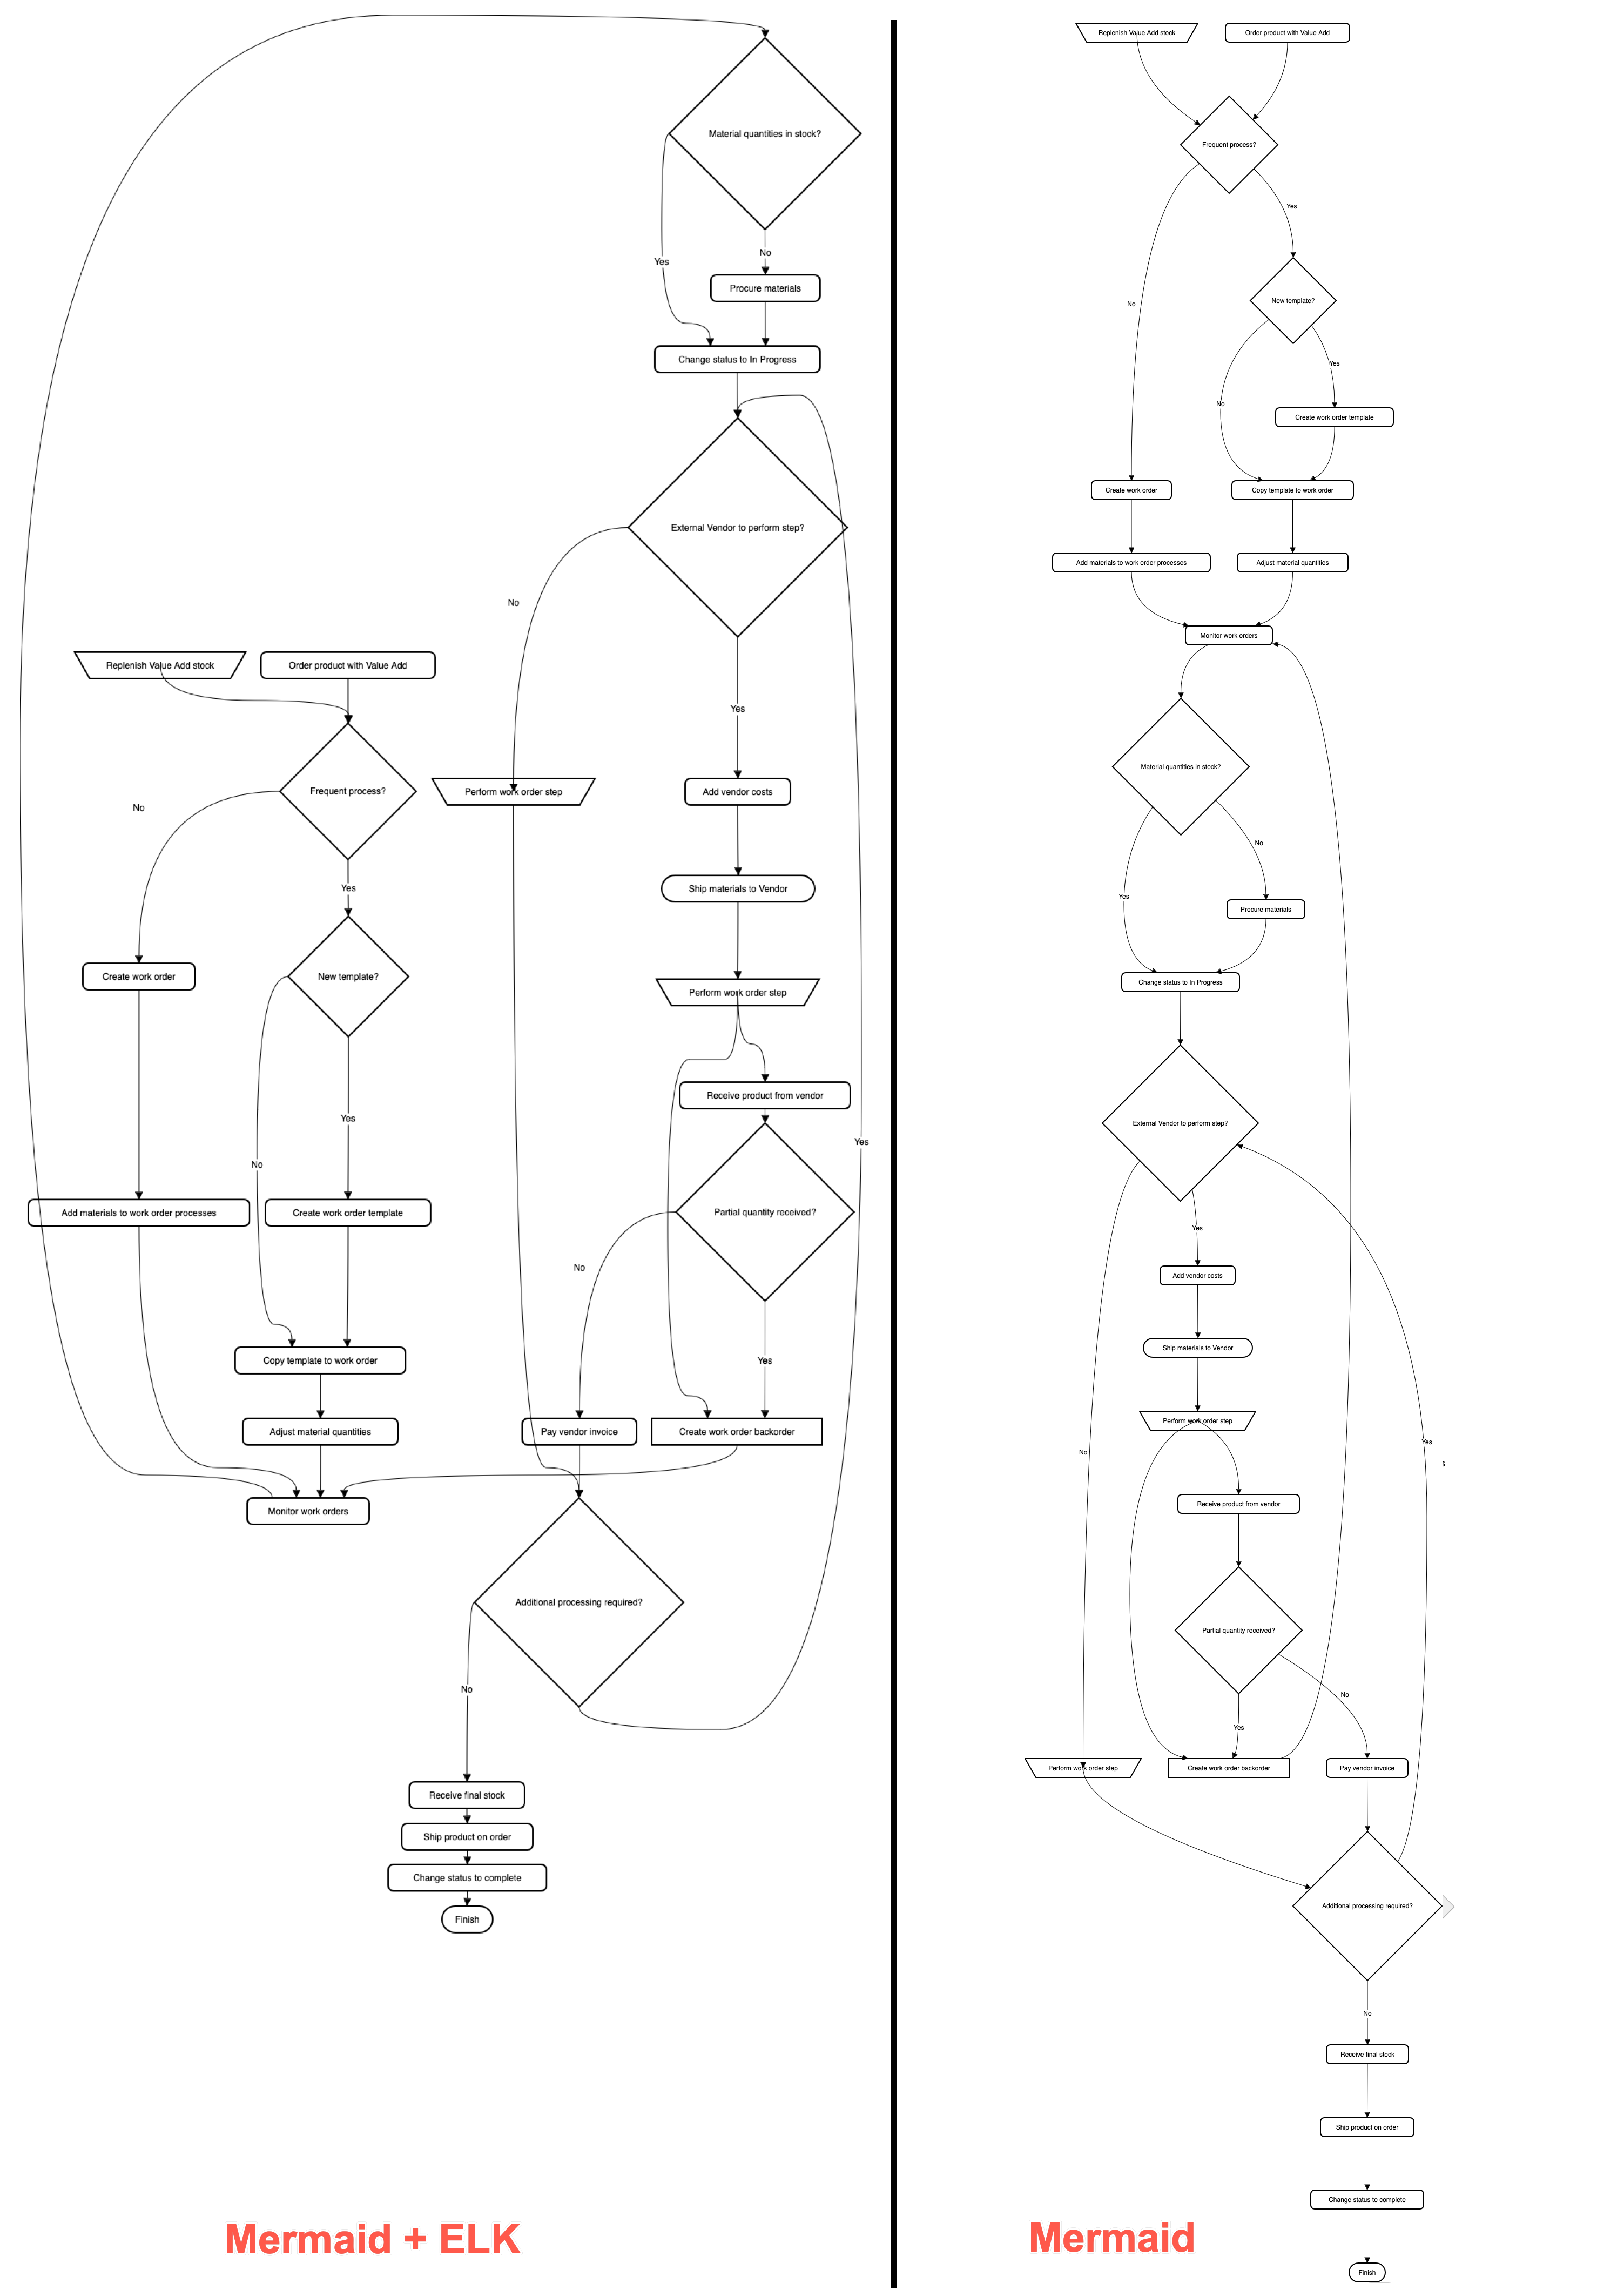
Large Mermaid flowchart with and without ELK
Below, one of the more complex draw.io flowchart templates has described in text using Mermaid syntax and inserted as an image. The more compact version on the left used the new ELK renderer directive, and the one on the right did not.
With the ELK renderer directive, the Mermaid code for this flowchart looks as follows.
%%{init: {"flowchart": {"defaultRenderer": "elk"}} }%%

graph TD
  A[\Replenish Value Add stock/] --->C
  B(Order product with Value Add) --->C
  C{Frequent process?} --->|Yes|D
  C --->|No|F
  D{New template?} --->|Yes|E
  D --->|No|G
  E(Create work order template) --->G
  F(Create work order) --->H
  G(Copy template to work order) --->I
  H(Add materials to work order processes) --->J
  I(Adjust material quantities) --->J
  J(Monitor work orders) --->K
  K{Material quantities in stock?} --->|No|L
  K --->|Yes|M
  L(Procure materials) --->M
  M(Change status to In Progress) --->N
  N{External Vendor to perform step?} --->|Yes|O
  N --->|No|P
  O(Add vendor costs) --->Q
  P[\Perform work order step/] --->R
  Q([Ship materials to Vendor]) --->S --->X
  R{Additional processing required?} --->|Yes|N
  R--->|No|T
  S[\Perform work order step/] --->U
  T(Receive final stock) --->V
  U(Receive product from vendor) --->W
  V(Ship product on order) --->Y
  W{Partial quantity received?} --->|Yes|X
  W --->|No|Z
  X[Create work order backorder] ---> J
  Y(Change status to complete) --->AA
  Z(Pay vendor invoice) --->R
  AA([Finish])