Technical diagramming in Confluence Cloud
Technical diagramming covers a lot of ground across many different professions and fields, not just IT and software development.
As many different types of teams use Atlassian software for their documentation needs, your chosen technical diagramming app should have a wide range of shapes and tools to support the wide variety of technical diagrams that different teams need.
For those who need to be conscious of data security, just like your confidential documentation stored in Confluence and Jira stays there when edited, your diagram data does not leave your instance when you view and edit it with the draw.io apps for Confluence and Jira.
Of course, there are times when this is necessary - you also work with external consultants and partners. With draw.io, you can share diagram files with them (or an image with embedded diagram data) to let them view and edit the diagram files with our web app, and rest assured as our servers do not store your diagram data.
Types of technical diagrams
Here are just some of the technical diagrams that professional teams in different fields need to work.
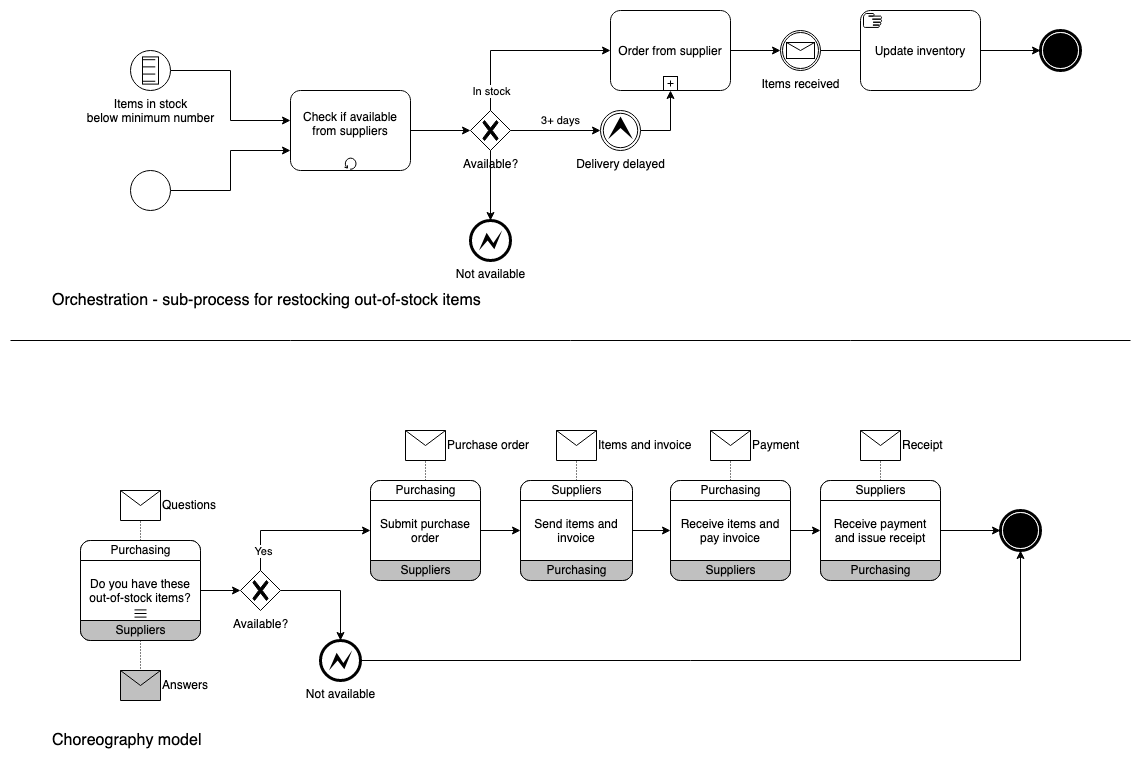
- Business analysts: flowcharts and BPMN diagrams, state charts, concept models, and use case digrams.
- Data analysts: entity relationship and schema diagrams, and IDEF1X graphical information models.
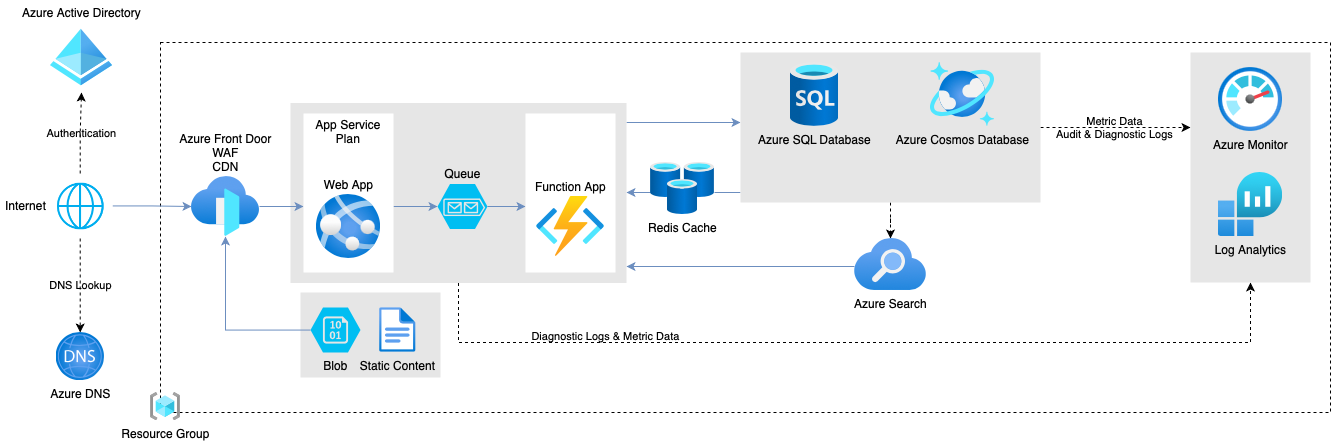
- IT support and cloud architects: system models, deployment diagrams, swimlane diagrams, and cloud and network architectures.
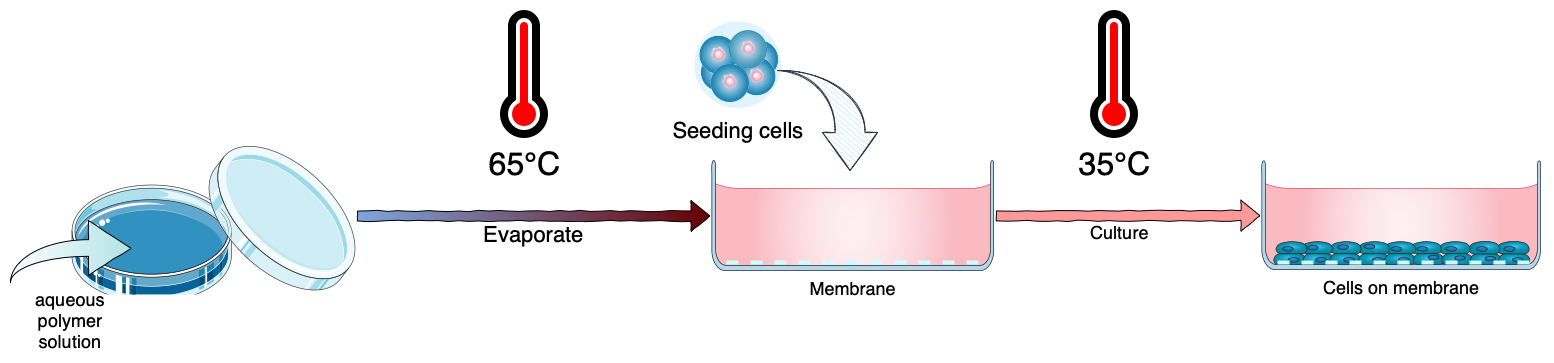
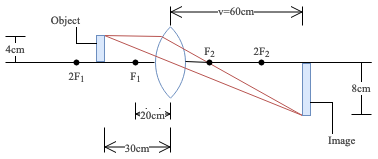
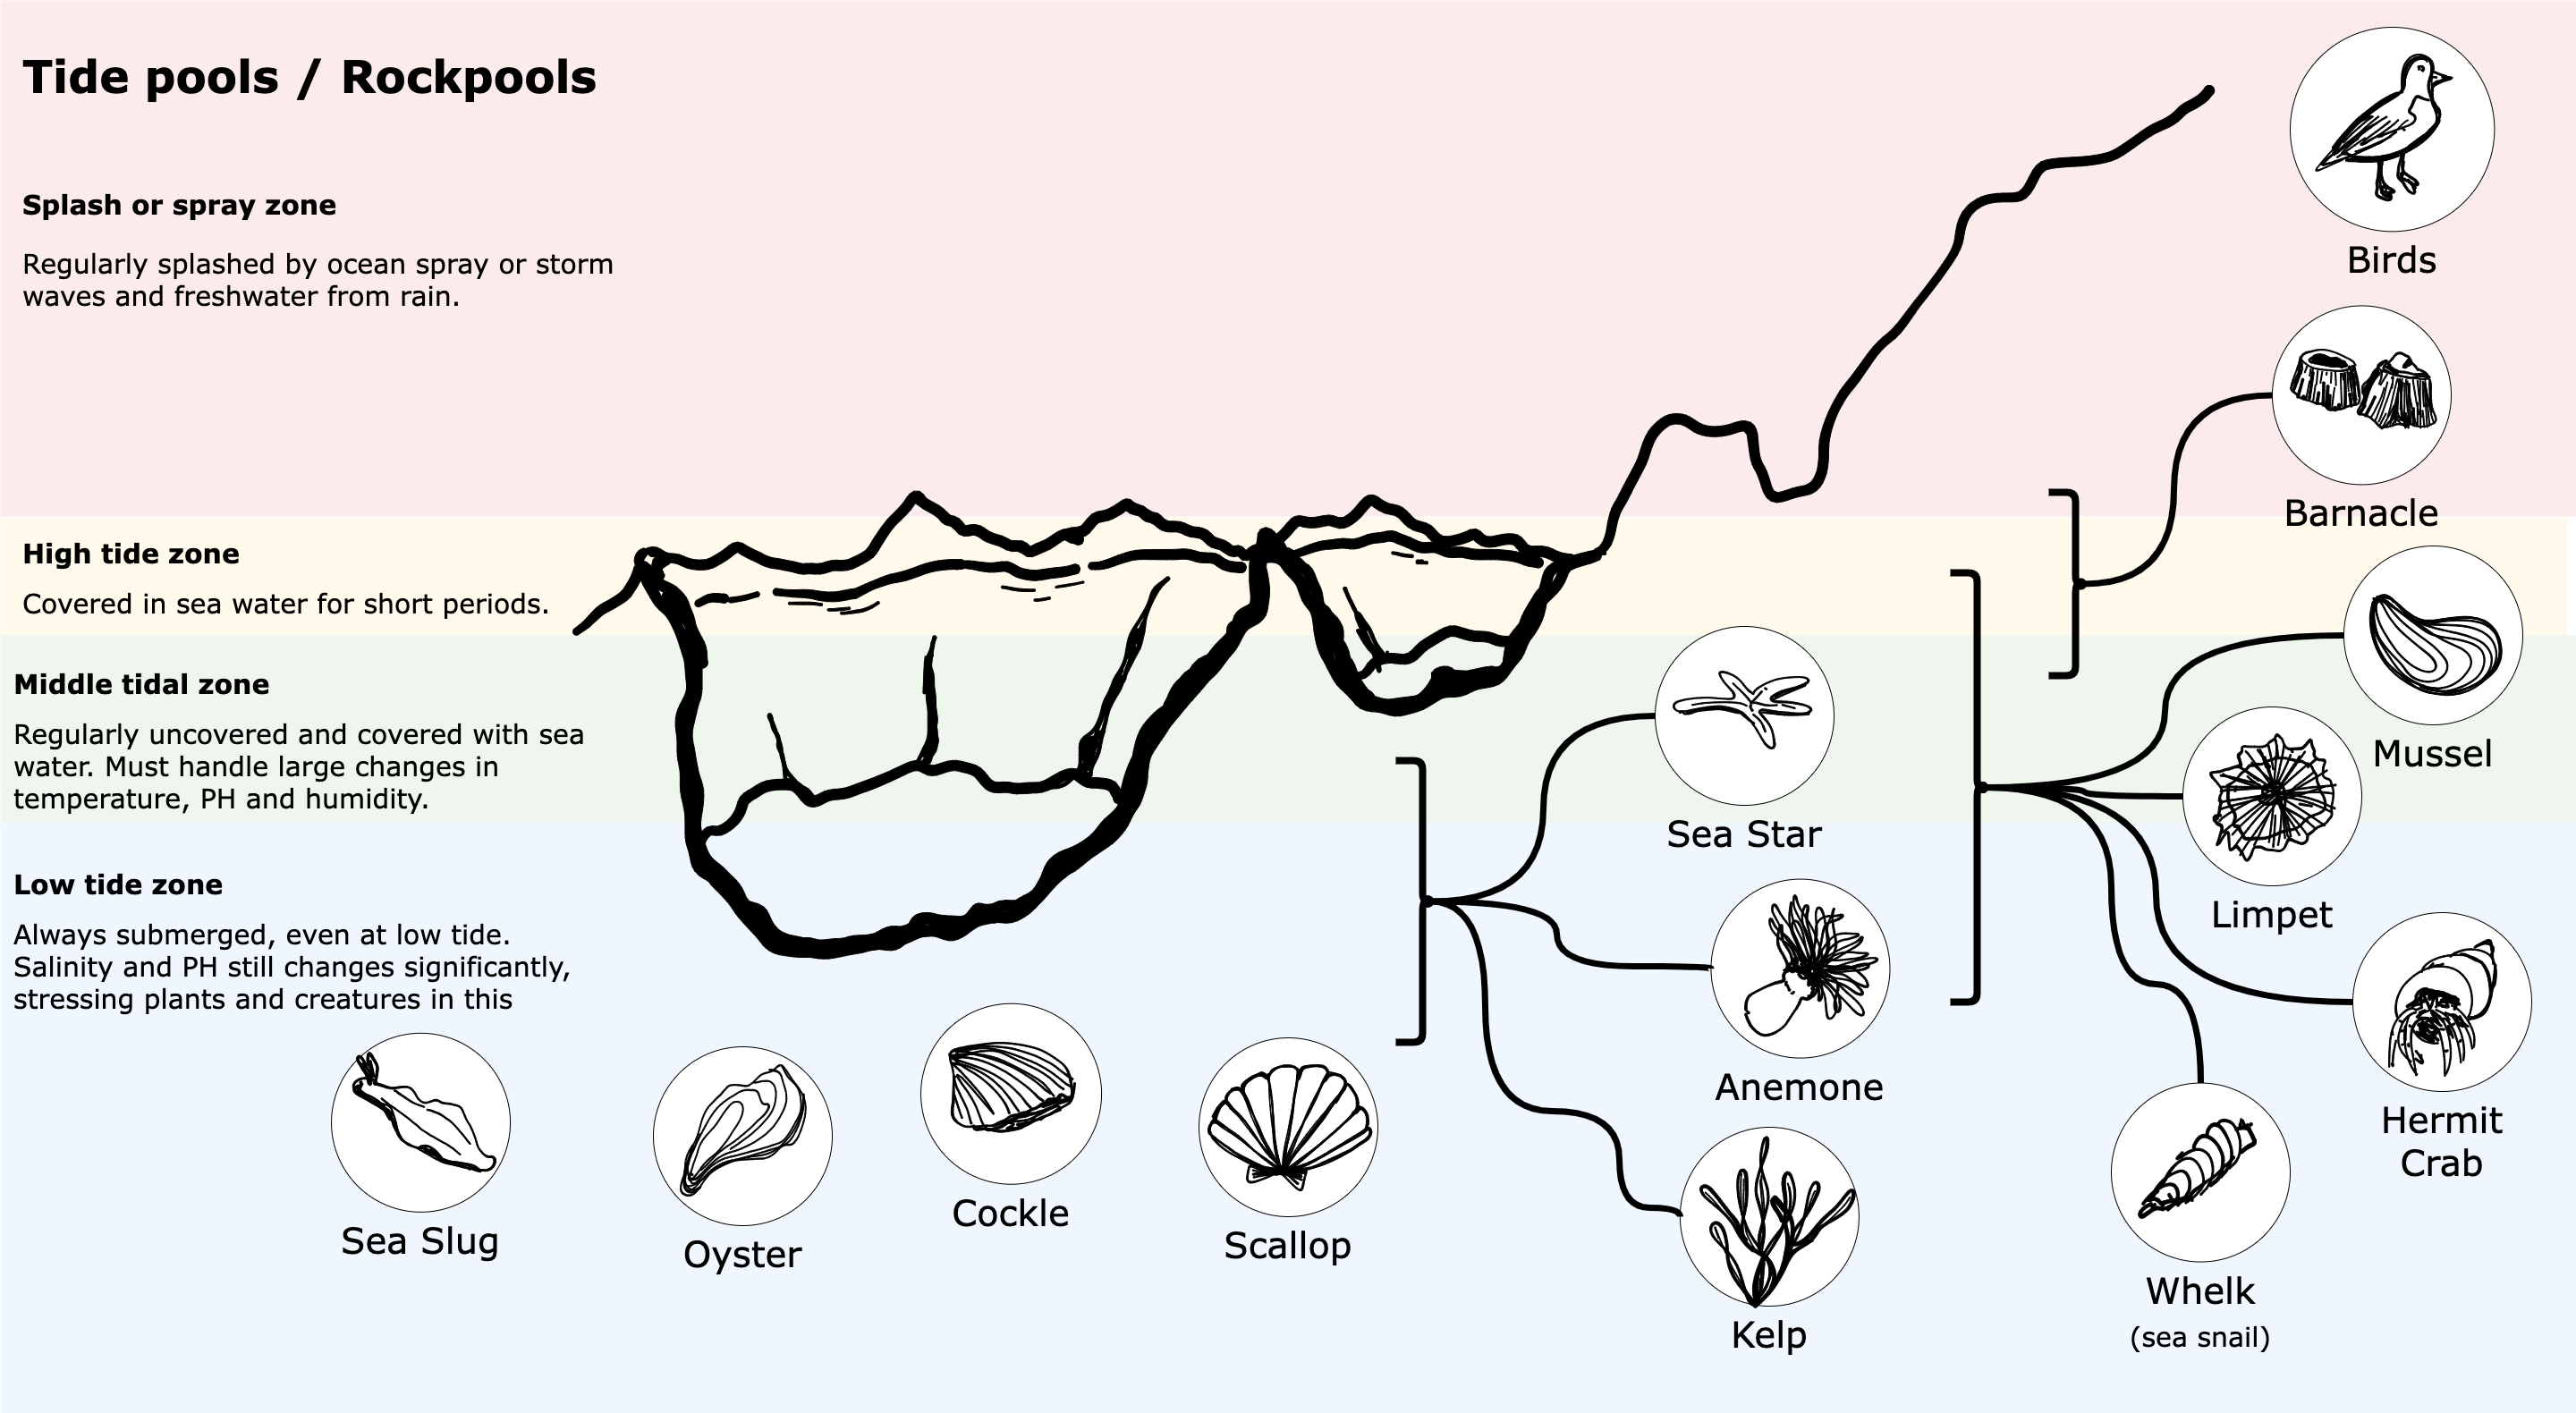
- Education and research: labelled technical illustrations and photos, dendrograms, mathematical diagrams, and charts and graphs.
- Engineering, chemistry and process control: block diagrams, event-driven process chains, catalytic cycles, IDEF0 manufacturing models, and timing diagrams.
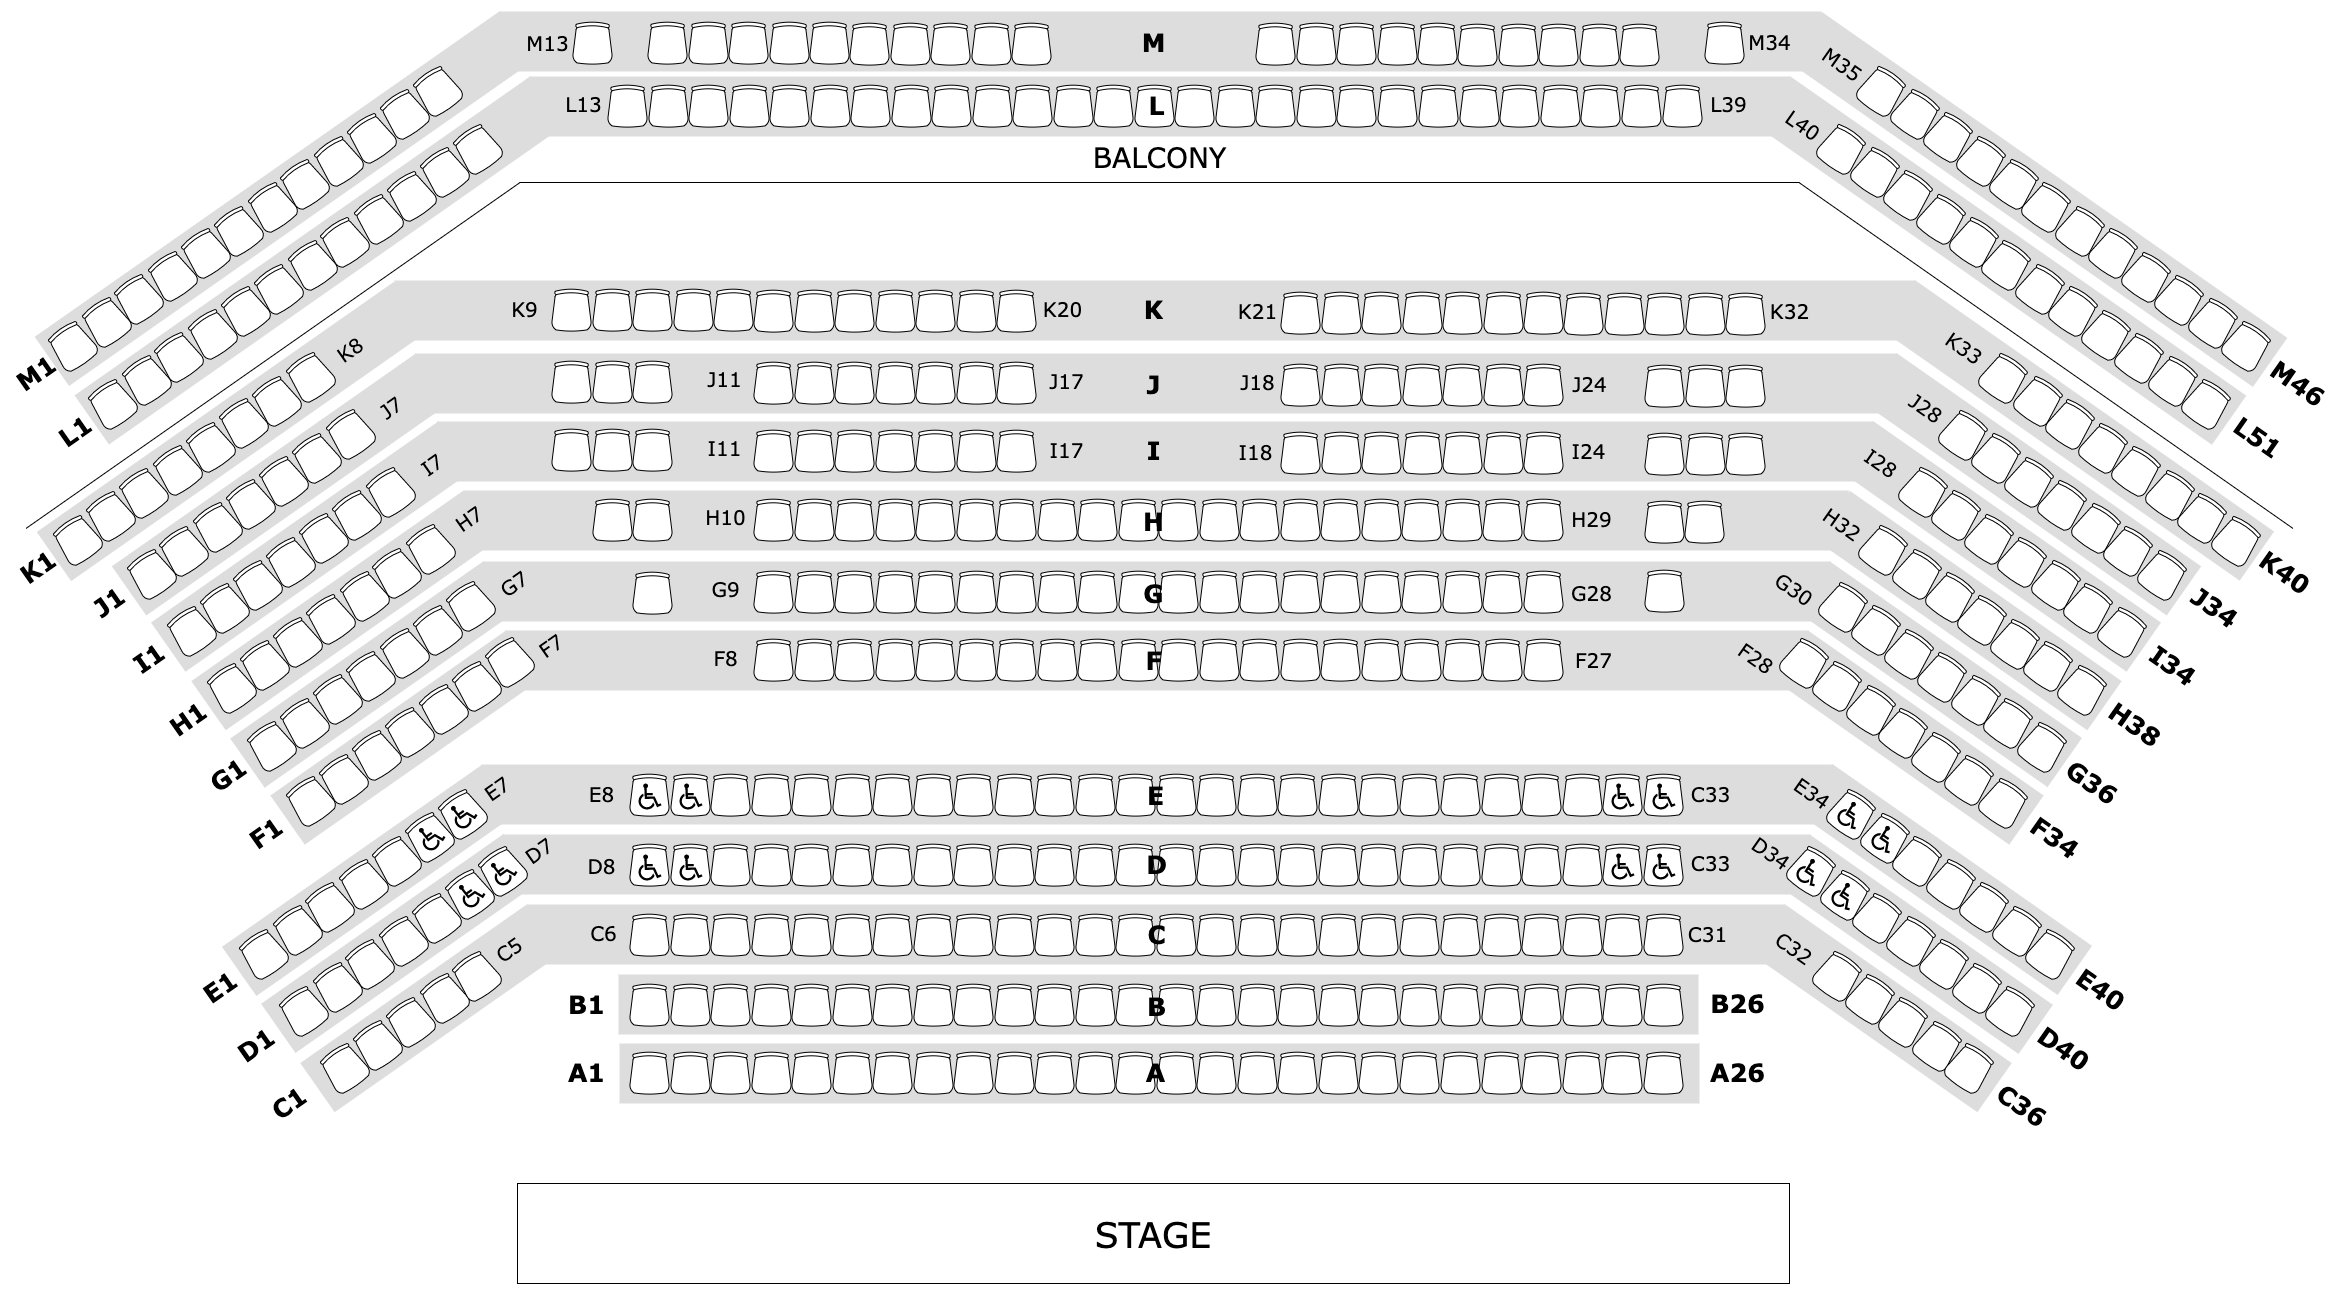
- Marketing and event planning: customer journey maps, context diagrams, storyboards, floorplans and layouts.
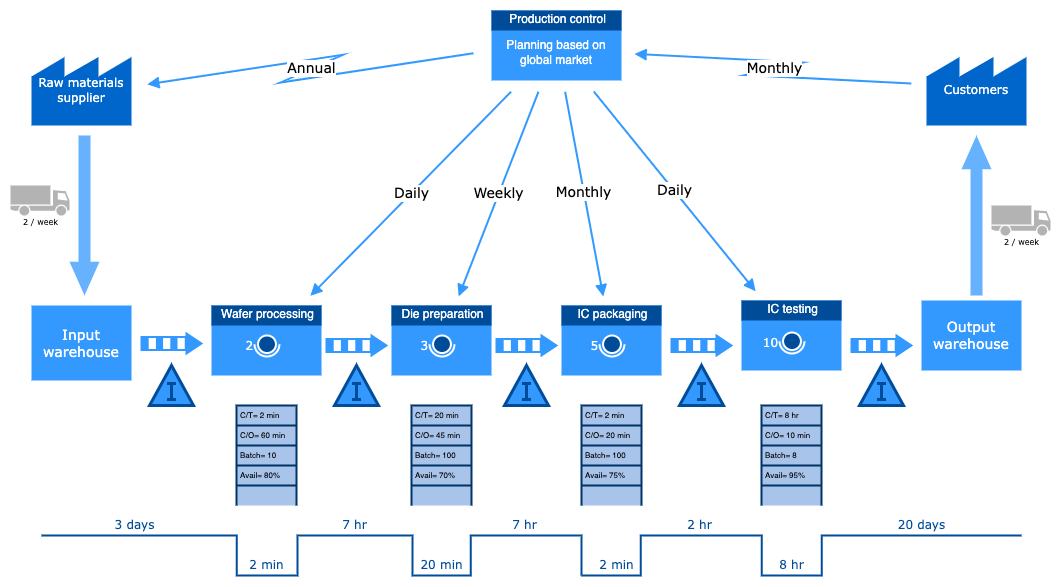
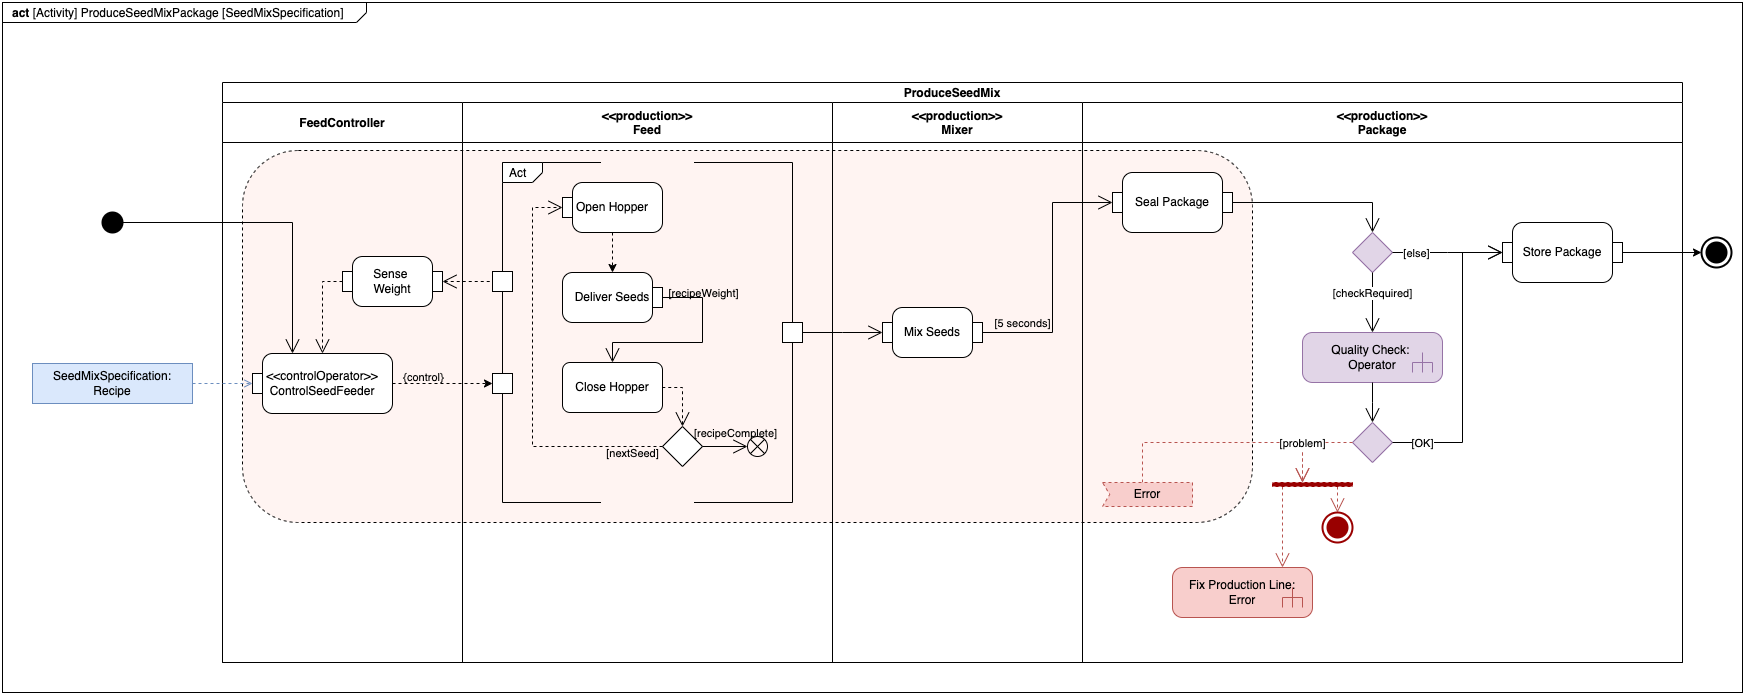
- Production and manufacturing: process diagrams and flows, supply chain models, Ishikawa (fishbone) diagrams, routing diagrams, value stream and lean maps.
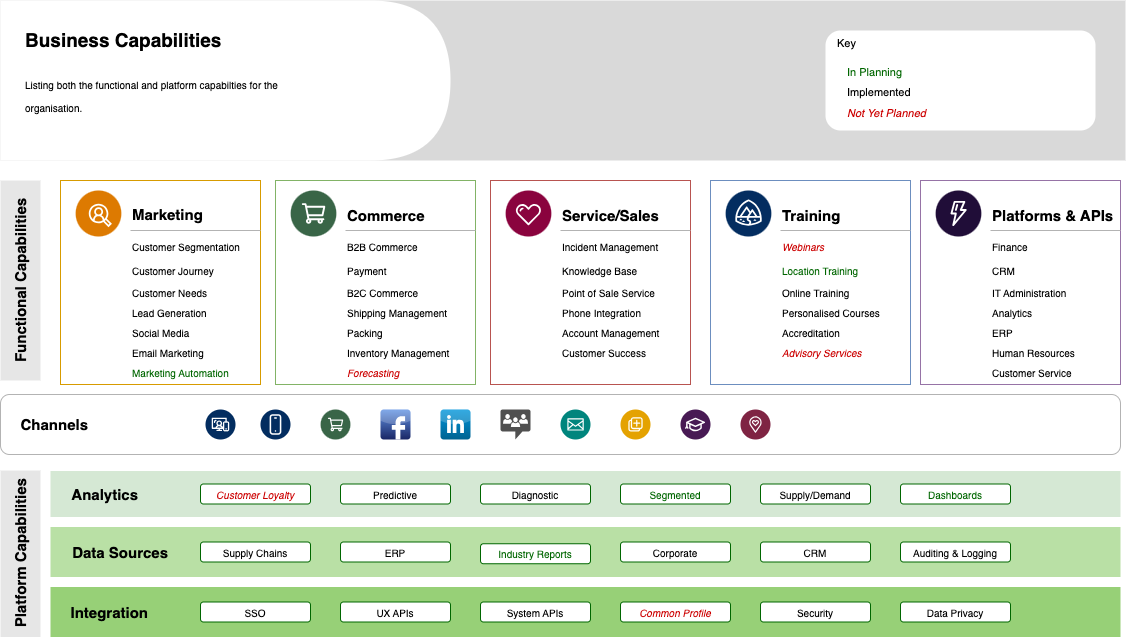
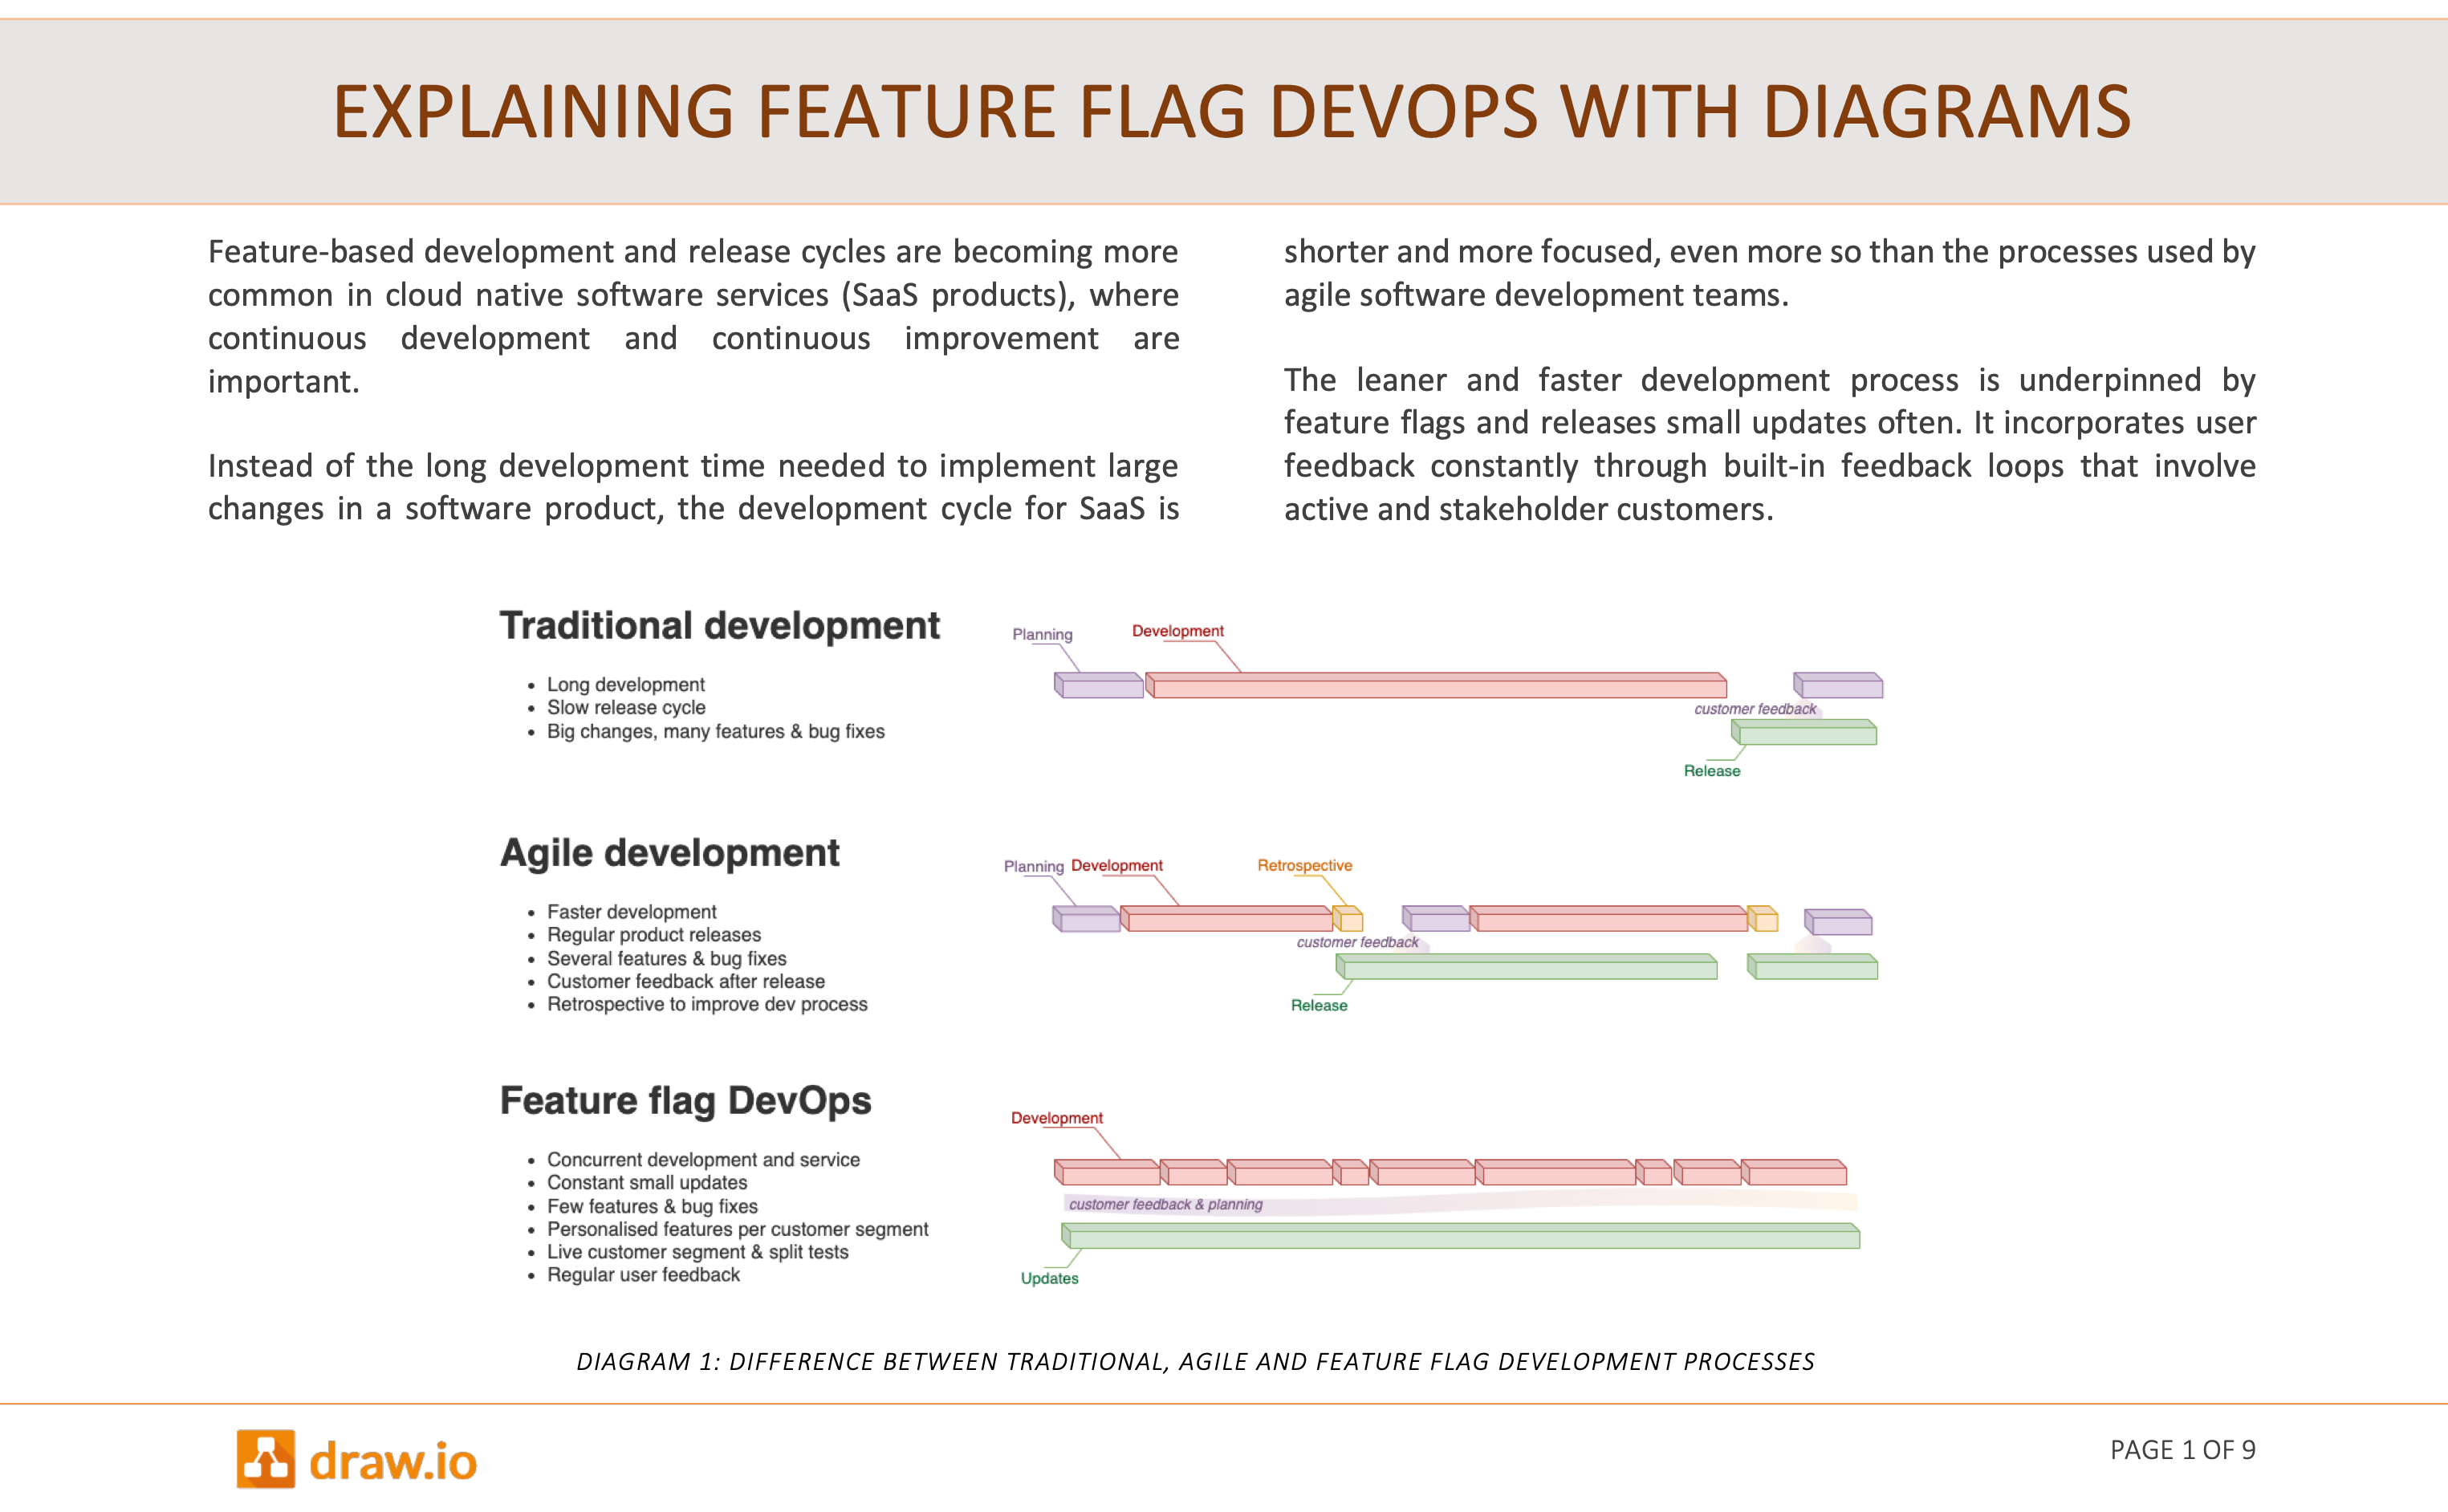
- Project, product and team management: workflows, organisation charts, responsibility diagrams, roadmaps, Kanban boards, capability diagrams, Gantt charts and PERT charts.
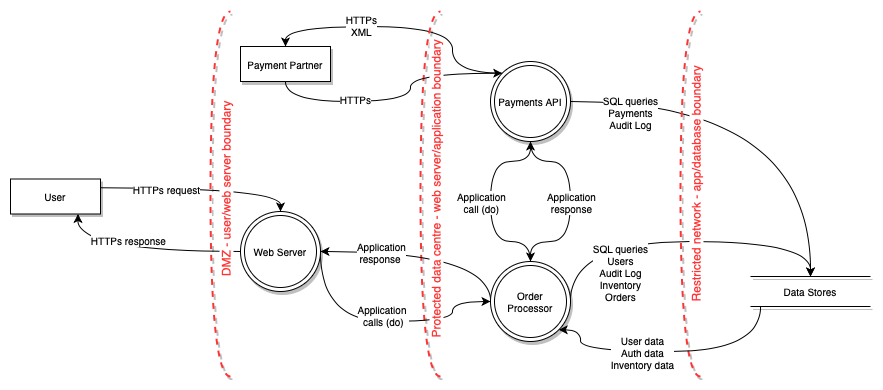
- Risk management and security: decision trees, data and process flow diagrams, incident response documentation, attack trees and influence diagrams.
- Software development: gitflows, UML diagrams, user flows, dependency graphs, sequence diagrams, and C4 models.
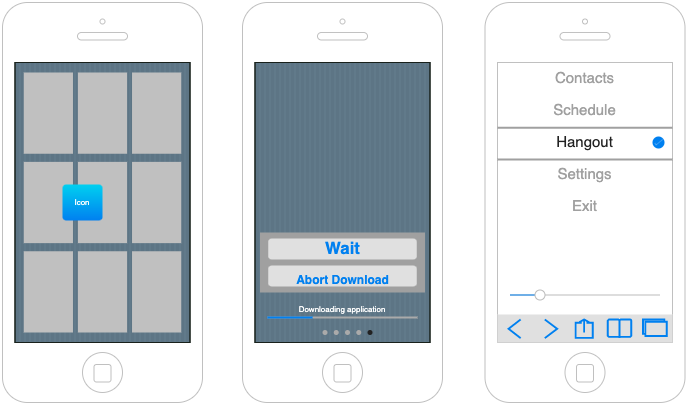
- User experience: mockups and wireframes, concept maps, and experience models.
Diagrams for presentations, documents and online content
Of course, you can also create non-technical diagrams in draw.io, including infographics, freehand line drawings, charts, brainstorming boards, mindmaps, and many more.
With our vast shape libraries, templates and examples to suit a wide range of diagrams, and even more with the custom libraries created by our users available on GitHub, it's easy to create whatever graphics you need in draw.io for presentations, documents, and online content.
Tip: Annotate diagrams directly in the editor
With the freehand tool (via the toolbar, or Arrange > Insert > Freehand), you can draw freehand shapes, annotate or mark up diagrams with your mouse (or a stylus on a tablet) without leaving the diagram editor, to show your team members quickly where changes need to be made.
What makes a diagram technical?
Every field claims the term 'technical diagrams' or 'technical drawing' as their own, narrowing down the list of diagrams types to those used only within that field. But they all have one thing in common - technical diagrams relate concepts, show context, and document the planning, design and/or implementation of a product, process, system, organisation, or service.
For more technical diagramming use cases, stop by our blog.