Flowcharts and templates in Confluence Cloud
Teams use Confluence Cloud for many reasons - documentation, training, project management, development, business planning and more. All of these teams need to present information clearly and concisely - complex information is best presented visually in diagrams.
Draw a basic flowchart
It's easy to create a basic flowchart.
- Draw a rectangle for each activity in the process and add a label to describe that step.
- Draw a diamond for each decision and add a label (usually a question).
- Connect the steps and decisions with arrows indicating in what order they are completed, and label the decision connectors.
For example, when using draw.io for Confluence or Jira, drag a shape from the left shape library, or double click on the drawing canvas to add a new shape. Drag a connector from the direction arrow and drop it on another shape to connect them.
Alternatively, start with a flowchart template, add shapes, labels and style it quickly.
Use specialised flowcharts in teams
There are many different forms of specialised flowcharts, in addition to the basic visual representation of choices and steps in rectangles and diamonds.
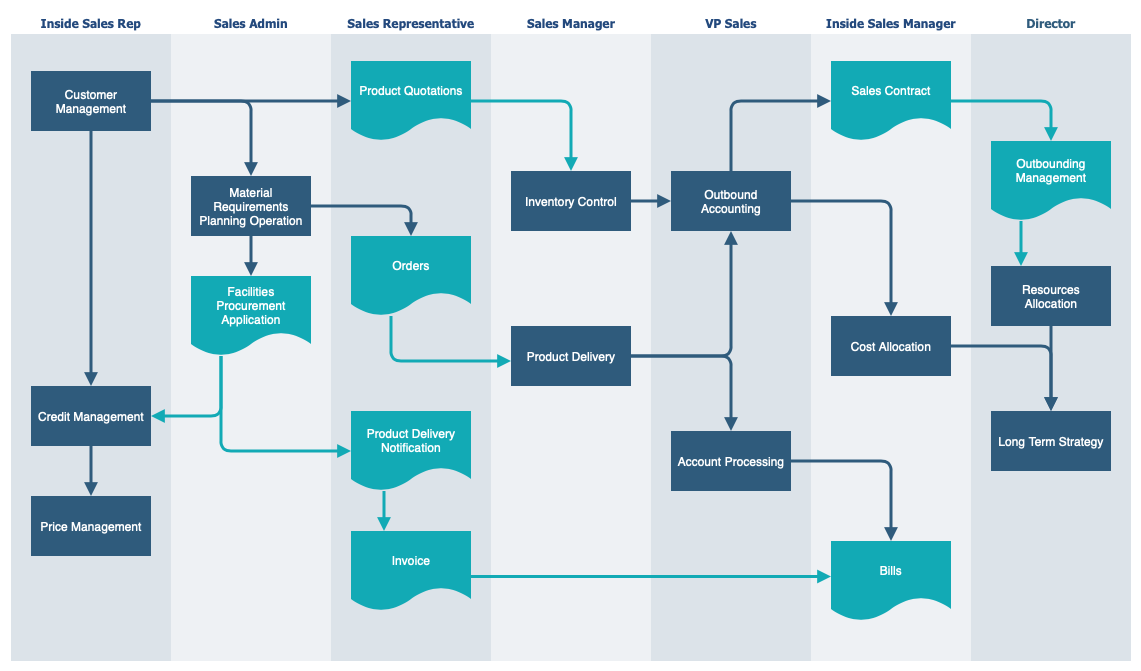
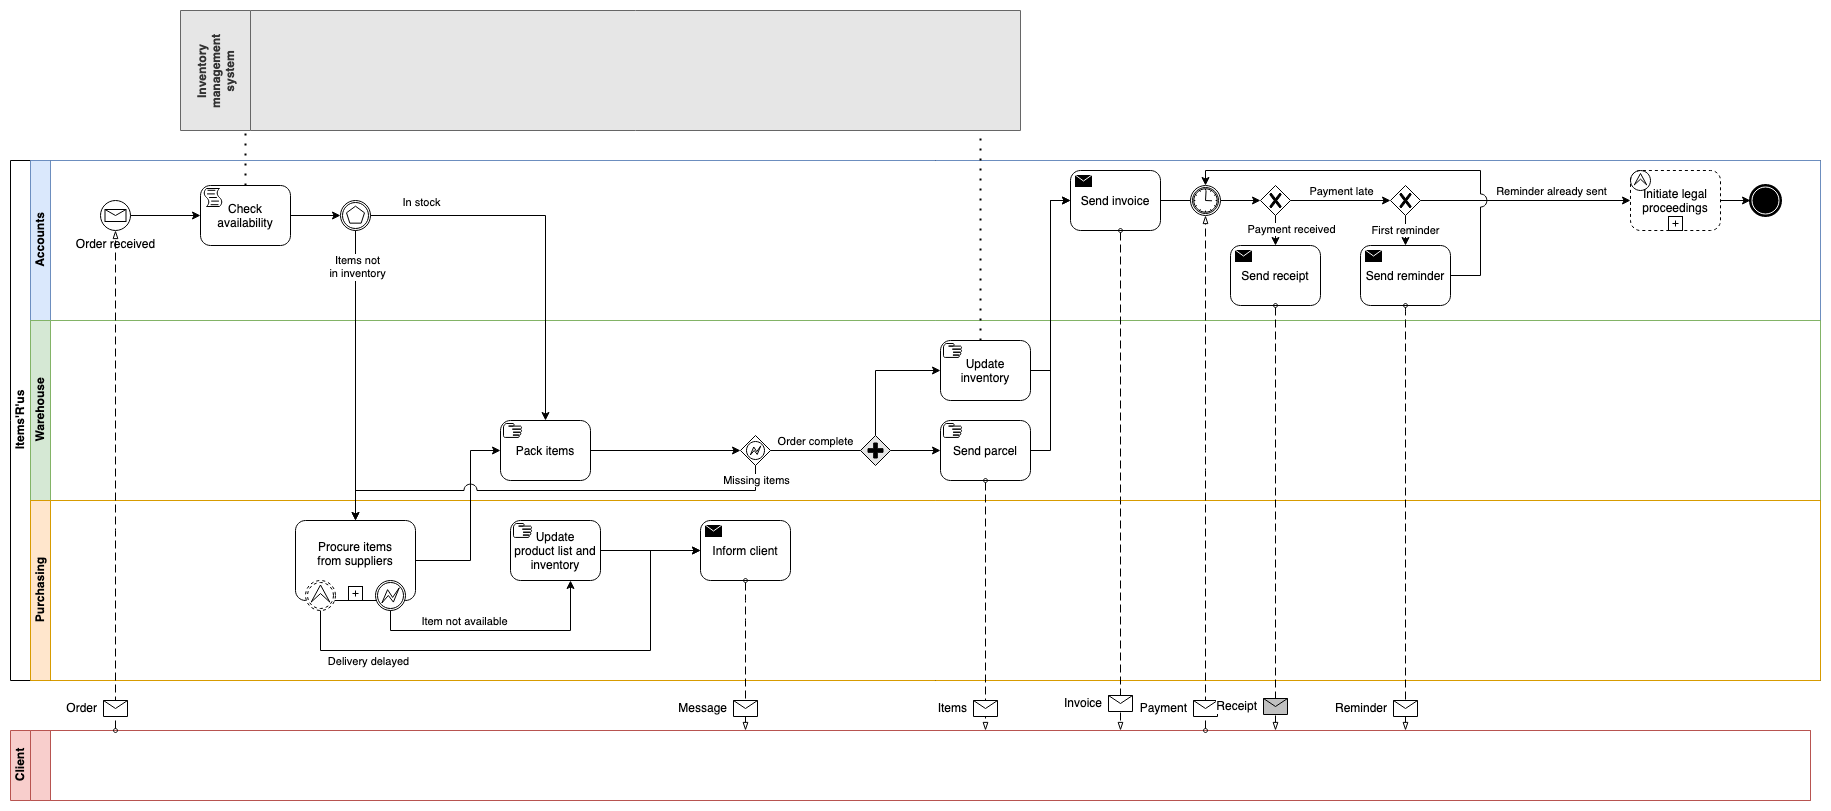
- BPMN diagrams with swimlanes or cross-functional flowcharts, enterprise models and PERT charts are some of the more specialised flowcharts used in business development and project management.
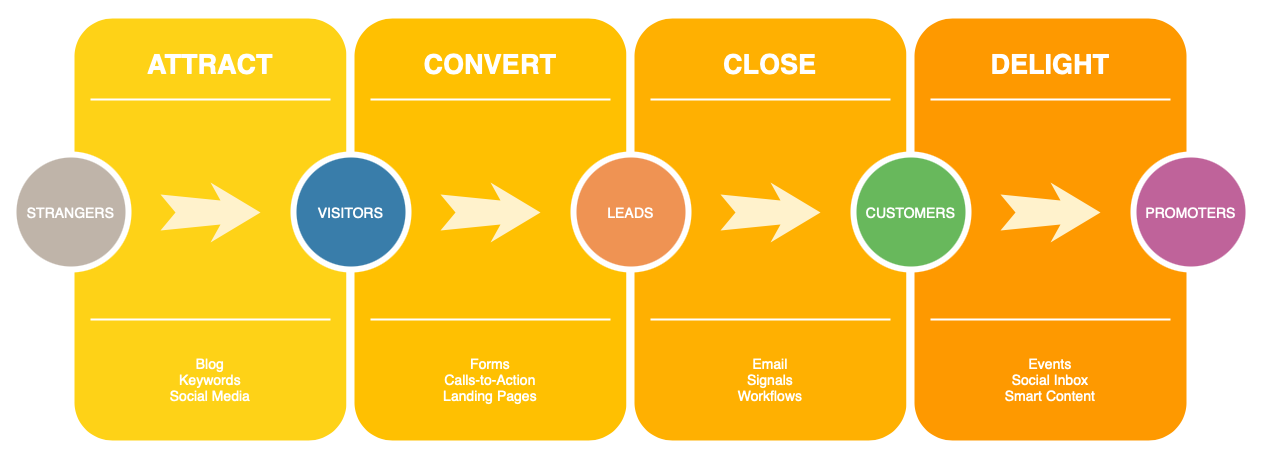
- Story maps and customer use cases are used alongside standard flowcharts by marketing teams.
- Gitflows, data flow diagrams, and several types of UML flows, including use case, activity and sequence diagrams are an integral part of documenting software projects.
- Application threat models and architecture diagrams showing data flow are used by IT service teams.
Tip: Specialised flowcharts often have their own specific notation. draw.io provides you with shape libraries for the diagrams above and more. In the left panel, click More Shapes to see all of the shape libraries. You can also create your own custom shape libraries.
Keep your flowcharts secure
As flowcharts can contain confidential or sensitive information, you may not want to share that data with anyone outside your company or outside your host instance. Atlassian's data governance settings allow administrators to choose the region where your data resides when a Confluence Cloud or Jira Cloud user is not editing a page or issue.
With the draw.io apps for Confluence and Jira, your flowchart data stays in the user's browser as they are editing, and in your Confluence Cloud or Jira Cloud instance at rest. Optional conversion features, such as import conversions, can be disallowed in the configuration settings.
Start with an example or template flowchart
If you aren't sure where to start, template or example diagrams give you a good idea of how each specialised flowchart is drawn.
Click on the example diagrams below to open them in a free diagram viewer, provided by the developers of the draw.io apps.
Marketing: A marketing process exploring how to attract, convert, close and delight customers.
Business: BPMN diagram illustrating the process of ordering a product.
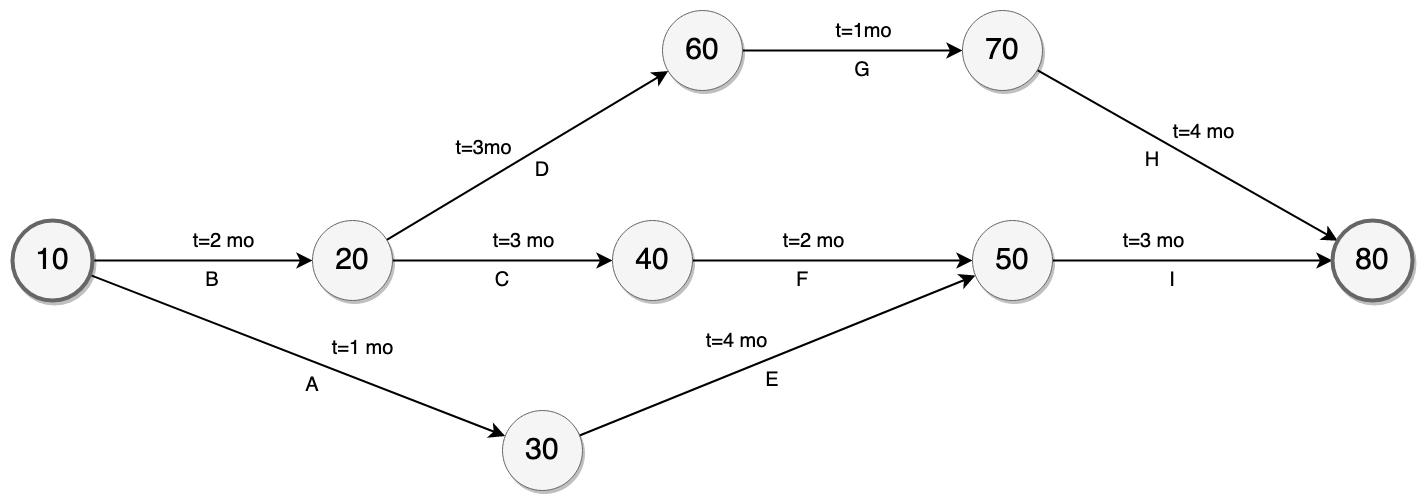
Project management: PERT chart to visualise the dependencies and times needed for project deliverables.
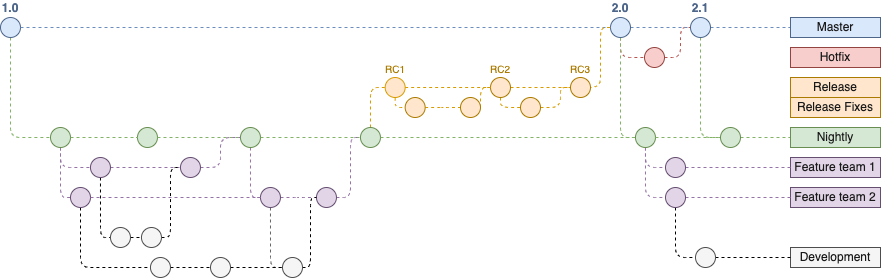
Software development: Gitflow diagram to visualise a version control process
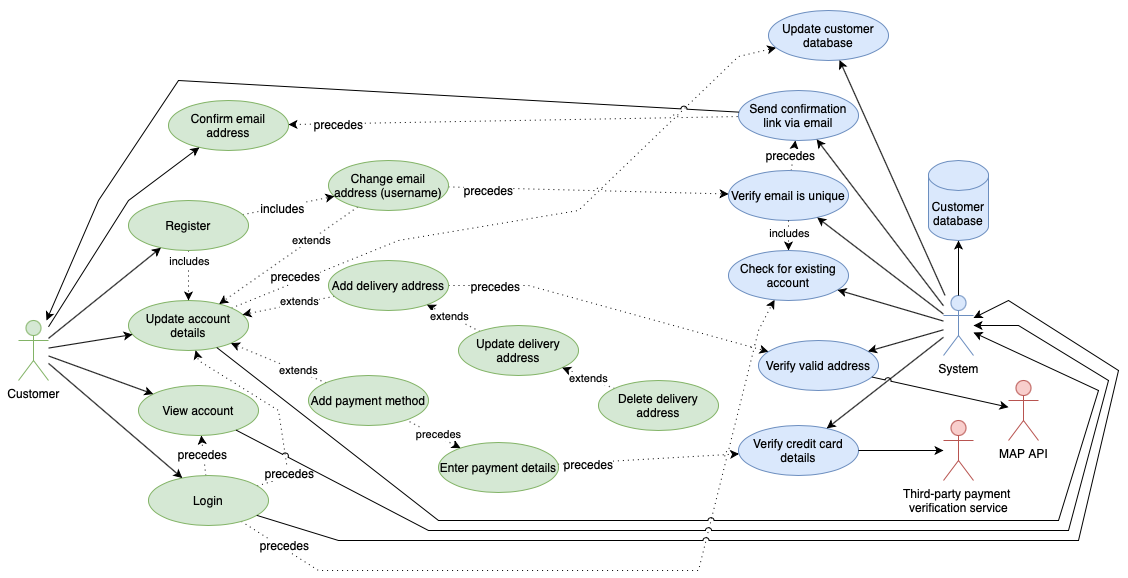
UML: UML use case for a customer updating their own payment information in an online store.
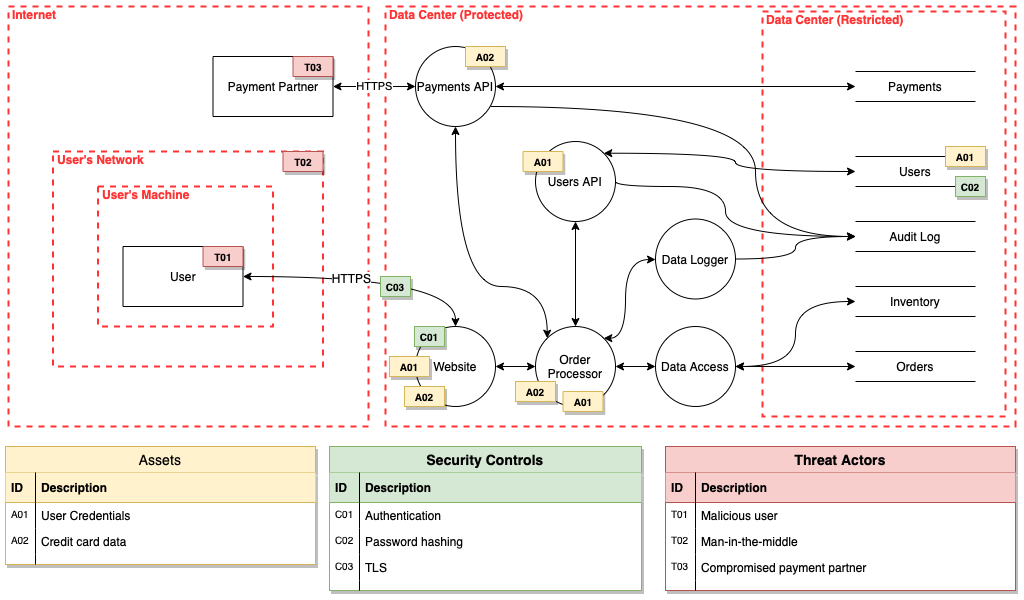
IT services: Application threat model
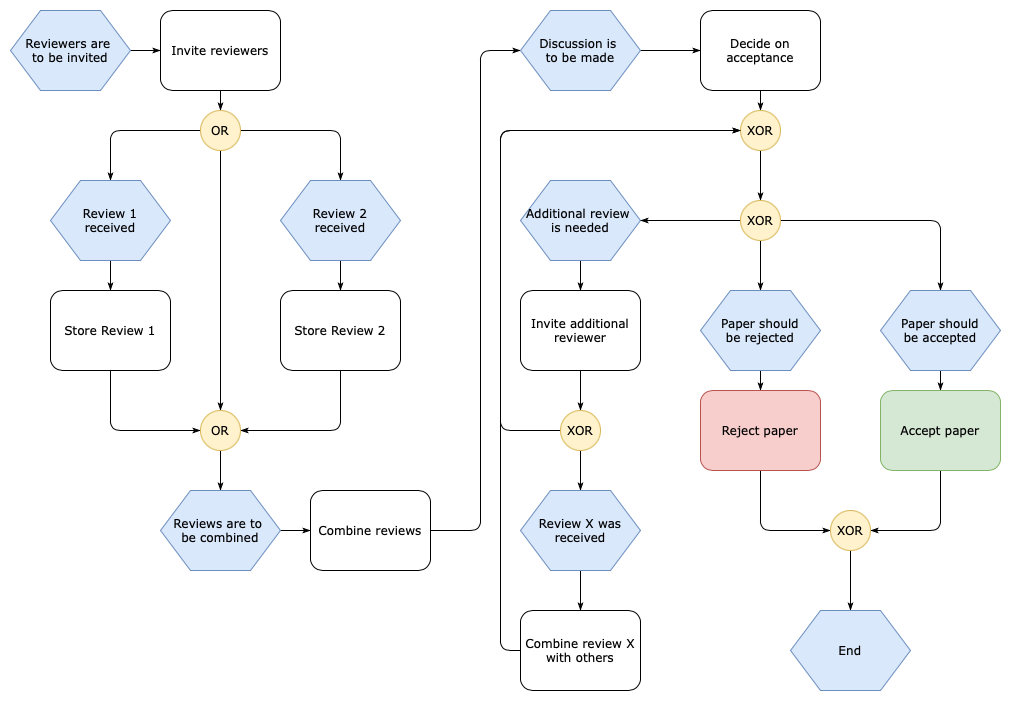
Publications and events: An event-driven process chain flowchart for accepting a paper.
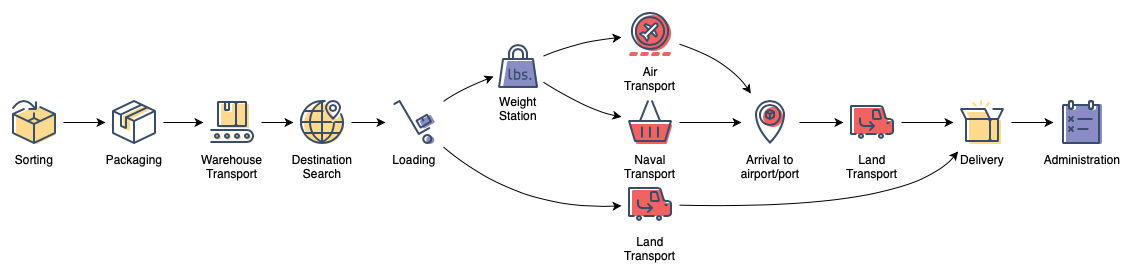
Supply and transport: An example visualising a goods delivery process.
Tip: There are many more flowchart templates and example diagrams that are available for free in draw.io for Confluence and Jira. You can create your own custom template diagrams and store them in your Confluence instances to ensure a consistent style or make the diagramming process faster.