Create data-driven diagrams with draw.io
Using diagrams.net or draw.io together with scripts and data sources, you can create data-driven diagrams, with colours, shapes, text labels and even animations that change to reflect live data.
Aside from live diagrams of cloud network infrastructures, and charts that visualise data in graphs, there are few true data-driven diagrams. As draw.io does not include spreadsheet or graph functionality - it's a diagram editor - dynamically updated charts are not possible.
You can program your own scripts or use integrations with other applications to achieve data-driven diagrams where diagram shapes change to reflect live data because draw.io is open source and the .drawio diagram format uses accessible XML.
How it works
Each shape in a draw.io diagram has a unique shape ID.
Because the diagram data is stored in your file using XML tags, you can use a script to search for the shape ID in the XML source and replace common shape properties with a different value to reflect the data at that time.
What you'll need
- diagram created in the draw.io editor and saved as an XML file
- application or script to do the following:
- display and refresh the diagram
- query or read the live data
- analyse the data values and update the shape properties in the diagram according to programmed rules
Example - factory status floorplan
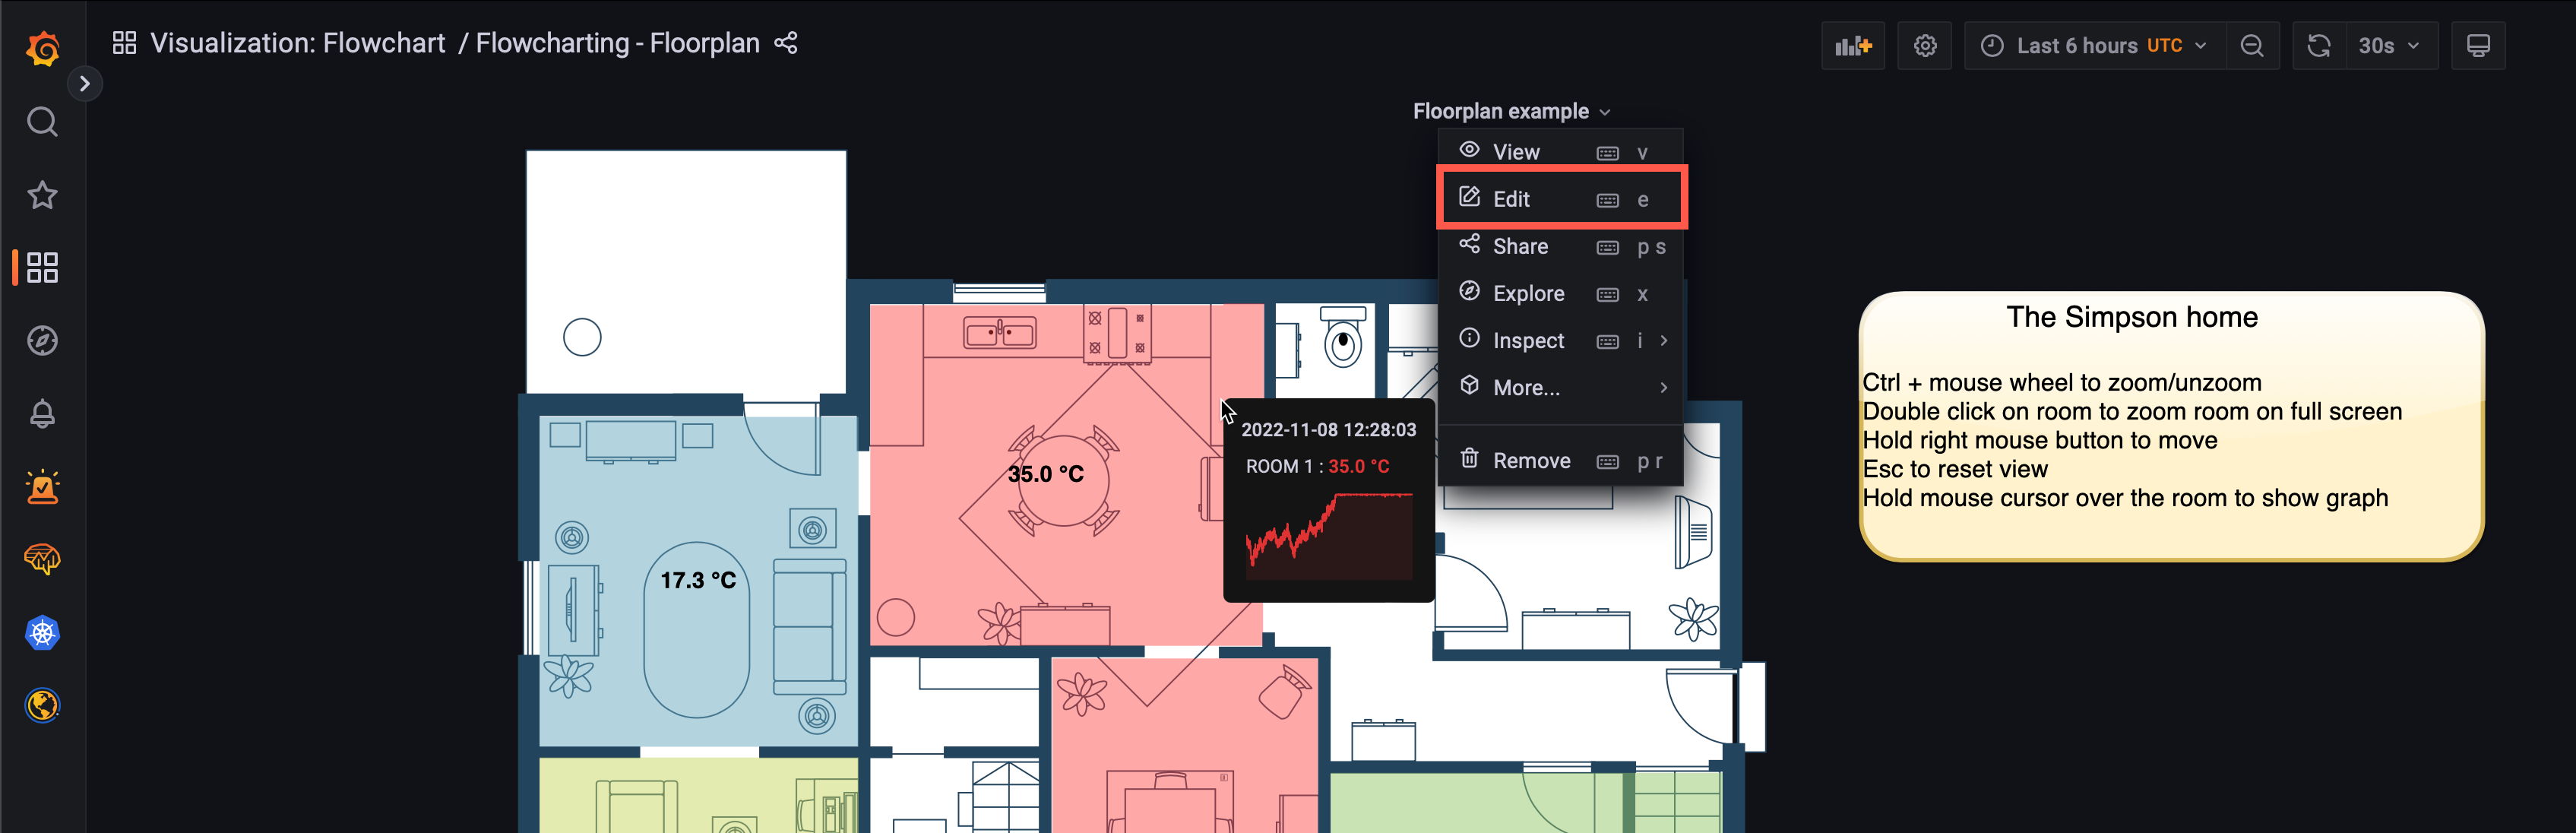
To show you how to build such a data-driven diagram, we'll use an example of a dashboard that shows the status of a machine on a factory floorplan based on real-time sensor data from that machine.
This example uses Grafana and Arnaud Genty's Flowcharting plugin to feed the real-time sensor data recorded in a database to scripts that update the shapes in the diagram based on rules that we define.
Draw your diagram and set it up for data
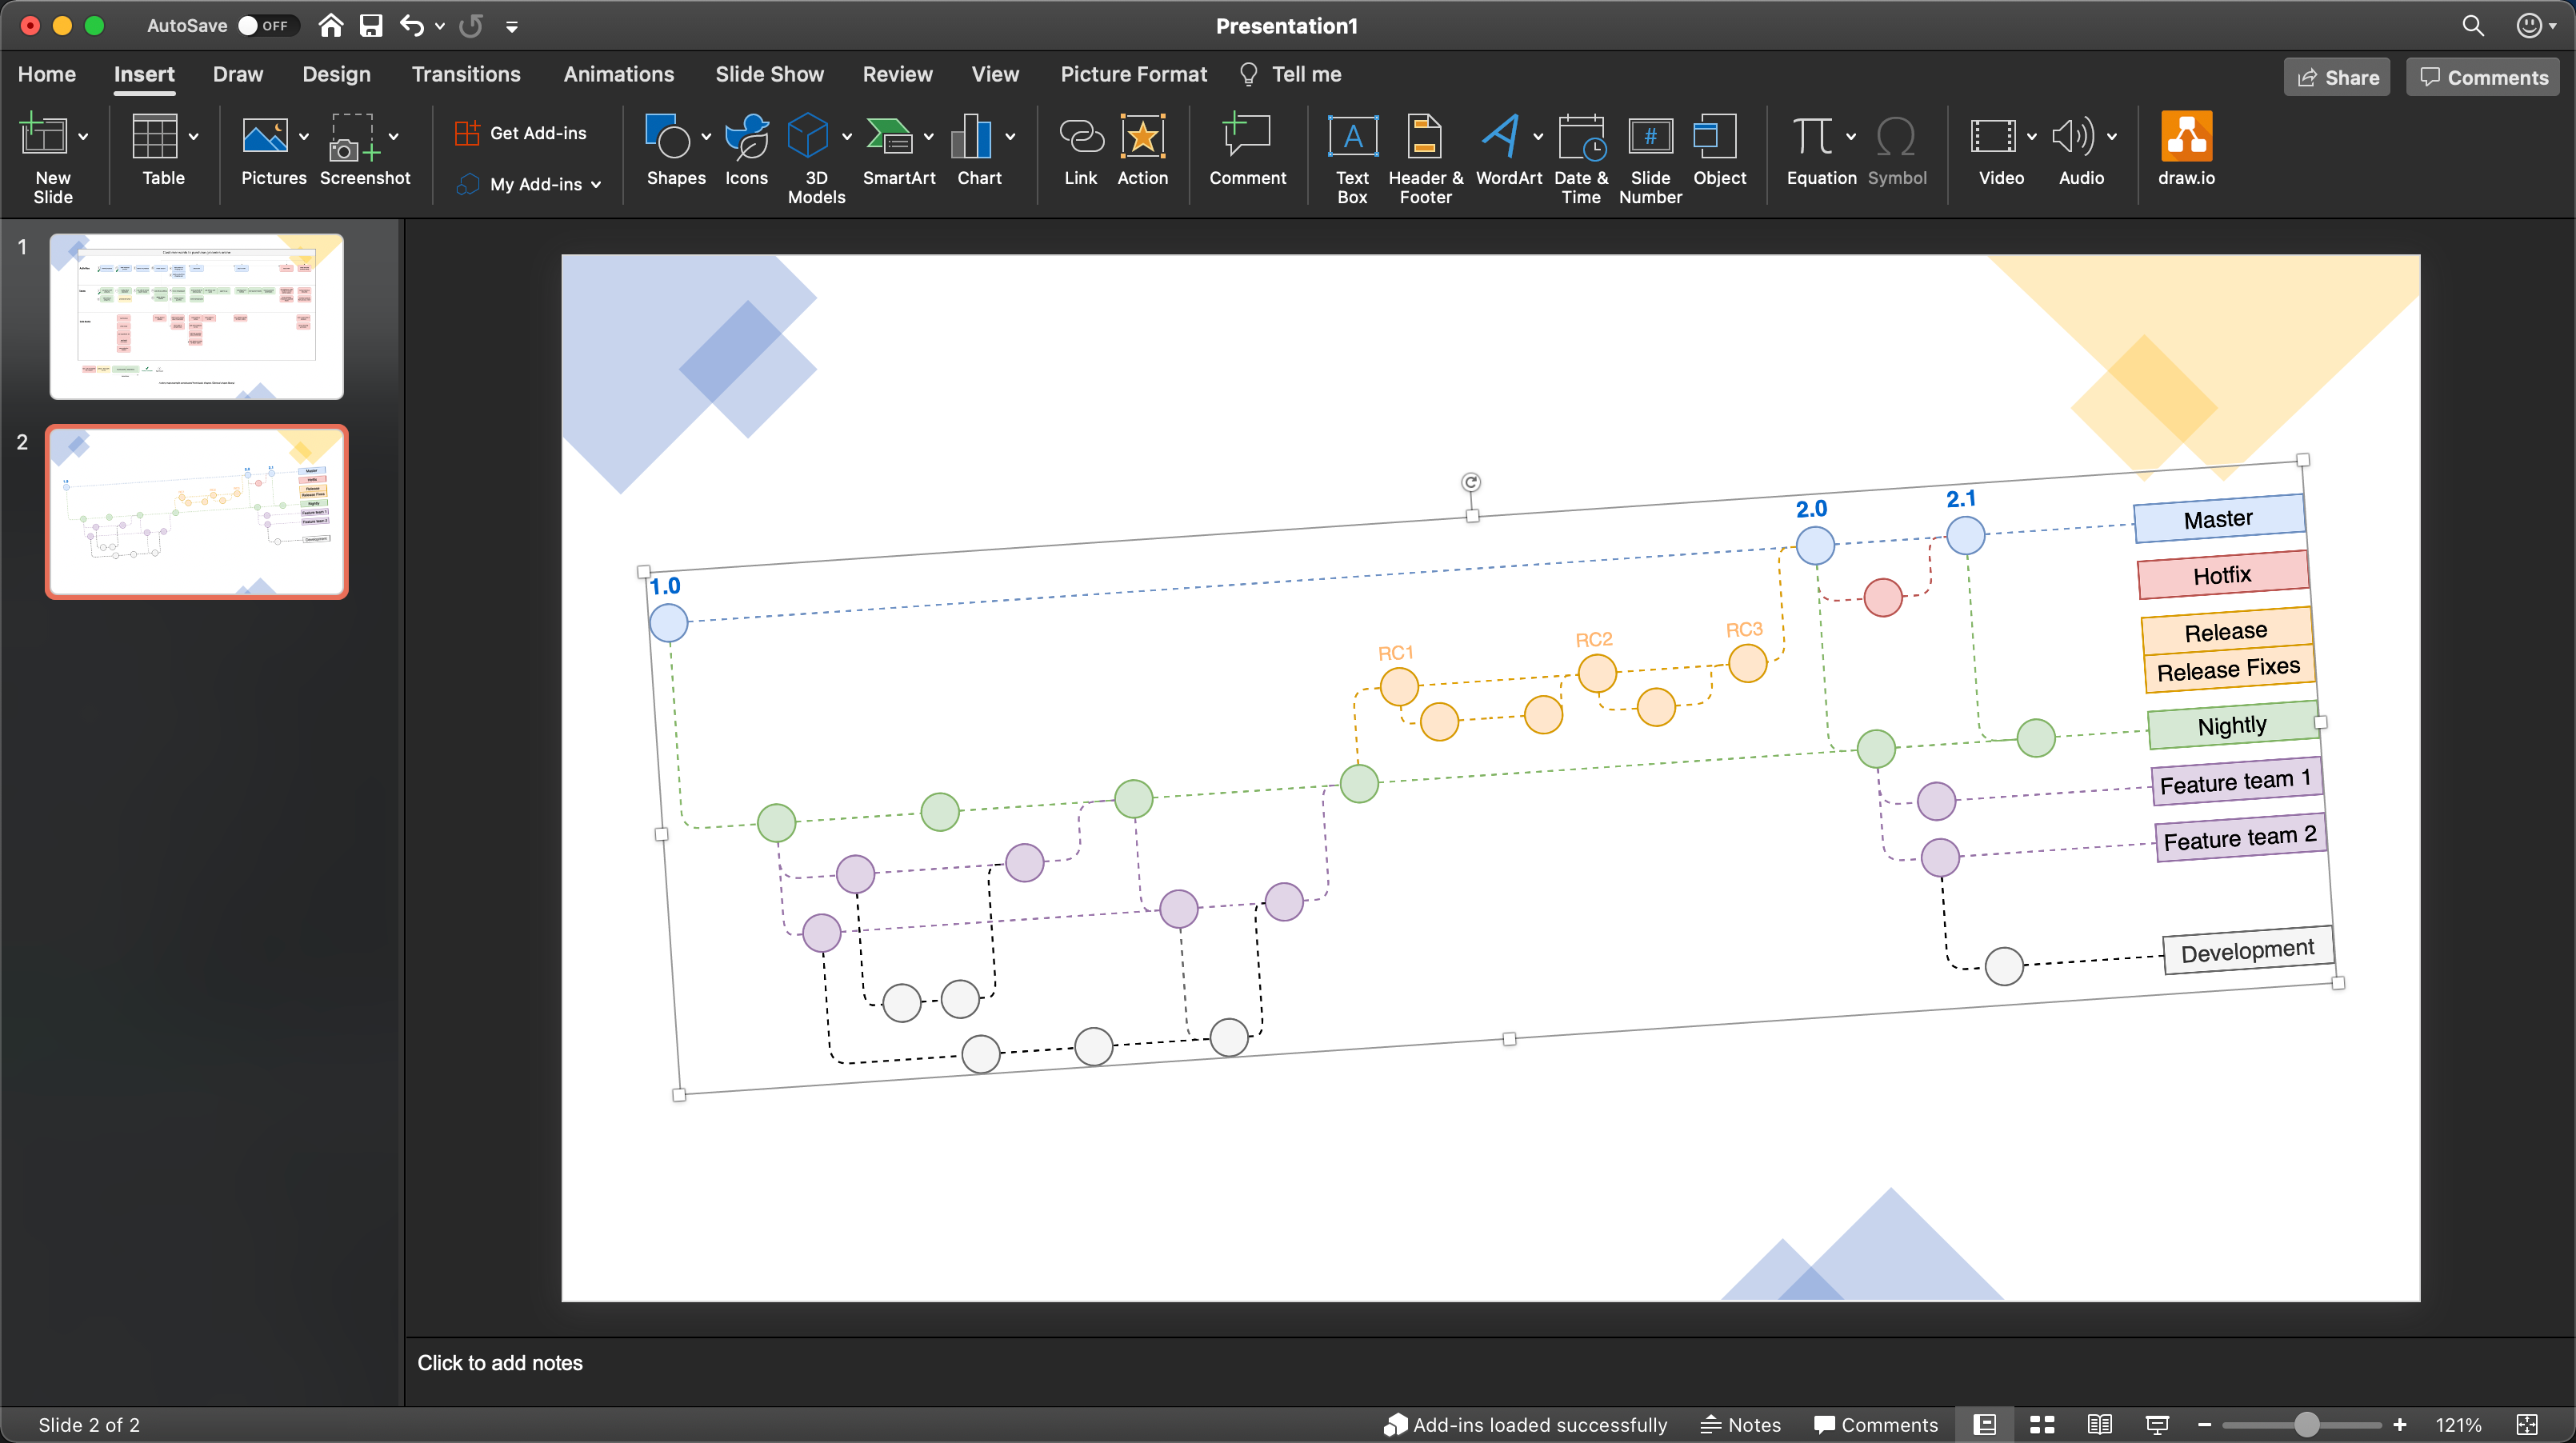
Create your diagram in draw.io online or one of our draw.io apps.
You can draw any type of diagram - flow charts, wireframes, floorplans, org charts, wiring diagrams, etc.
Avoid using complex shapes for elements you want to update. Those that contain multiple fields, like tables, entity shapes or swimlanes won't typically have unique IDs that you can refer to later.
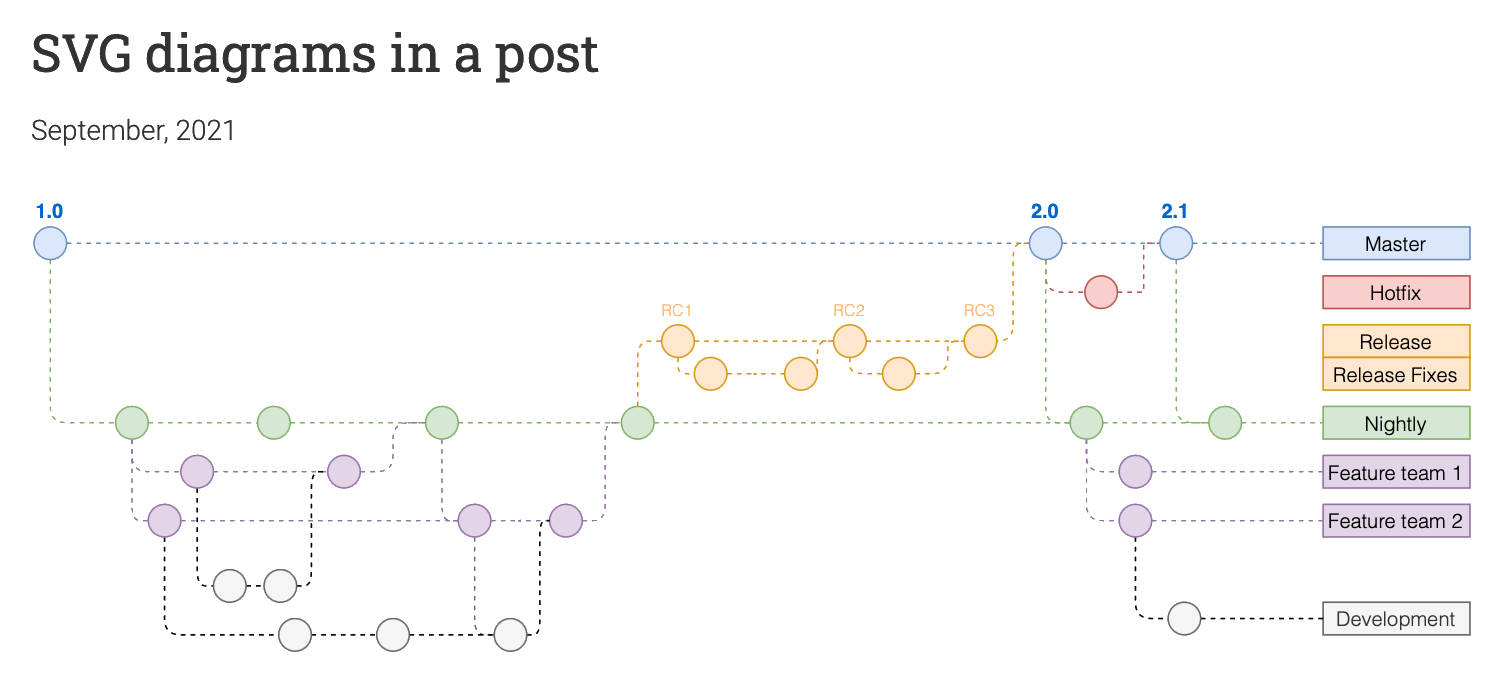
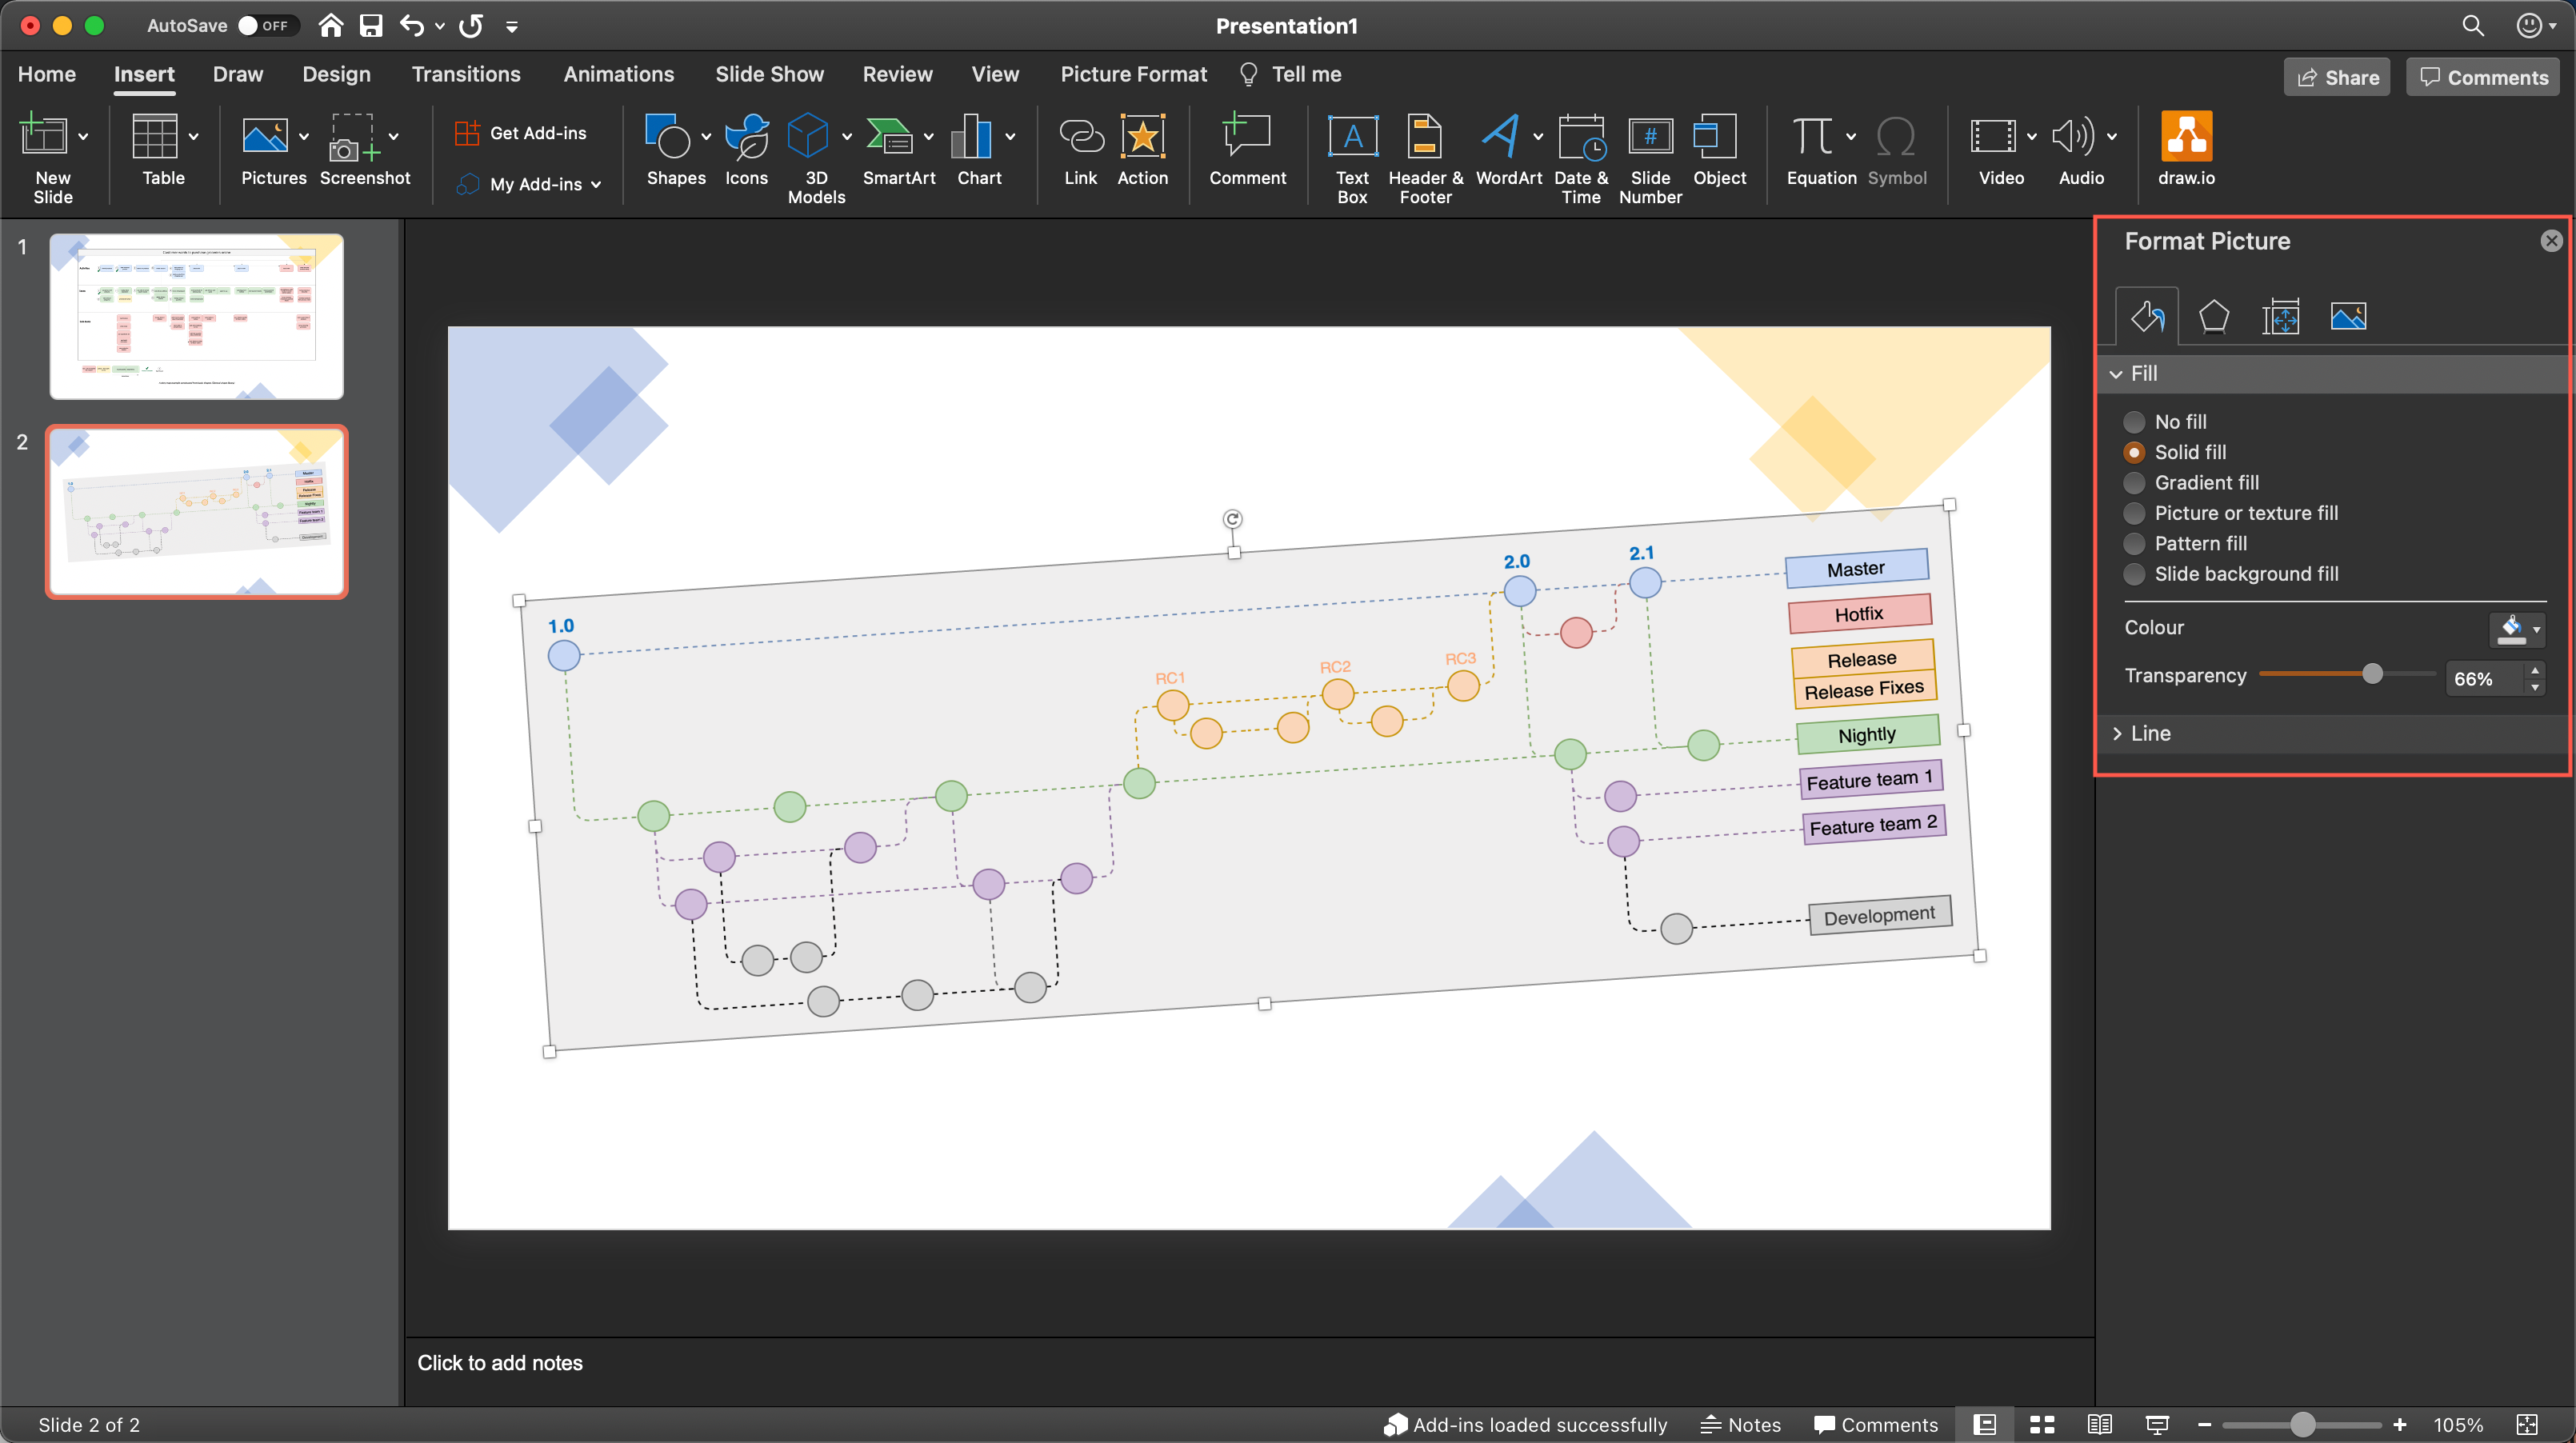
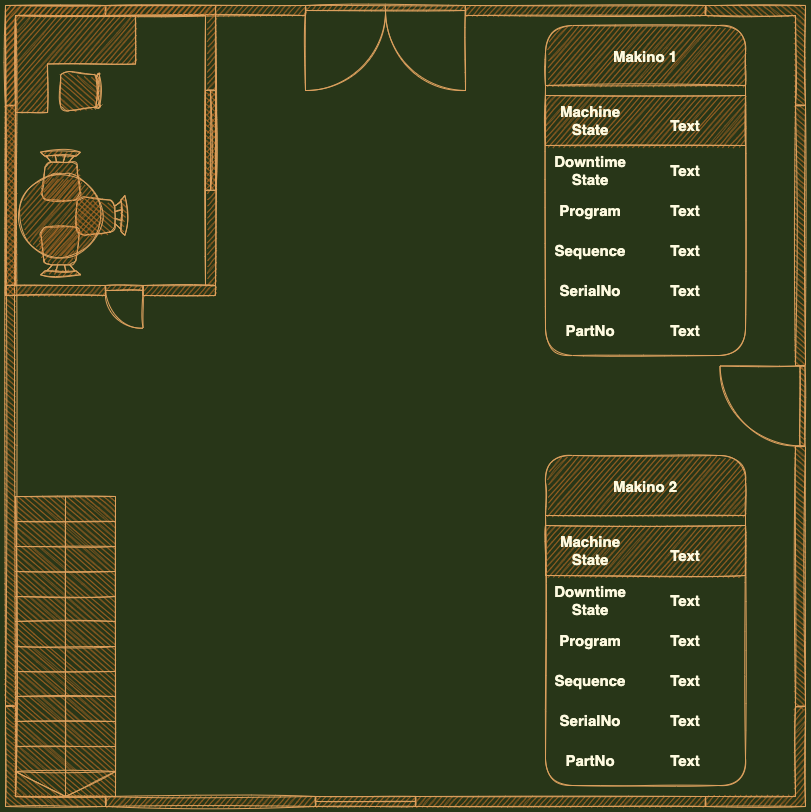
In this example, we've created a factory floorplan with simple text shapes to show important machine information.
Set custom unique shape IDs
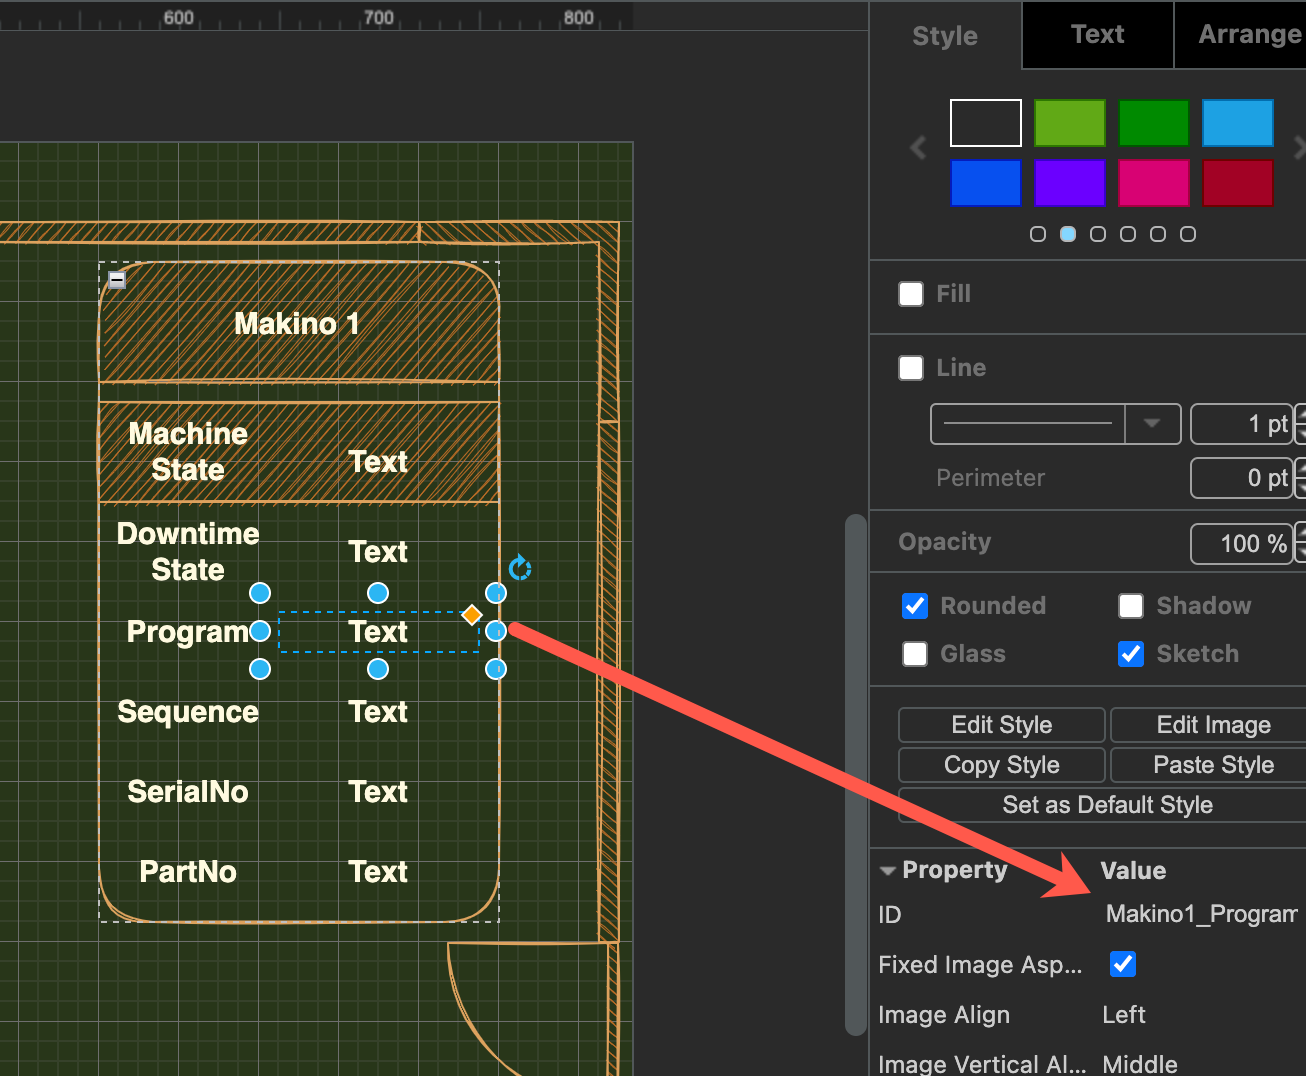
For each shape that will dynamically update based on a data source, you should override the auto-assigned shape ID to make it easier to refer to later.
- Right-click on a shape and select Edit Data. Alternatively, select a shape and press
Ctrl+MorCmd+M. - Hold down
Shiftand double click on the ID string at the top. - Change the shape ID to something more memorable - make sure it is unique.
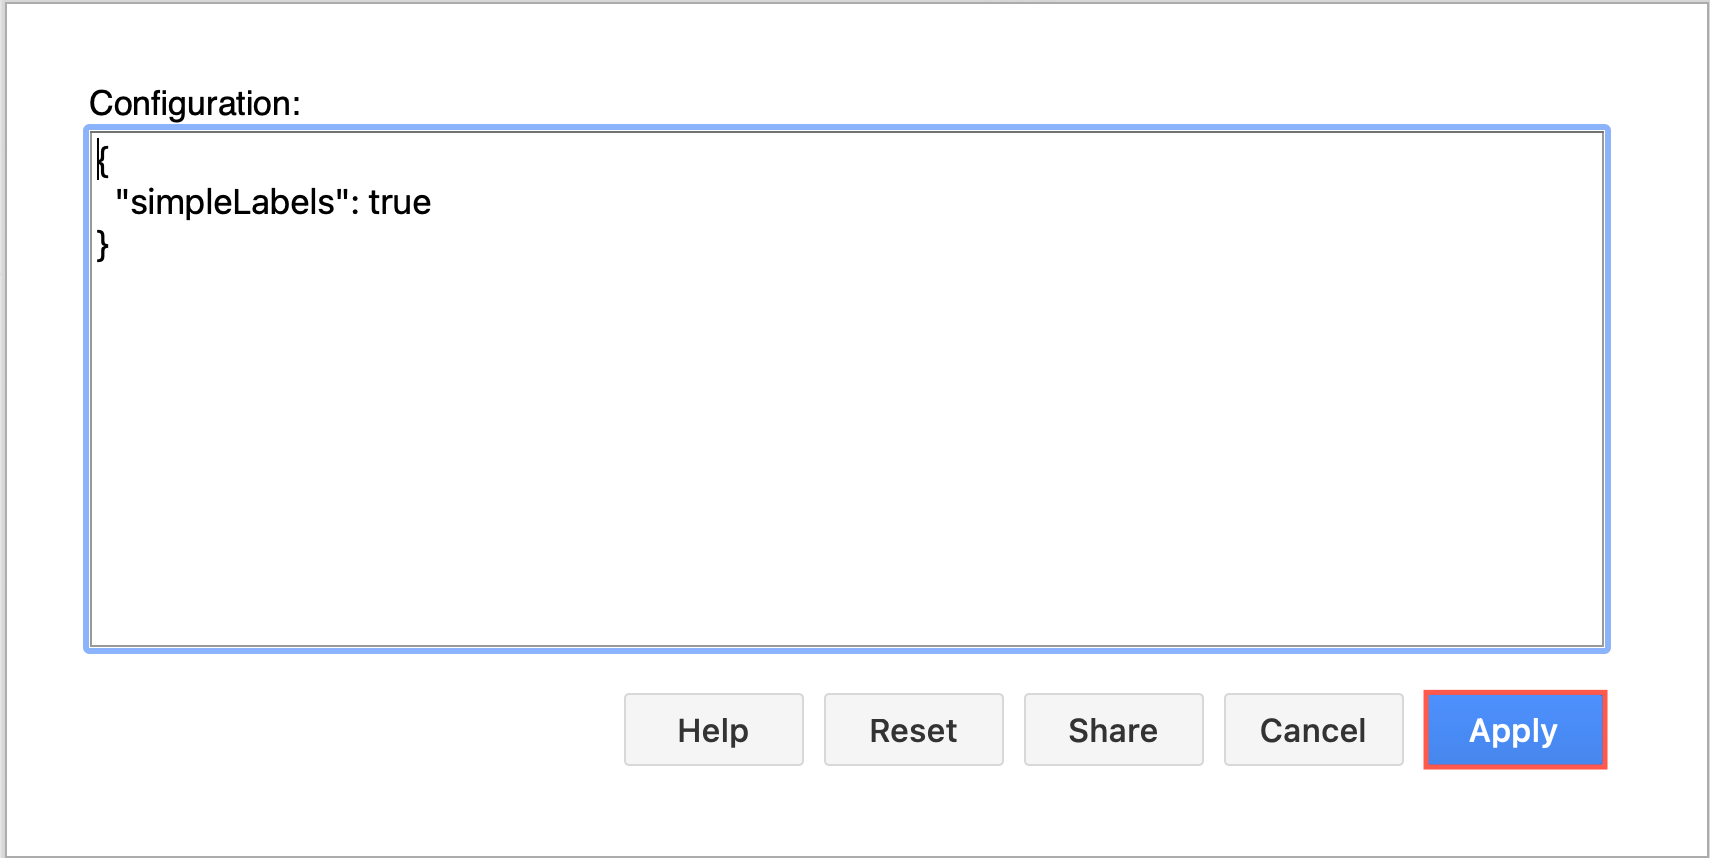
- Click Apply to save the new shape ID, then click Apply to save the shape data.
In our example, all of the text shapes that say Text are to be updated. Each has been assigned a new custom unique shape ID.
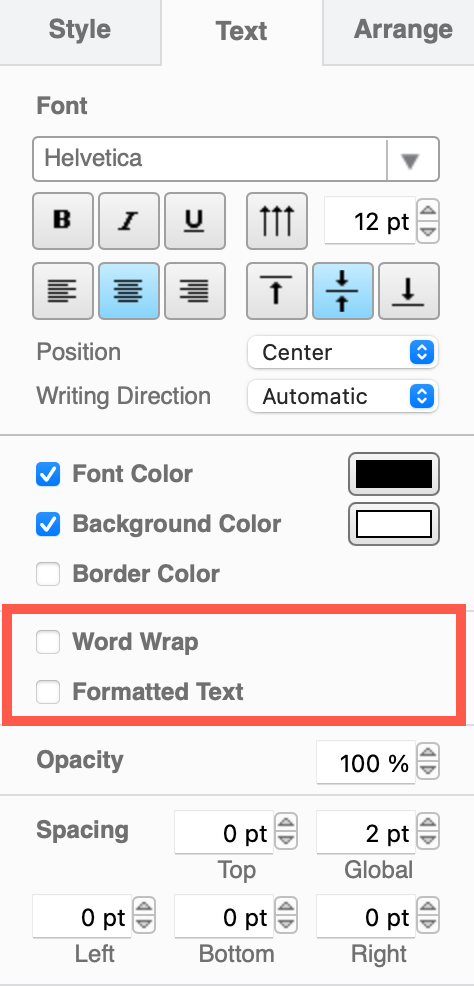
View the shape IDs in the Properties section on the Style tab.
Export your diagram as an XML file
You need to read (and copy) the full XML source of your diagram, so export it as an XML file so it can be easily opened by a text editor.
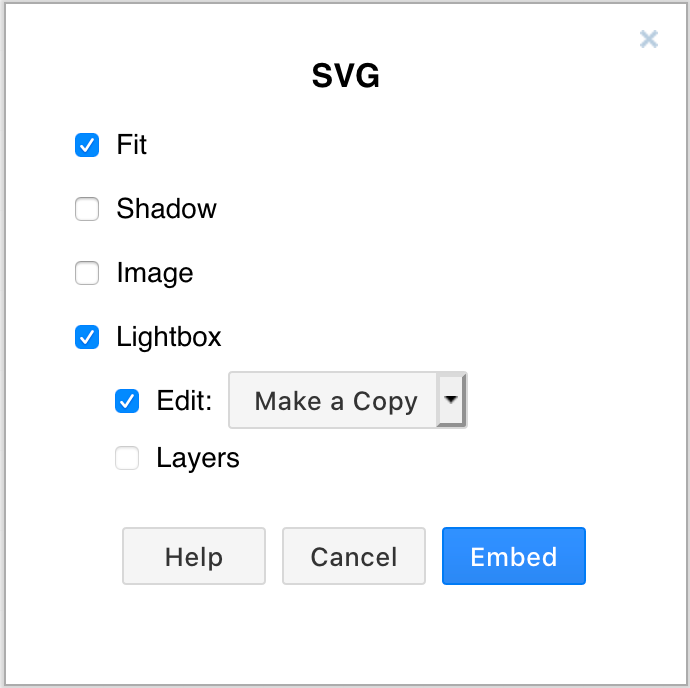
- Select File > Export As > XML from the menu.
- Save the file to your local device.
Create a dynamic dashboard
- Install Grafana and the Flowcharting plugin.
- Configure one or more data sources in Grafana.
- Create a new dashboard and add a Flowcharting panel.
Add the diagram to the dashboard
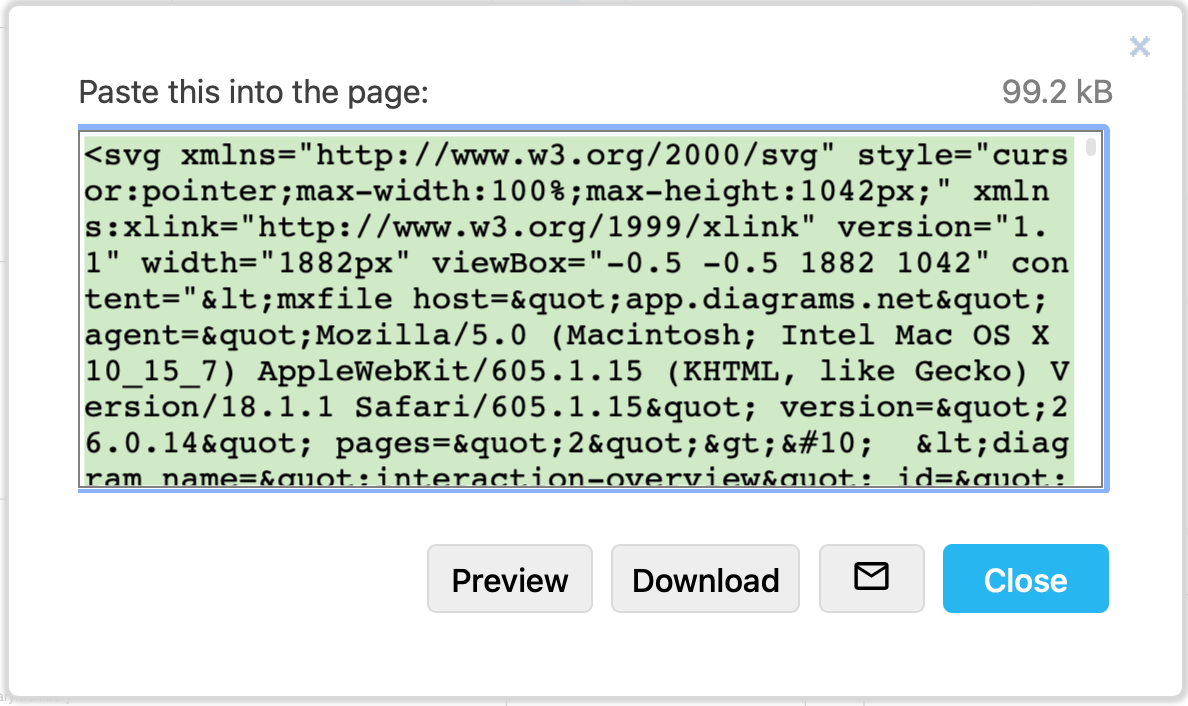
- Open the diagram
.xmlfile you previously saved in a text editor. - Copy all the diagram data that appears after the initial
<?xml ... >tag.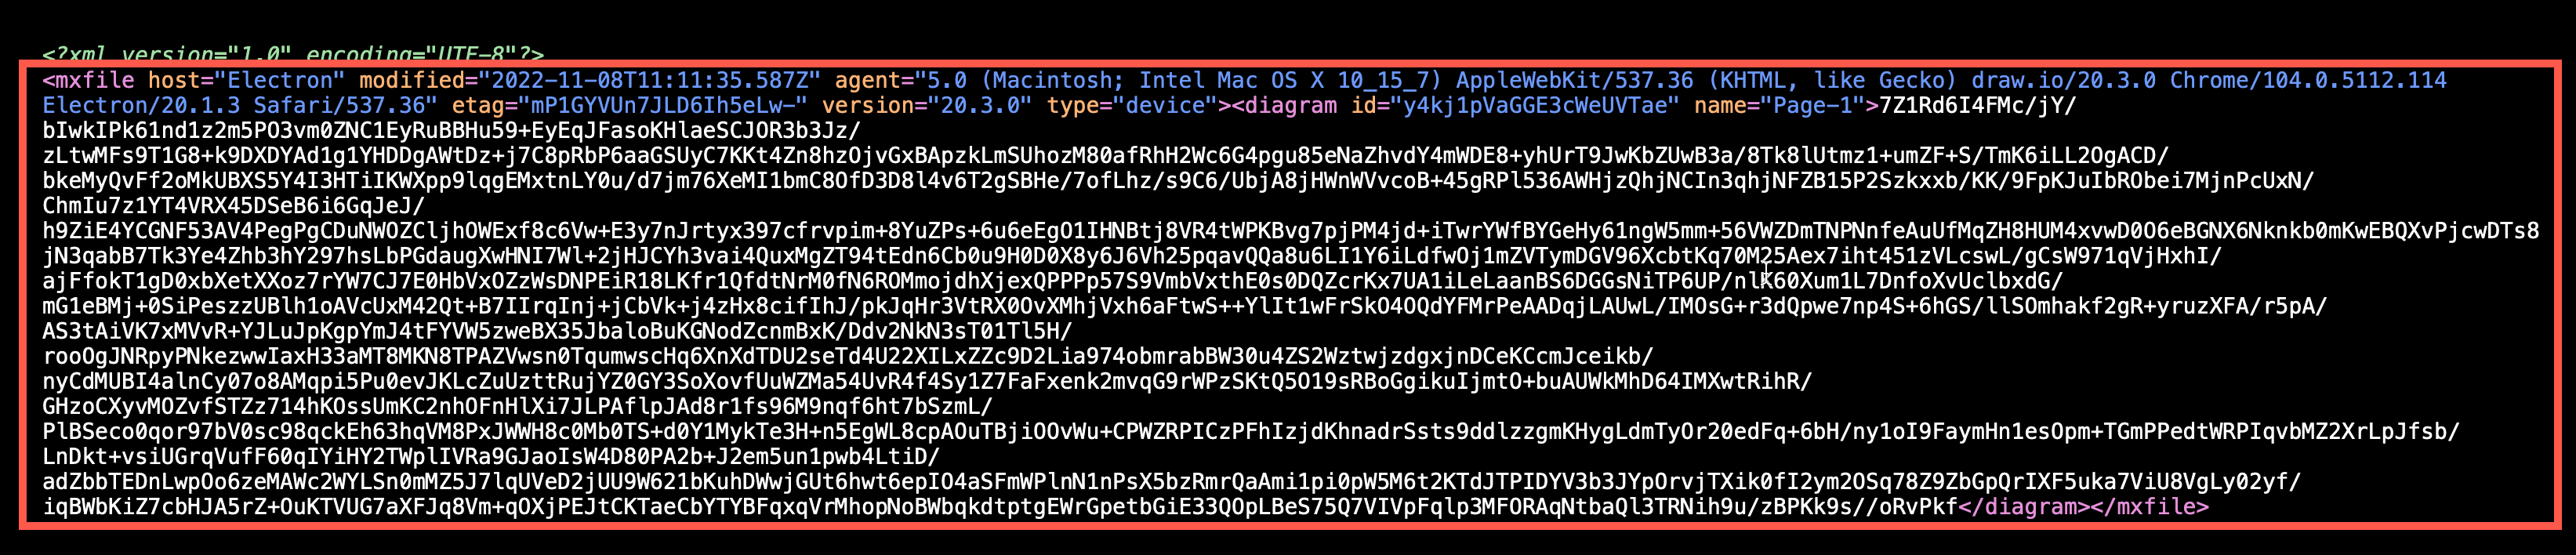
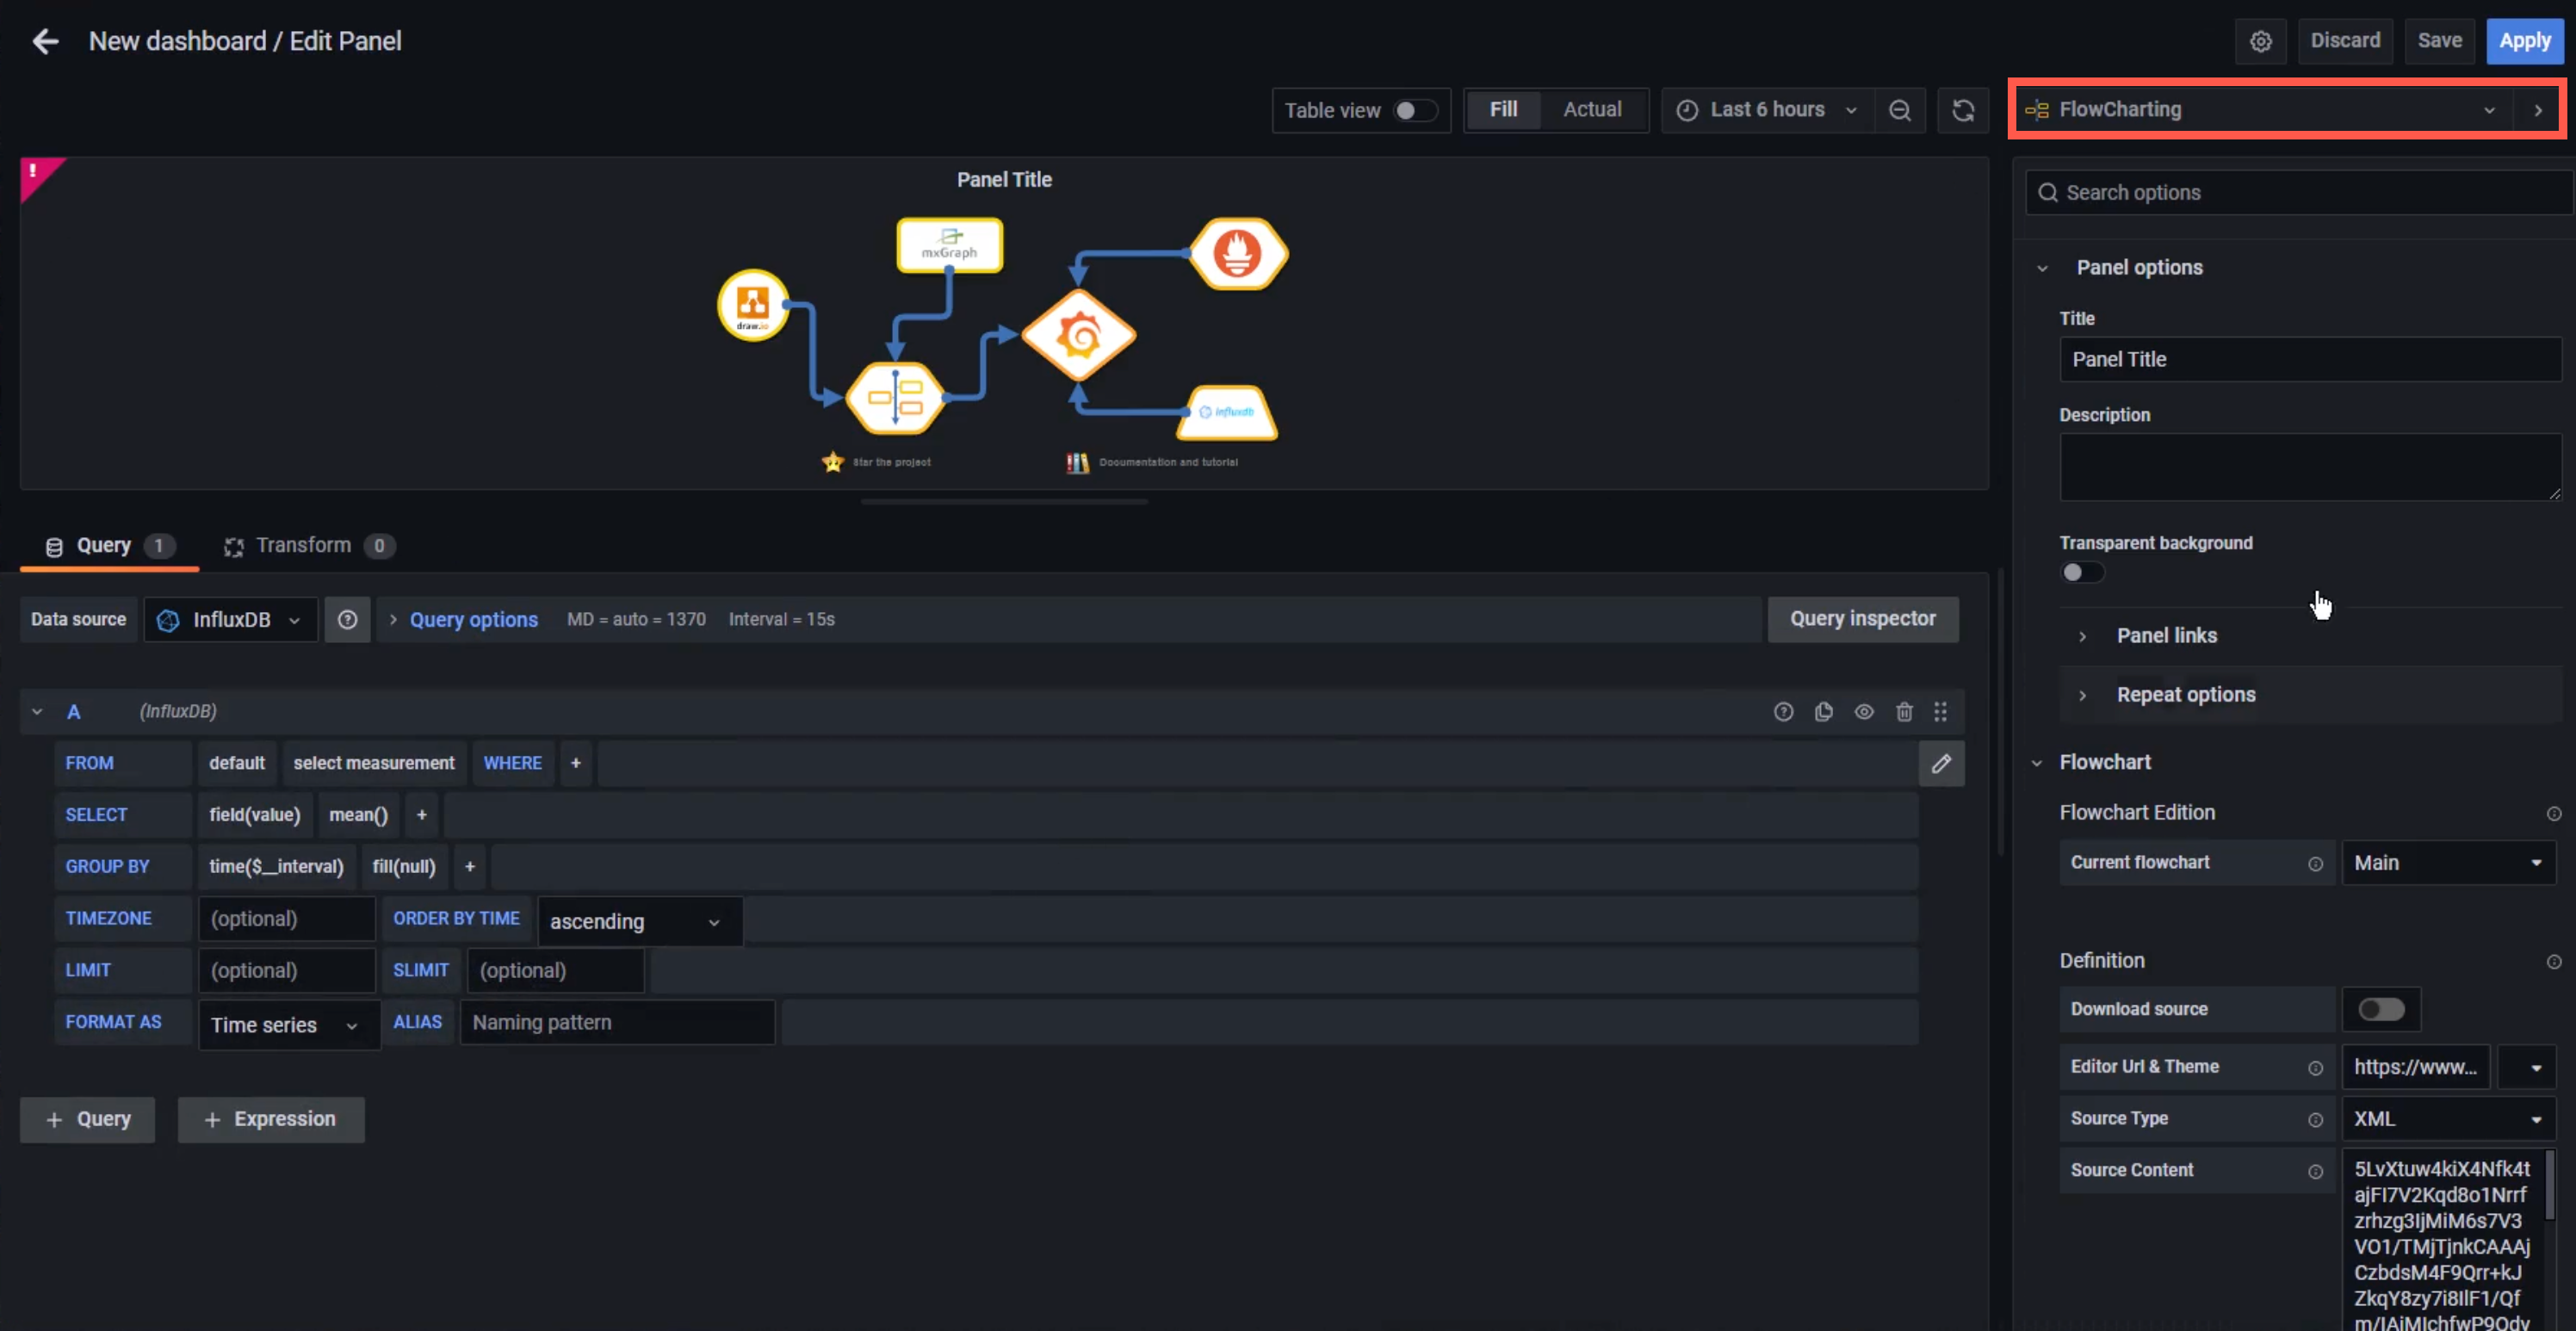
- Now, add the diagram data to the Flowchart panel in Grafana.
- Set the Editor URL & Theme to our online service at
embed.diagrams.net, and selectDarkorLightfrom the drop down list. If you run your own draw.io server, use its URL instead. - Set the Source Type to
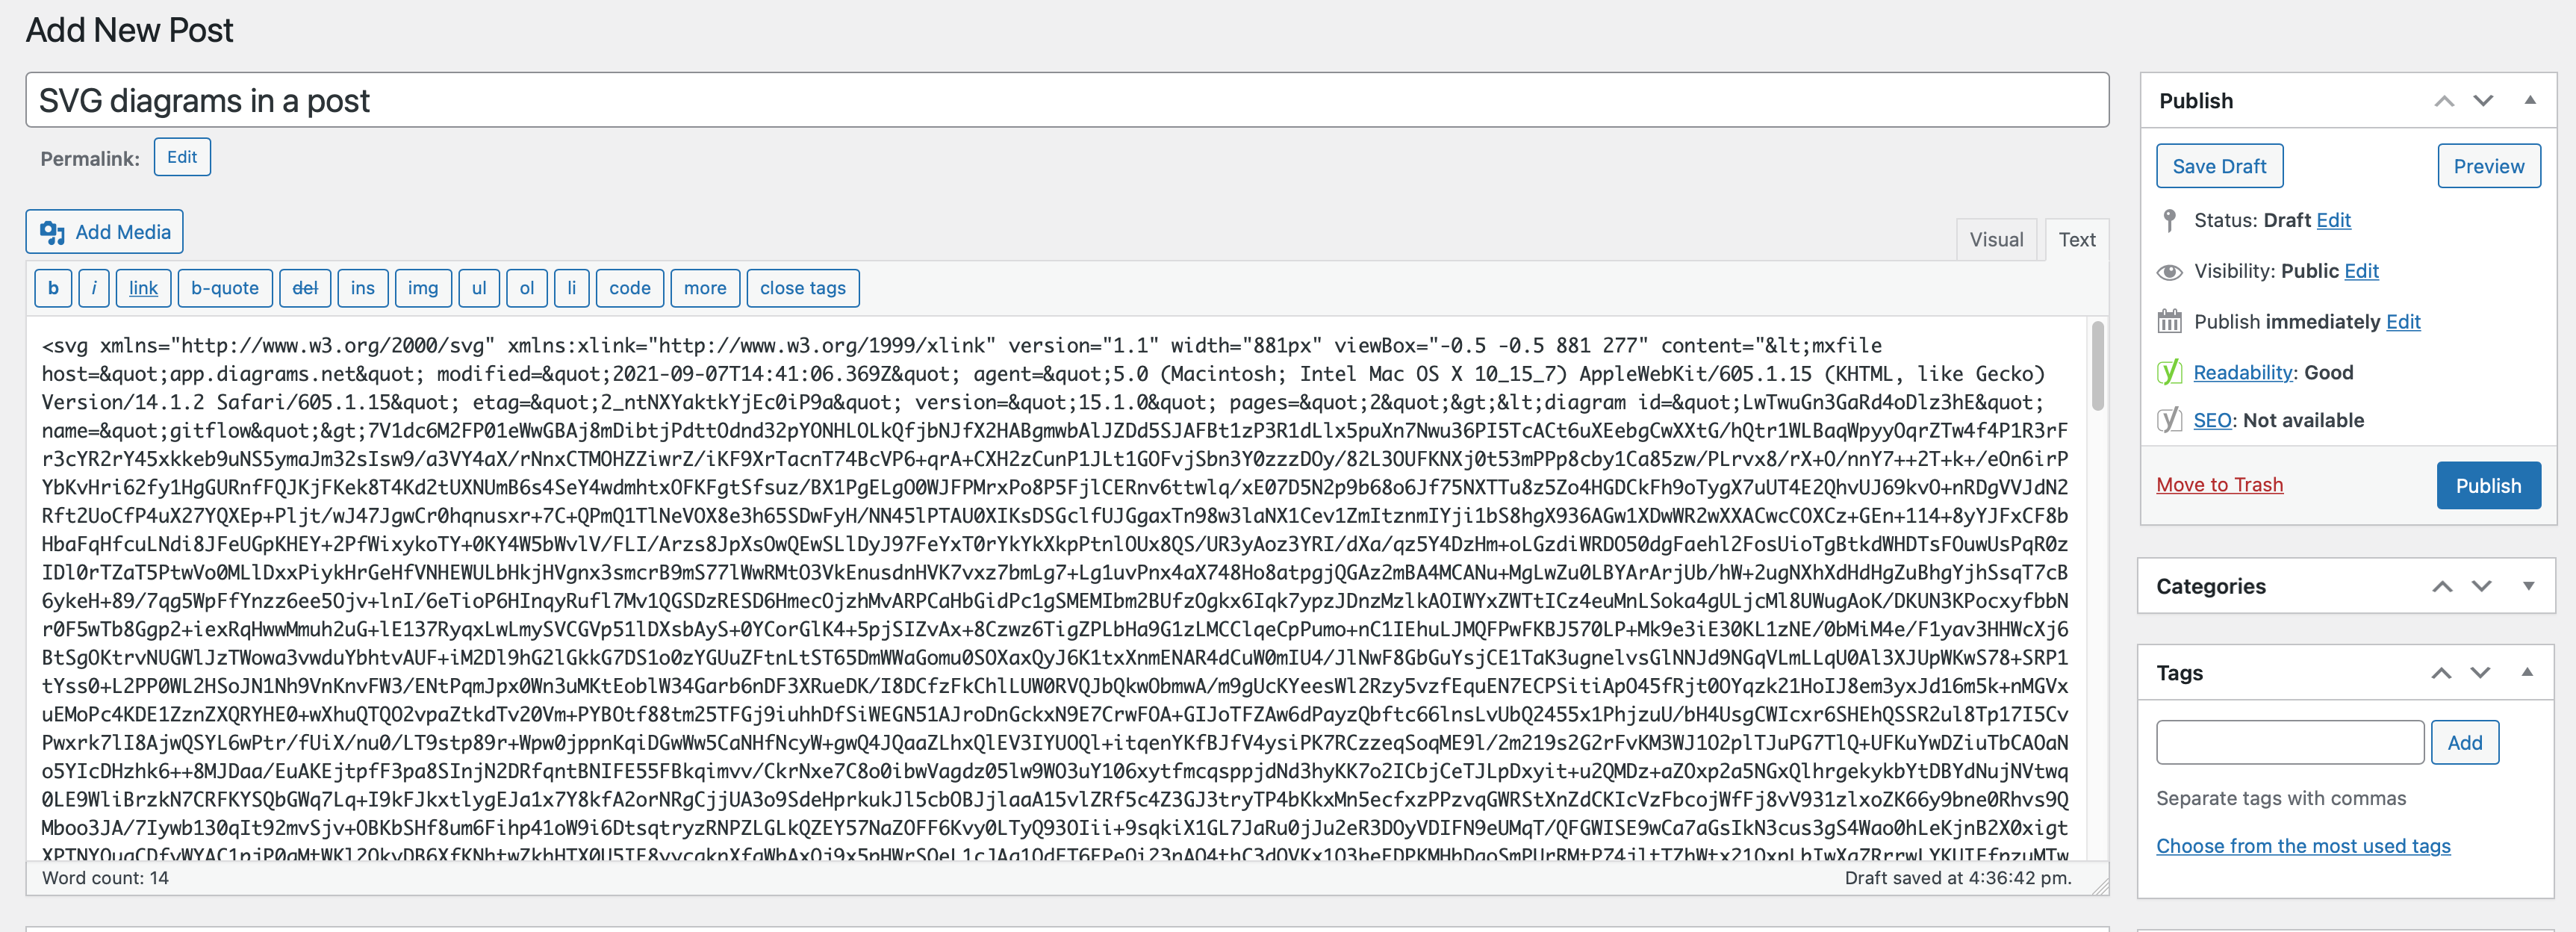
XML. - In the Source Content text field, paste the diagram data you copied from your text editor.
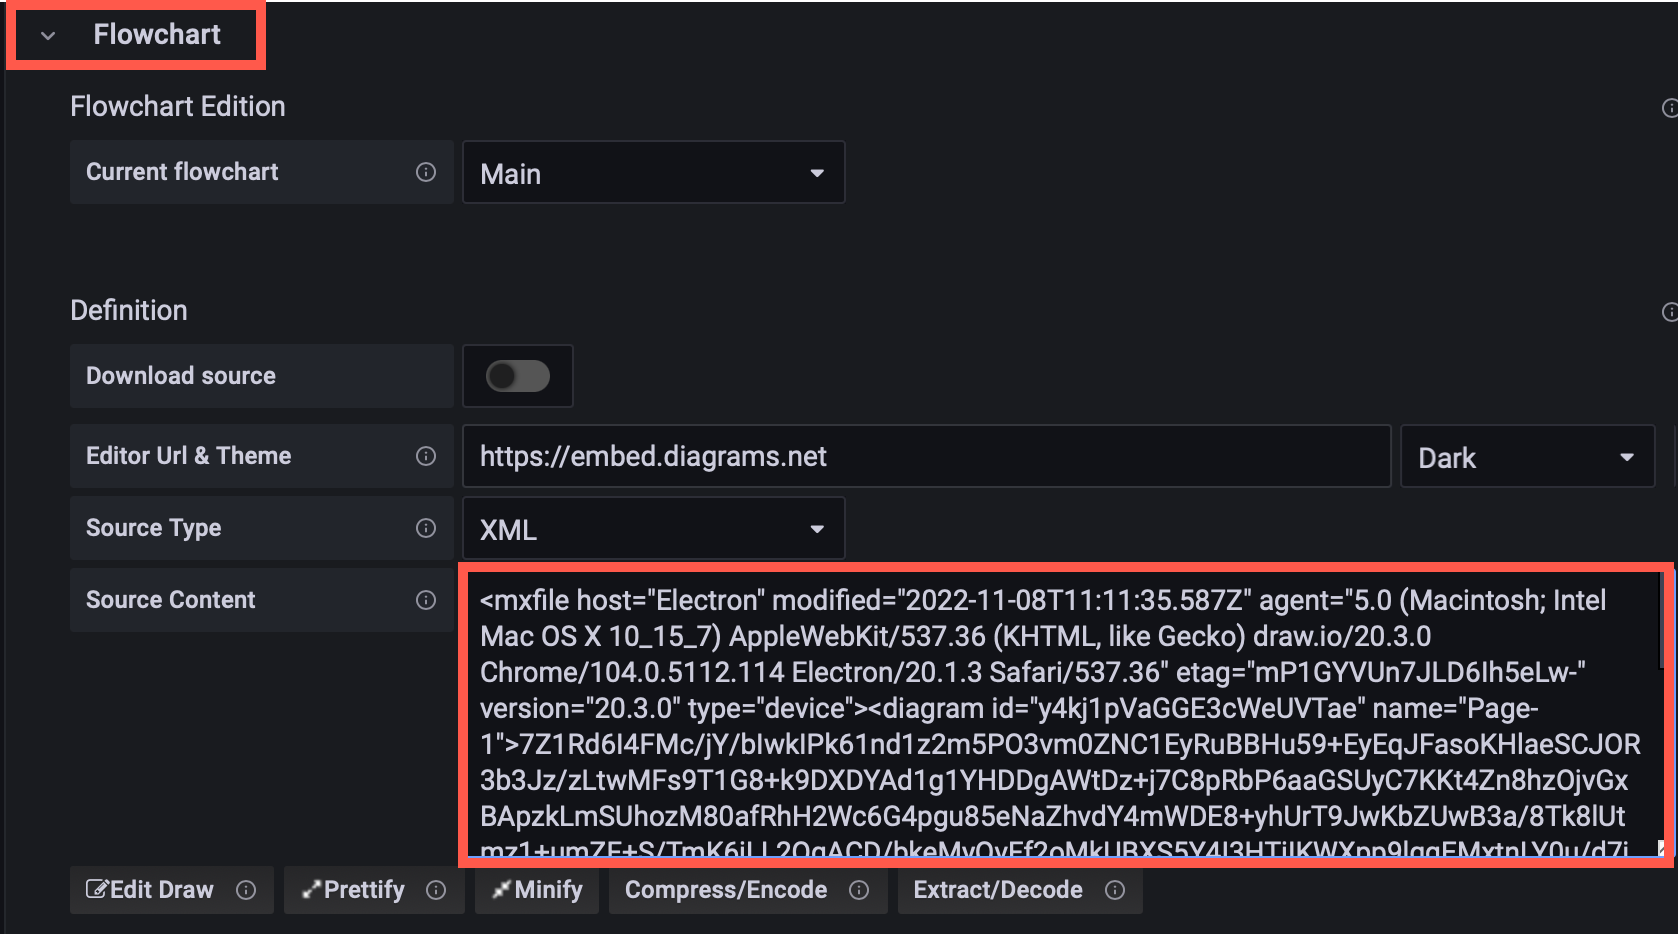
The diagram will appear in the dashboard preview panel.
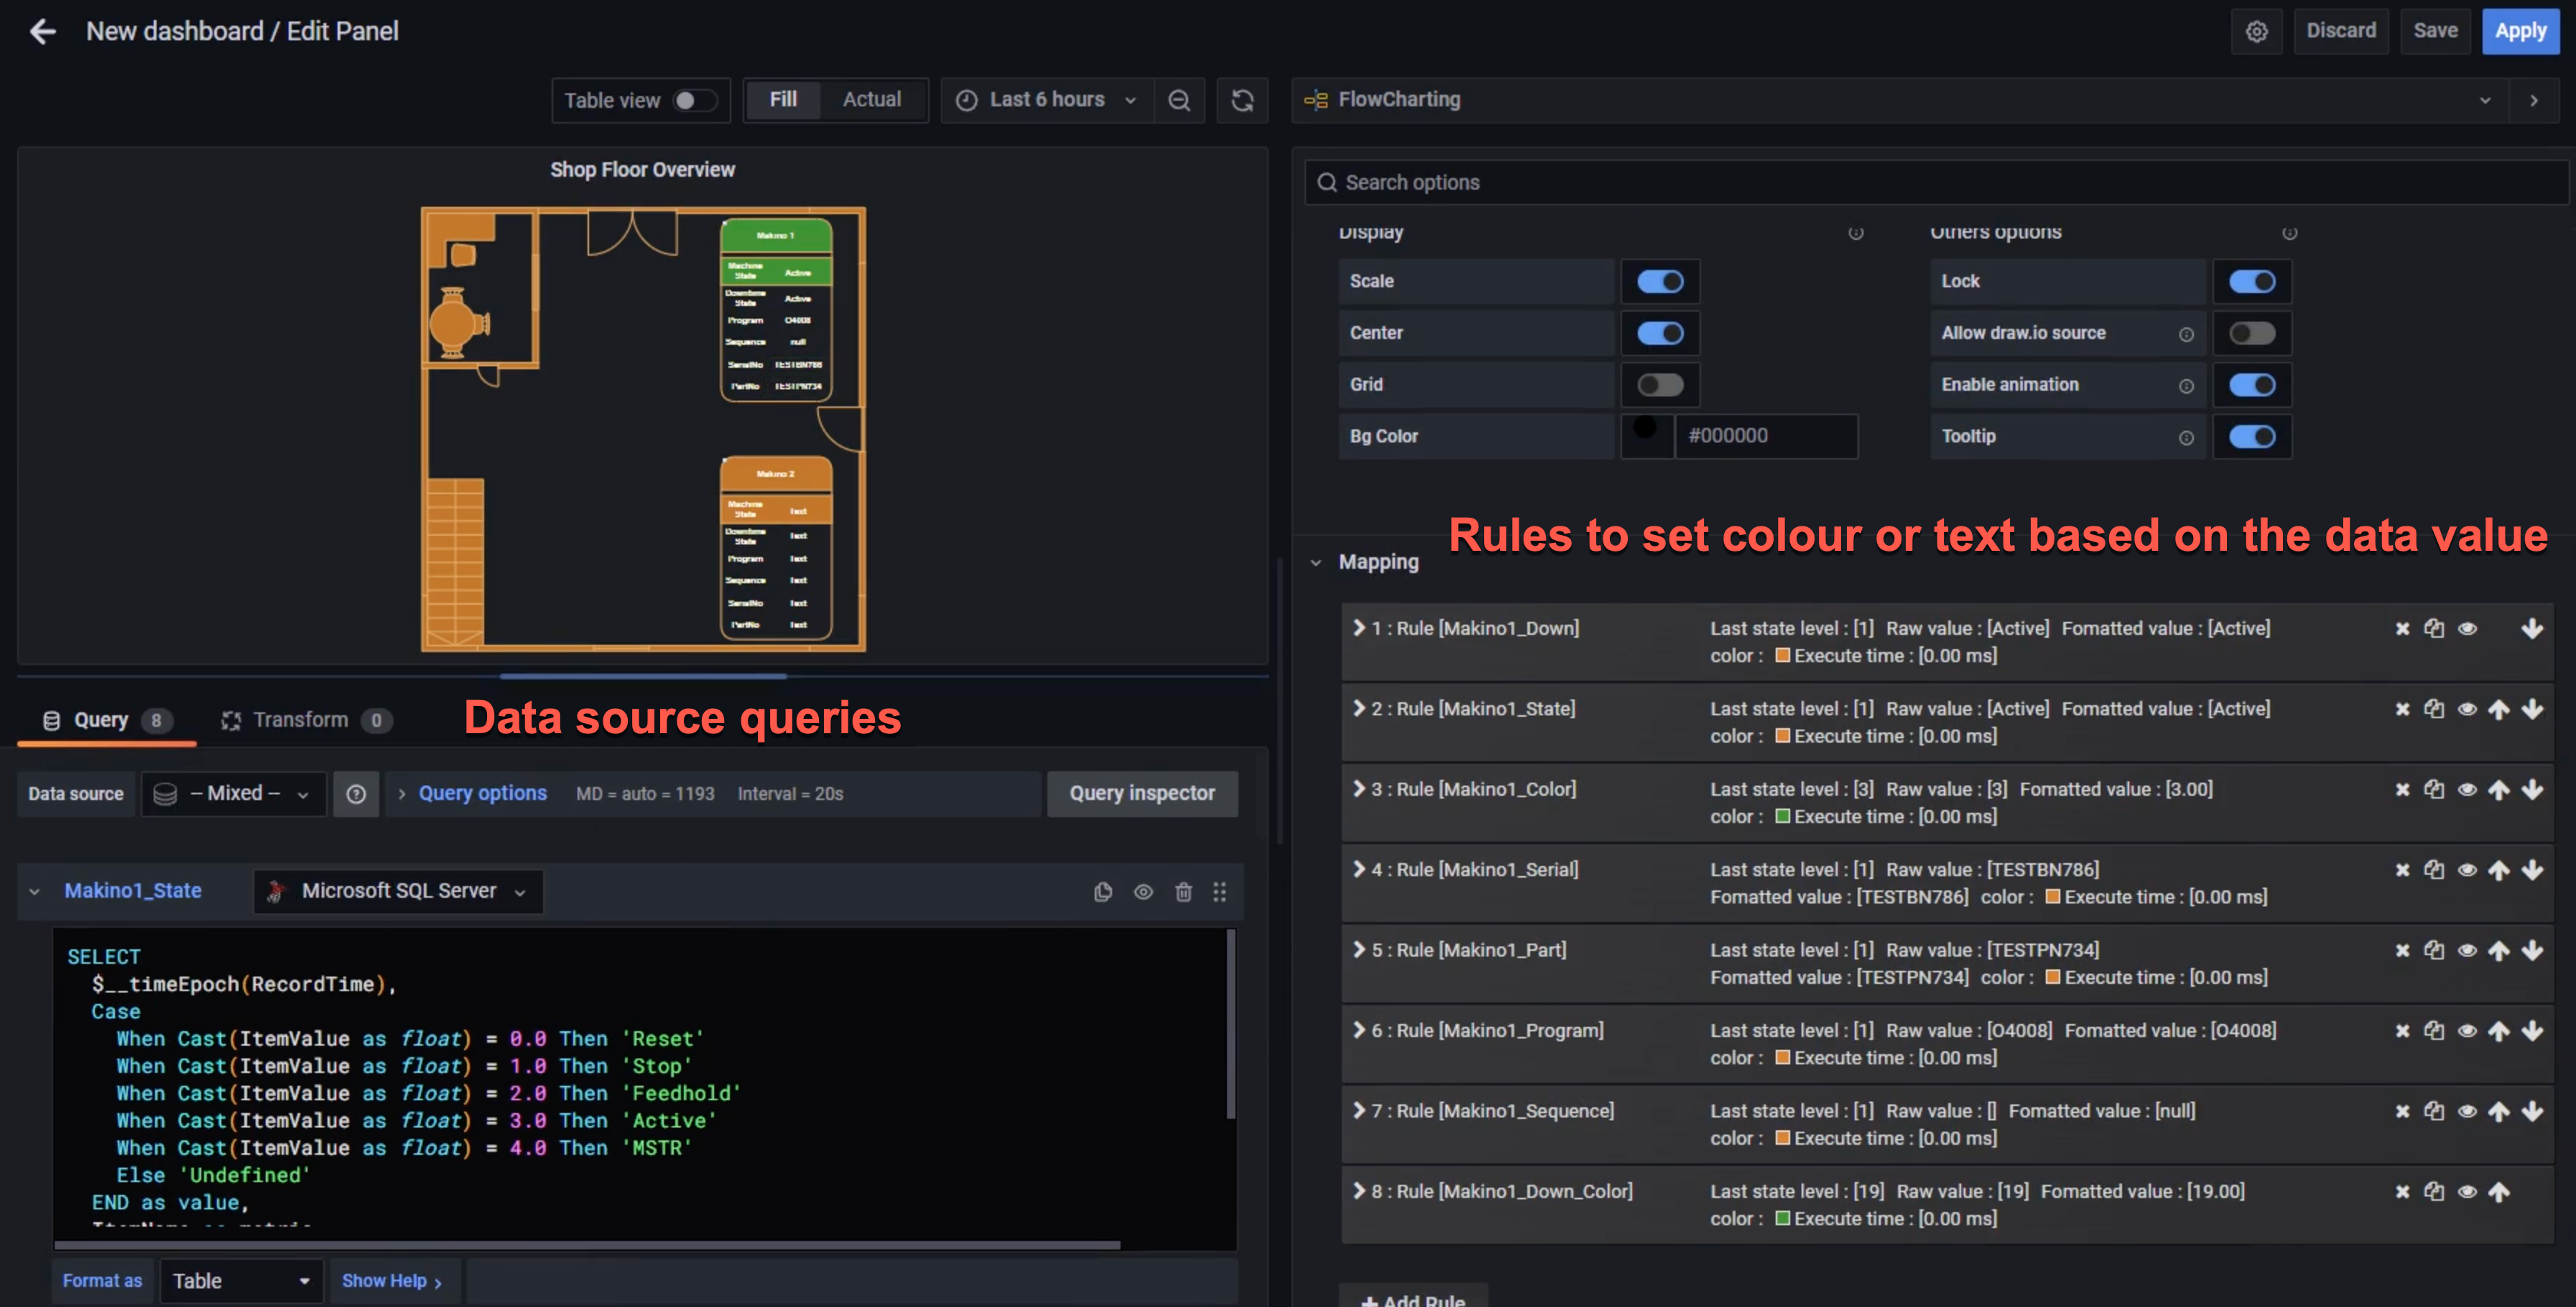
Map diagram shape IDs to data queries with rules
Now, you need to link the diagram shapes you want to update, with queries of a data source and rules defined in the Flowchart panel.
- Write the queries to extract the data you need from your data sources. Set the name of the metric to the diagram
shape IDthat it updates so it's easier to see which query updates which shape.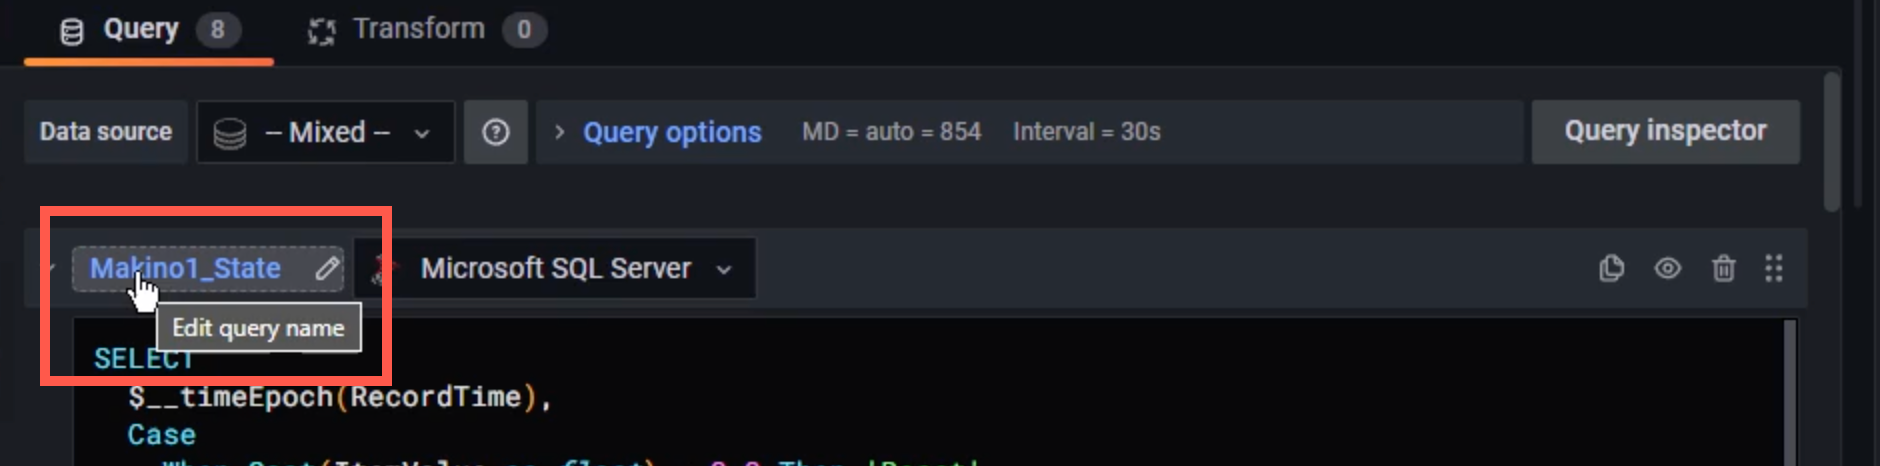
- Set the behaviour in the Mapping section for each query.
- Set Identify by to
IDas that is how we identify a specific shape. - Enable Regular expression and add some rules. In the What field of the rule, enter the specific
shape IDfor the shape you want to update.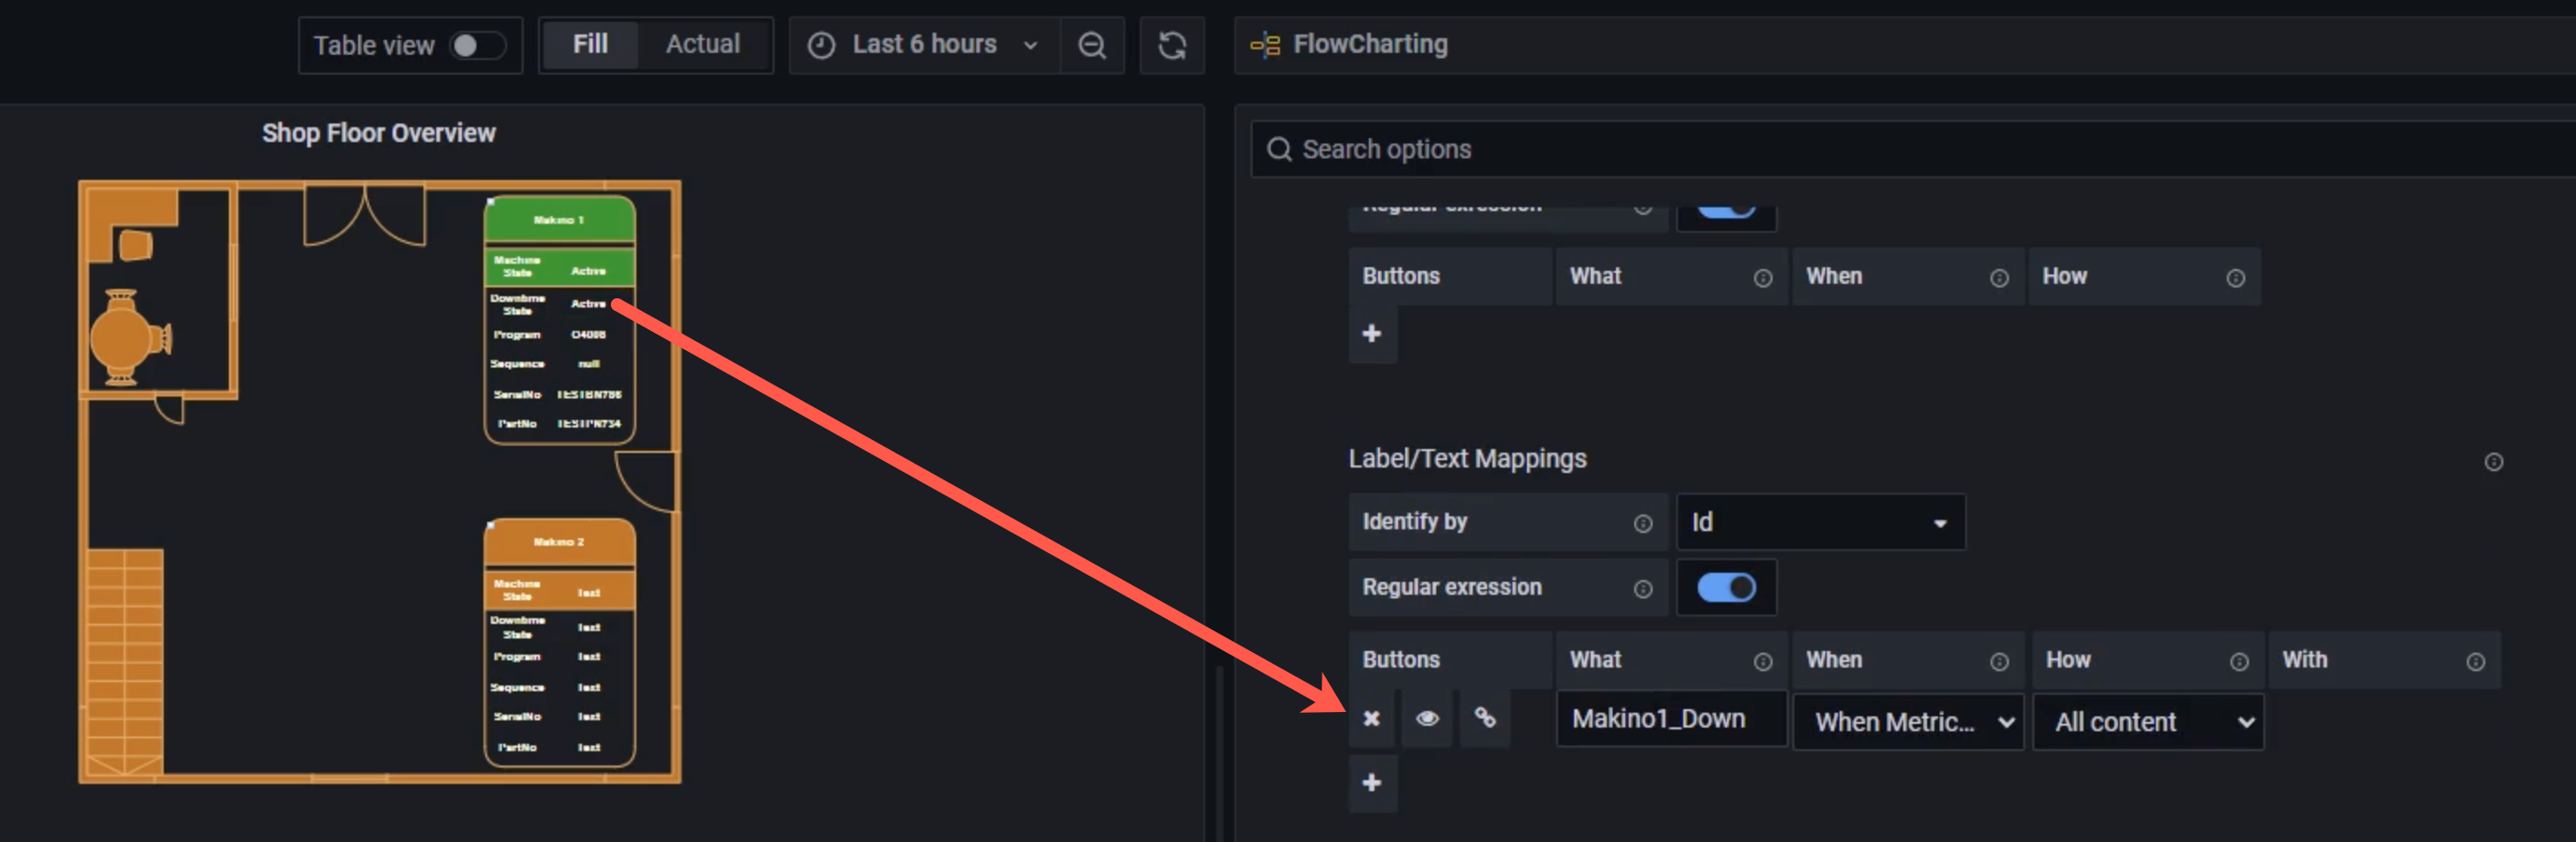
The shape label is Active or Stop based on the latest database value.
- Set Identify by to
Refer to the Flowcharting mapping documentation if you need help with this step.
You can change the colour or tooltip of the shape, its text label or link, or add an animation.
Now, when your dashboard runs and your data queries are updated, your diagram will update according to the rules you have set.
More data-driven diagram examples
- Select one of these live examples of diagrams in the Flowcharting plugin.
- Expand the title and select Edit to see how it is set up.