
17 posts tagged with "use-cases"

View All Tags

Shape library updates for multi-colour shapes

· 4 min read
draw.io
draw.io Team

There are many shapes in the draw.io shape libraries that use more than one line or fill colour. These shapes are being updated so you can change each of the colours and style your diagram with more flexibility.
The updated AWS shapes allow you to customise all of the colours in the shapes

As the collection of shape libraries is rather large in draw.io, it will take some time to update all of those that contain multi-coloured shapes. The first two libraries that have been updated are Mockups and the AWS 3D shapes.

Each shape still contains a Fill and a Line (outline) colour that typically forms the background colour and the outer line colour of the shape. The additional colours are defined with new, customisable style settings.

For example, the Mockup Map shape has a white background and black outline, but also internal areas with different fill colours and a different internal outline colour.
The updated Mockups Map shape has many customisable internal fill and outline colours

The list of fill and outline colours will be different for each shape.
The updated Mockups and AWS 3D shape libraries allow you to customise multi-colour shapes

How it works

A default attribute was introduced for the fillcolor and strokecolor attributes.

Each shape has a list of defaultFillColors and defaultStrokeColors attributes which are used to show the customisable colours in multi-colour shapes. These are comma-separated lists that define the default colours in the fillColorStyles and strokeColorStyles attributes within a shape.

Right click on a shape, then edit the colour style attributes, then click Apply.
Right click on a shape and select Edit Style to change the colours of the shape directly

Which libraries have been updated?

The updated AWS 3D and Mockups shape libraries are available now in the current version of the web-based draw.io editor. The Cloud and IT shape libraries are in the process of being updated to this new, more flexible system of colours. Multi-colour shapes in other shape libraries will be updated after the IT shapes are finished.

Go to app.diagrams.net/clear.html to ensure you are using the most recent version of the online draw.io editor.

Gradients with multi-coloured shapes

The gradient option in the Style tab of the format panel will use the main background fill colour. The gradient does not apply to any of the other additional colour styles within the multi-colour shape.
The updated Mockups Map shape has many customisable internal fill and outline colours

Reset to the original colour styles

To revert to the original colour, the easiest is to copy the original style from an unstyled shape and apply it to the customised shape.

  1. Select the unstyled shape. In the Style tab, click Copy Style.
  2. Select the customised shape. In the Style tab, click Paste Style.
    The updated Mockups and AWS 3D shape libraries allow you to customise multi-colour shapes

Learn more about styling shapes

More updated networking and cloud shape libraries

· 5 min read
draw.io
draw.io Team

In addition to updating the main AWS and Azure shape libraries in draw.io, several new networking and cloud shape libraries have been added, including shapes for Alibaba Cloud, Dynamics365 and OpenStack.
Several new cloud infrastructure libraries have been added, and the Azure and AWS shape libraries have been updated in draw.io

Open cloud infrastructure shape libraries

  1. Click on More Shapes at the bottom of the shapes panel on the left.
    Click on More Shapes in the shapes panel to open the shape library collection in draw.io
  2. Scroll down to the Networking section and enable the shape libraries you want to use.
    Enable the cloud infrastructure libraries you want to use in draw.io
  3. Click Apply to open them in the shapes panel next to the drawing canvas.

Tip: Alternatively, you can always search for a shape if you know its name. For example, searching for "AWS beanstalk" will show all the shapes from the various AWS libraries that have both "AWS" and "beanstalk" in their shape names, even if you don't have the AWS shape libraries open. Hover over any of the shapes to see a larger preview.
Search for any cloud infrastructure shape by its name to see all related shapes, even if you don't have the shape libraries open in draw.io

Azure Power Platform and Dynamics 365

The Power Platform shapes have been added to the Azure shape library. These components are often combined with Dynamics365 services and applications in cloud infrastructures.

Tip:* If you prefer to diagram in dark mode, the Azure and Dynamics365 shapes and their labels will automatically change colours to remain readable when you switch between dark and light modes.
Several new cloud infrastructure libraries have been added, and the Azure and AWS shape libraries have been updated in draw.io

OpenStack shapes= library

OpenStack services and apps are common components of Citrix, GCP, IBM and other large hybrid cloud infrastructures. To clearly indicate which components are provided by OpenStack in your infrastructure diagrams, enable the OpenStack shape library.
Use the OpenStack shapes in your hybrid multi-cloud infrastructure diagrams

Alibaba Cloud shape library

Enable the Alibaba Cloud shape library to document your infrastructure in Alibaba Cloud platform. These shapes cover a wide range of apps and services.
Use the Alibaba shapes to document your Alibaba Cloud infrastructure

Most of the infrastructure shapes don't have labels by default, as designers tend to rely on logo-recognition for their infrastructure components.
Add and style shape labels so your Alibaba Cloud infrastructure diagram is readable and consistent

To make your diagram more accessible, select a shape and start typing to add a label. In the Text tab of the format panel, select the Bottom position, and update the Font Colour to match the colour of the Alibaba shape so it is consistent.

Tip: Format one shape and click on Copy Style in the Style tab of the format panel. Then, right-click on the canvas and choose Select Vertices, deselect any regions you may have added, and then click on Paste Style in the Style tab to copy the style onto all of the selected shapes.
Copy and paste shape styles to make your diagram labels and colours consistent

Learn more about drawing various types of network and infrastructure diagrams.

Other cloud platform shape libraries in draw.io include Salesforce, Citrix, Google GCP, Amazon AWS, IBM, and more.

Export AWS diagrams generated from your actual deployed infrastructure to the .drawio format from Cloudockit and Cloudcraft.

New IBM Cloud shape library for technical diagrams

· 6 min read
draw.io
draw.io Team

The new IBM Cloud shape library in draw.io (right) reflects IBM's updated design language, and extends the existing IBM shape library (left) with a wide range of additional groups, connectors and infrastructure components.
Enable the new IBM and IBM shape libraries to draw IBM infrastructure diagrams

IBM has provided their updated shapes for the new IBM Cloud shape library in draw.io. Please refer to their documentation for their design language style guide, where they explain how shapes and icons should be used in a wide variety of technical diagrams.

Enable the IBM shape libraries in draw.io

  1. Click on More Shapes at the bottom of the shapes panel in draw.io.
  2. Enable the checkbox next to the SAP shape library in the Networking section and click Apply.
    Enable the IBM shape libraries to draw IBM infrastructure diagrams

Tip: There are also several IBM infrastructures in the template library. Select Arrange > Insert > Template from the menu or + > Template in the toolbar, and look in the Cloud > IBM category.
draw.io has several example IBM infrastructures in the template library

Using old and new IBM shapes in one diagram

The new IBM Cloud shapes are compound shapes - a coloured background shape and an icon on top in the centre. This gives you more flexibility in styling your diagram as you can change the two shapes' fill colours independently.

The older shapes are round with a white icon and blue text label, while the new IBM Cloud shapes are square with a white icon and text (in light mode) or black icon and text (in dark mode).

There is also a larger and more varied set of groups (region shapes) in the new IBM Cloud shape library.
The new IBM Cloud shapes work well with the older IBM shape library in draw.io
The example above is one of the IBM templates available in draw.io with the new IBM Cloud shapes replacing some older components.

Both sets of shapes work well when diagramming in dark mode - the new shapes will switch icon and label colours automatically to remain readable.
The new IBM Cloud shapes automatically swap colours to remain readable in dark and light mode in draw.io

Tip: To make the labels look the same on all of your IBM and IBM Cloud shapes, you'll need to edit the text labels to ensure their case matches and the Font Color in the Text tab of the format panel.

However, mixing shapes from the two shape libraries and using their default label styles shows which components of your infrastructure are more recent at a glance, such as for IBM's newer cloud and Watson AI services.

Make your own IBM shapes

The shapes in both the IBM and IBM Cloud shape libraries represent only part of the constantly expanding IBM Design Language.

You can easily make your own IBM shapes in draw.io using the black IBM .svg icons.

  1. Add one of the IBM Cloud shapes that matches the colour you want to use to the drawing canvas to serve as a template for your new shape.
  2. Add a simple rectangle from the General shape library.
  3. Select the IBM Cloud shape on the drawing canvas and select then select Copy Size in the Arrange tab of the format panel. Select the rectangle and click on Paste Size.
  4. Select the IBM Cloud shape again, then select Copy Style in the Style tab of the format panel. Select the rectangle again and click on Paste Style.
    Make your own IBM shape using an existing IBM Cloud shape as a template for style and size
  5. You may need to deselect the Line checkbox in the Style tab, but your shape background should now look correct.
  6. Add a label, and move its Position to the Bottom via the Text tab of the format panel.
  7. Now, make the compound icon. Drag the .svg file of the UI icon from the UI Icons list in the IBM Design Language - either from the webpage directly, or from your device - onto the drawing canvas to import it. Then drag it over the centre of the background square.
  8. Finally, drag a selection box around the new compound shape, right click and select Group from the context menu.
    Make your own IBM shape using an existing IBM Cloud shape as a template for style and size

Tip: To use this new shape in multiple diagrams, drag the group onto the Scratchpad in the shapes panel.
Make your own IBM shape and save it in the draw.io scratchpad

You can also save the Scratchpad with your custom shapes to share them with your colleagues.

  1. Click on the pencil to the right of the Scratchpad library.
    Edit the draw.io scratchpad and export the shapes in it to a custom shape library
  2. Select Export to save all the shapes in the Scratchpad to a custom shape library.
    Edit the draw.io scratchpad and export the shapes in it to a custom shape library
  3. Enter a filename, select where to save the custom shape library file and click OK.
    Edit the draw.io scratchpad and export the shapes in it to a custom shape library

Learn more about custom shape libraries

Updated Citrix shape library for clean infrastructure diagrams

· 5 min read
draw.io
draw.io Team

The new Citrix shape library helps you to draw Citrix diagrams of complex infrastructures that are easier to read. The older 3D shapes are still available in the Citrix (legacy) shape library.
Enable the new Citrix shape library to draw Citrix infrastructure and network diagrams

Citrix is a popular secure centralised platform for deploying applications, desktops and virtual solutions to devices in large enterprises with locations distributed worldwide, especially where high availability and scalability is required.

Learn more about drawing infrastructure and network diagrams

Enable the new Citrix shape library in draw.io

  1. Click on More Shapes at the bottom of the shapes panel in draw.io.
  2. Enable the checkbox next to the SAP shape library in the Networking section and click Apply.
    Enable the new Citrix shape library to draw Citrix infrastructure diagrams

Citrix infrastructure diagram tips

  • Use regions to visually group segments, security zones, and workloads. A simple rectangle placed behind a group of systems or services is the simplest option. You could also use collapsible container shapes or AWS groups.
    Use rectangles with different fill colours and line styles

  • Use shape fill colours and outline styles consistently to visually indicate regions, types and grouping of services or tools, or show which teams are responsible for maintaining those infrastructure areas.

  • Use application, device and platform logos where possible. Search for these by name in the top left of the shapes panel in draw.io. Hover over any shape to see a larger preview.
    Search for infrastructure shapes and tool logos using their names

  • Add a legend if necessary. This is especially important when working with external parties, as they may not be familiar with all the components in your infrastructure.

  • Align shapes using the blue guidelines that appear as you move them around the drawing canvas.
    Align shapes using the snap to grid and guideline tools for neat diagrams

  • To group shapes once you have drawn a subsystem and placed it in a region, drag a selection box around all the shapes, right-click and select Group from the context menu. Now you can move the group without losing its internal layout.

Draw multi-platform infrastructure diagrams

Enable the AWS, Google Cloud Platform and Azure shape libraries in draw.io to document your multi-environment infrastructure.

You can use the up-to-date shapes in the AWS groups, GCP Zones and cards from the Google Cloud Platform libraries to indicate different regions. Alternatively, place an identifying shape in the top left corner of a basic rectangle shape, move the shape label to the right and position it neatly with custom spacing.
Align shapes using the snap to grid and guideline tools for neat diagrams

This will let you show how sub-systems are isolated and confined to each region in your cloud platforms and how loads are distributed when using the Citrix Hybrid Multi-Cloud.
Use rectangles with different fill colours and line styles
Open this example in the diagram viewer

Basic infrastructure templates are under Cloud and Network in the template library. Select Arrange > Insert > Template from the menu or click + > Template in the toolbar.
Example infrastructure diagrams using various platforms are available in the template library

Additional examples are in the drawio-diagrams repository on GitHub. Check for cloud and network templates, and more detailed examples. You can import a diagram into draw.io as a template using its raw GitHub URL.

Some platforms can automatically generate AWS, GCP or Azure diagrams of your implemented infrastructure. Cloudcraft and Cloudockit can export to the .drawio or .vsd formats. Select File > Import from or drag and drop this file onto the drawing canvas to import the diagram of that sub-infrastructure.

Mermaid in draw.io updated to support ELK layout

· 6 min read
draw.io
draw.io Team

Mermaid is a text-based syntax that you can use to describe a diagram, and automatically lay it out neatly on the diagram canvas. Enter your Mermaid diagram description in draw.io via Arrange > Insert > Mermaid in the draw.io menu or + > Mermaid from the toolbar. draw.io has updated to Mermaid version 10.9.1 to support the new ELK automatic layout.
Tell the Mermaid diagram generation tool to use the ELK layout option in your text diagram description

Text to diagram tools in draw.io

There are several text-to-diagram tools built into draw.io:

Paste the Mermaid syntax text version of your diagram and Insert it onto the draw.io canvas An example Gantt chart inserted from Mermaid code
Example Gantt chart generated from Mermaid syntax

Some of these text-to-diagram features generate a diagram as an image on the drawing canvas, and some use draw.io shapes to automatically layout your diagram and let you continue adding draw.io shapes and connectors to it.

You can choose your preferred output when you generate a diagram from Mermaid syntax, although some diagram types - like the Gantt chart above - will only generate to an image.

Insert a Mermaid diagram in draw.io

An example coffee machine debugging flow is described in Mermaid syntax below.

graph TD
A(Coffee machine <br />not working) --> B{Machine has power?}
B -->|No| H(Plug in and turn on)
B -->|Yes| C{Out of beans or water?} -->|Yes| G(Refill beans and water)
C -->|No| D{Filter warning?} -->|Yes| I(Replace or clean filter)
D -->|No| F(Send for repair)

Add this Mermaid diagram to draw.io.

  1. Select Arrange > Insert > Mermaid from the menu or + > Mermaid from the toolbar if you are using the Simple mode or the Sketch editor theme.
    Click Arrange /> Insert > Mermaid to create a diagram from Mermaid Markdown-inspired code
  2. Enter the text description of your diagram using Mermaid syntax in the large text box.
  3. From the drop-down list, select whether you want to insert the diagram with draw.io shapes (Diagram), or as a single image (Image), and click Insert.
    Paste the text in Mermaid syntax, then click Insert

Diagram (default): When you insert the Mermaid diagram using the draw.io shapes, you can connect additional shapes and connectors and style your diagram. To change the original Mermaid syntax, first delete the previously inserted shapes, and re-enter the Mermaid description of your diagram by repeating the steps above.
By default, Mermaid diagrams are added to the drawing canvas with draw.io shapes so you can style and add to your diagram as needed

Image: To generate the Mermaid diagram as a single SVG image on the drawing canvas instead, select Image from the drop-down list before you Insert. If you hover over the SVG image, the Mermaid syntax is visible in the tooltip. Note that you can't edit or style the individual shapes or connectors in this SVG image version.
Hover over a Mermaid diagram image in draw.io to see the Mermaid syntax for that diagram in a tooltip

To change a Mermaid diagram added as an image, double click on the SVG on the drawing canvas and edit the Mermaid syntax to regenerate the image.

Please refer to the Mermaid documentation for the complete syntax and styling options.

New ELK layouts for large flowcharts

The new ELK layout option, introduced in Mermaid version 9.4, can generate compacter versions of large and complex flowcharts.

Add the following renderer directive to the top your Mermaid diagram text description:

%%{init: {"flowchart": {"defaultRenderer": "elk"}} }%%

For example, to layout the example Mermaid graph shown above with the ELK renderer command, the insert Mermaid dialog looks as follows.
Tell the Mermaid diagram generation tool to use the ELK layout option in your text diagram description

Click Insert, and the Mermaid diagram will be generated ad drawn with draw.io shapes.
The ELK layout may be more suited for larger and more complex flows

While this example is small and simple, larger flows with complex decisions and many branches may be displayed better using this ELK renderer option.

Note: As this is an experimental feature from the Mermaid developers, it currently only supports the flowchart layout.

Large Mermaid flowchart with and without ELK

Below, one of the more complex draw.io flowchart templates has described in text using Mermaid syntax and inserted as an image. The more compact version on the left used the new ELK renderer directive, and the one on the right did not.

The ELK layout may be more suited for larger and more complex flows

With the ELK renderer directive, the Mermaid code for this flowchart looks as follows.

%%{init: {"flowchart": {"defaultRenderer": "elk"}} }%%

graph TD
A[\Replenish Value Add stock/] --->C
B(Order product with Value Add) --->C
C{Frequent process?} --->|Yes|D
C --->|No|F
D{New template?} --->|Yes|E
D --->|No|G
E(Create work order template) --->G
F(Create work order) --->H
G(Copy template to work order) --->I
H(Add materials to work order processes) --->J
I(Adjust material quantities) --->J
J(Monitor work orders) --->K
K{Material quantities in stock?} --->|No|L
K --->|Yes|M
L(Procure materials) --->M
M(Change status to In Progress) --->N
N{External Vendor to perform step?} --->|Yes|O
N --->|No|P
O(Add vendor costs) --->Q
P[\Perform work order step/] --->R
Q([Ship materials to Vendor]) --->S --->X
R{Additional processing required?} --->|Yes|N
R--->|No|T
S[\Perform work order step/] --->U
T(Receive final stock) --->V
U(Receive product from vendor) --->W
V(Ship product on order) --->Y
W{Partial quantity received?} --->|Yes|X
W --->|No|Z
X[Create work order backorder] ---> J
Y(Change status to complete) --->AA
Z(Pay vendor invoice) --->R
AA([Finish])

Useful medical diagrams for patients

· 8 min read
draw.io
draw.io Team

Diagrams for the medical industry are often described from the perspective of an organisation or hospital, but how can the most important people in medicine - the patients - use diagrams themselves to get better treatment outcomes?
Add your name, date of birth, and the date you updated each diagram on the three labels of a plain connector

Doctors are under pressure to see as many patients as possible. Plus, it can be quite intimidating for patients during a consultation, and often impossible to describe all relevant symptoms in a way that is concise and clear.

Diagrams that present all the relevant information make life easier for both the patient and doctor.

Humans take in information faster and misunderstand less often when it is presented visually. Plus, if you diagram your medical problems, you can re-use the diagrams with other doctors - it saves you the stress of remembering all the details and explaining them in exactly the same way multiple times.

So, what type of diagrams can patients use?

Concept maps to relate symptoms

A directed graph or concept map can show at a glance which clusters of symptoms are related, and which are secondary. Such a diagram helps doctors evaluate which illnesses could be the underlying problem and find solutions for multiple symptoms.
A symptom graph noting common long covid symptoms - see it in a glance rather than a long spoken explanation

  • Use light fill colours to group related clusters of symptoms, and black text for ease of scanning and printing.
  • Use thicker connectors or shape outlines to show a stronger impact (Line in the Style tab of the format panel).
  • Use arrows or a double connector for symptoms that are triggered by other symptoms.

Concept maps to detail diagnoses

Doctors may find it more helpful to see how diagnoses are related if you are unlucky enough to have been diagnosed with several illnesses, especially where treatments can interfere with other diagnoses.
A symptom graph noting common long covid symptoms - see it in a glance rather than a long spoken explanation

Timelines and symptom cycles

To show when symptoms started and how they have progressed, or how symptoms appear to worsen or get better in cycles, a timeline or a gantt chart is ideal.
A symptom graph noting common long covid symptoms - see it in a glance rather than a long spoken explanation

You could also use such a symptom timeline to show how a medication change has impacted symptoms - important when trialling which medication has the most positive effect.

If you have a recurrent problem that requires repeated surgeries or courses of hefty medication, a visual timeline avoids having to explain a lengthy treatment history in conversation, where things are likely to be forgotten or out of order. Use a gradient fill colour to show how symptoms worsen or improve during the cycle.
Draw a cyclic timeline to show symptoms that appear on a regular schedule

You will need a few cycles of tracking and recording your symptoms to discover a pattern, but doctors say they find this type of diagram helpful for both diagnosis and treatment.

Triggers vs symptoms

There are a number of ways to visualise symptoms that are not tied to a timeline or periodic cycle. You could use a cause and effect diagram like the one below, a concept map or mind map, a cluster graph, relational graph - anything that shows how your triggering situations or substances relate to symptoms.
An Ishikawa or cause and effect diagram is well suited for diagramming triggering situations for medically significant symptoms

Take the time to record when symptoms appear and what caused them. This is increasingly important with the rise of long covid and other post viral problems, as well as for diagnosing arthritis and other autoimmune diseases, and non-specific chronic pain issues.

T-charts and Venn diagrams also let you quickly and visually sort a list of treatments, situations or medications into categories - those that improve or worsen symptoms, or have no impact.

More diagrams for patients

There are many other types of diagrams that may be useful, especially if you are attending a doctor's consultation online.

A chart of blood pressure values, or weight over time. If you use a smart blood pressure monitor, export the graph from your monitoring app as an image and drag the image onto the drawing canvas in draw.io.

Or, track it yourself directly in draw.io using a Pool shape from the Advanced shape library and the Waypoint shape (via a shape search) for each value.
Create a graph with the waypoint and pool shapes in draw.io

A labelled photograph or illustration showing exactly where the symptom occurs, or a freehand sketch. The example below uses shapes from the draw.io library (search for user) with basic shapes on top filled with the sketch style to indicate where different types of headache pain is located.
Label any illustration to visually demonstrate your symptoms

Organise and update your medical diagrams

Turnover of staff and short leaves of absence in medical clinics has increased in recent years. Which means, you will likely not see one doctor regularly. That makes it more important for you as the patient to be able to explain your medical history quickly to any new doctor - diagrams will help you do this.

Include your name, date of birth and the date you updated the diagram on each page - this helps doctors associate a health record with a patient. Use a plain connector with three labels as it is easy to copy.
Add your name, date of birth, and the date you updated each diagram on the three labels of a plain connector

More diagramming tips for patients

  • Encourage your doctors to scan these diagrams, especially if they need to review your history without you present for insurance or welfare purposes.

  • Use one multi-page diagram for your medical diagram - you won't have to hunt through files to find all the relevant information.

  • If you are dealing with inherited or genetic diseases, use the list shape in the General shape library to model a family tree of diagnosed related illnesses.
    Draw your family tree to see which conditions may have a genetic component

  • Use a table shape to record your medication schedule and allergies on one of the diagram pages.
    A table shape is an easy way to record medications and allergies

  • Export each page of your diagram to an image (PNG) to print it neatly on one neat page and include the diagram data - this will include all diagram pages, although only one will be shown in the image. You can then reopen the PNG image in draw.io later to update your multi-page diagram.
    Choose the export settings for the PNG image

Using diagrams with GitLab

· 4 min read
draw.io
draw.io Team

draw.io will be available as an integration in the web-based GitLab Wiki editor on 22 March with the GitLab 15.10 release and product kickoff. When you add your diagram to a GitLab Wiki page while editing the source of that page, it will be saved as an SVG image containing the diagram code, and displayed in the page content.

Like all files in GitLab, the image with its embedded diagram is versioned, so all changes are tracked.

Note: As this integration is still under development until release, small changes may be made.

Diagram in the GitLab Wiki editor

Add a new diagram: Click on Insert or edit diagram in the toolbar in the Markdown editor.
Add a diagram to GitLab in the Markdown editor

A blank diagram will be opened in the Sketch whiteboard-style editor theme. Use the diagramming toolbar on the left to access templates and shape libraries.
Create your diagram in the Sketch whiteboard-like editor, and save it to return to the GitLab Markdown editor

Save your diagram: It will be added to the page in Markdown as a .drawio.svg file.

Edit an existing diagram: Make sure your cursor is in the diagram file entry in the Markdown code, and select Insert or edit diagram.
Make sure the cursor is in the Markdown reference to the diagram file then edit the diagram in the GitLab Markdown editor

View a diagram in the page: Click on Preview to render the page containing the diagram.
Preview the page to see how the diagram is rendered along with the markdown text content of the GitLab Wiki page

Diagram with the GitLab rich text editor

Edit a diagram: Select the diagram, and click on Edit diagram in the hover toolbar that appears above or below.
Click on a diagram and use the hover toolbar to edit it in the GitLab rich text editor

Add a new diagram: Make sure no other diagram is selected, then click on the + in the toolbar and select Create or edit diagram.
Make sure you have not selected any diagram, click on the + in the toolbar and select Create or edit diagram to add a new diagram in the GitLab rich text editor

Save individual diagram files to GitLab

You can also store your individual diagram files in GitLab. Select GitLab as the save file destination when you create a new diagram, or select Save as from the menu.
Select GitLab as the location where you want to store your files

Alternatively go to our online editor to start diagramming now using GitLab to store your diagrams.

You'll need to authorise access to your GitLab repositories, if you haven't already done so.
Authorize GitLab to save diagram files to this location

Tip:i As draw.io uses secure direct client authorisation, your password is never shared.

Diagram in VSCode with GitLab

  1. Set up the GitLab Workflow extension for Visual Studio Code.
  2. Install Henning Dieterichs' unofficial draw.io extension for Visual Studio Code

The draw.io extension for VSCode lets you view and edit the .drawio diagram files stored in your repositories.
Use the unofficial draw.io extension for VSCode to edit .drawio files stored in a GitLab repository directly in the Visual Studio Code editor

See how this extension works in GitHub - it works in a similar way with GitLab inside VSCode.

Note: The extension only recognises files with the .drawio file extension.

Feature flag development with tags in gitflow diagrams

· 13 min read
draw.io
draw.io Team

Feature-based development and lean release cycles are becoming more common in online software services (SaaS products), where continuous development and continuous deployment are required. Feature flags give administrators and developers fine control over what features are available to which customer segments on release.
Trunk-based development with feature branches works well with feature flags on release - apply tags to shapes to visualise this in draw.io

Traditional software development

Whether you follow an agile development cycle or not, software updates and new applications contain multiple features, bug fixes and improvements. Development of these usually happens on feature branches (or individual developer branches off feature branches). Once a feature is complete, that feature branch is merged into a development (or occasionally a nightly build branch).

After all the planned features are complete and merged to the this development branch, release candidate branches are used to test builds, and then the software is finally released on the main branch, as you can see in the gitflow diagram below.

An example gitflow diagram
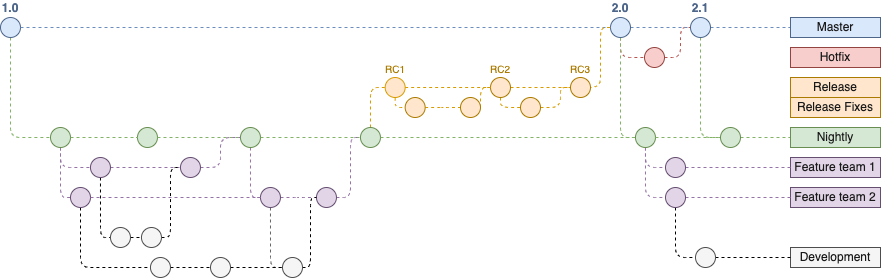
Software development gitflow template using feature branches without feature flags

Once the software is released, you can't control what features the users see - all users gain access to the same features, at the time of release. If something in the software causes a bug, that bug affects all users.

Feature flags provide fine control over released software

With feature flags and a deployment service that gives you control over updates and rollouts based on those flags, you can extend this feature-based development approach into release and deployment.

  • Release a new feature only for a target subset of your SaaS users.

  • Deploy but don't release features that aren't yet ready to test stability and prepare dependent systems.

  • Use front-end flags for UI visibility and back-end flags to control APIs and configurations.

  • Roll out an update incrementally to your user base.

  • Block certain users from accessing certain features.

  • Roll back an unstable update by disabling the problematic feature flag.

  • Release smaller updates more often and incorporate feedback faster.

Feature flags can make continuous development and continuous deployment smoother for both you and your customers.

Use feature flags with feature branches

Feature flags don't replace feature-based development branches, they extend their functionality.

For this example, we'll modify the gitflow that we developed in our earlier post (also available as a template in draw.io).

Note: The diagram file used in this post has multiple pages - one for each method used to display feature flags in the gitflow. Open the file in the draw.io viewer and step through the pages to compare the four different methods.

Leaner trunk-based development

  • As the feature-flag based development cycle is lean with short-lived feature branches, controlled after release via flags, we'll merge directly to the main branch (or trunk).
  • Whenever a feature is merged to the main branch, open feature branches should pull those changes.

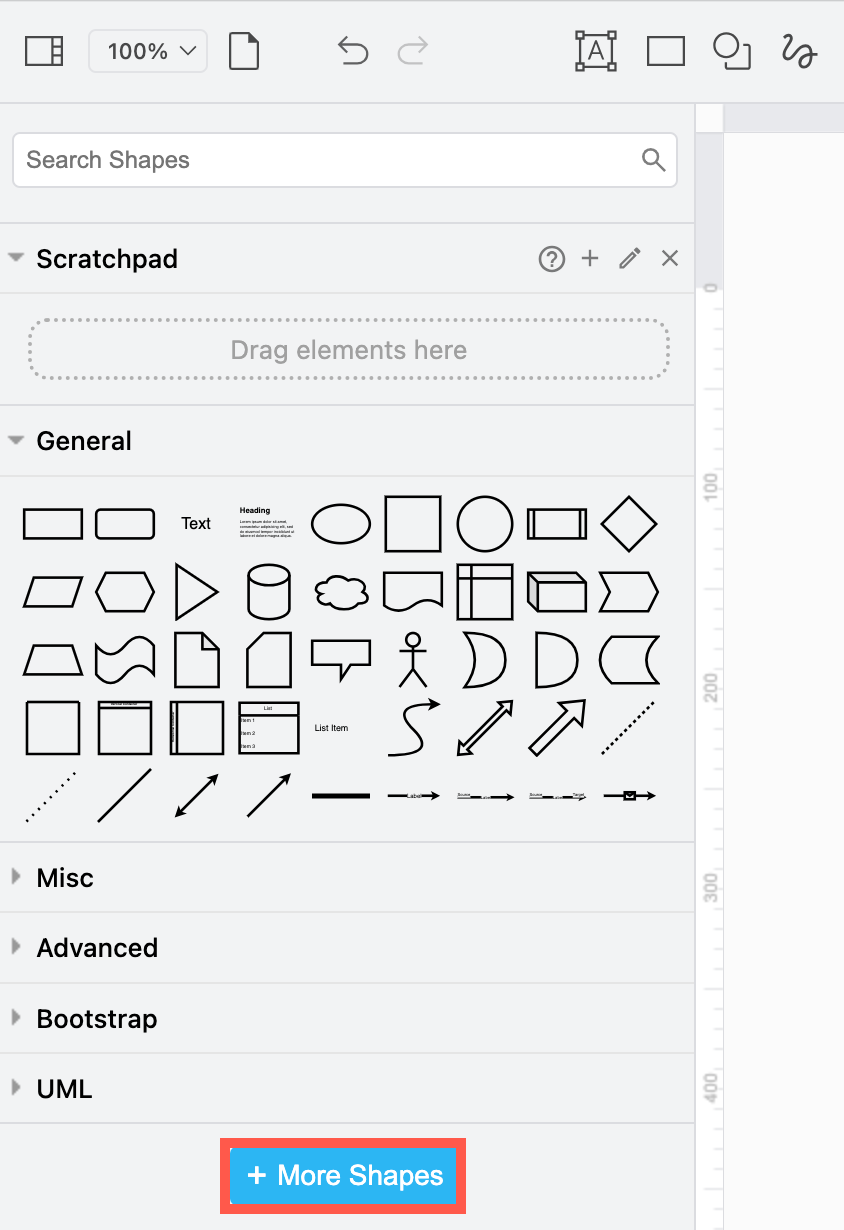
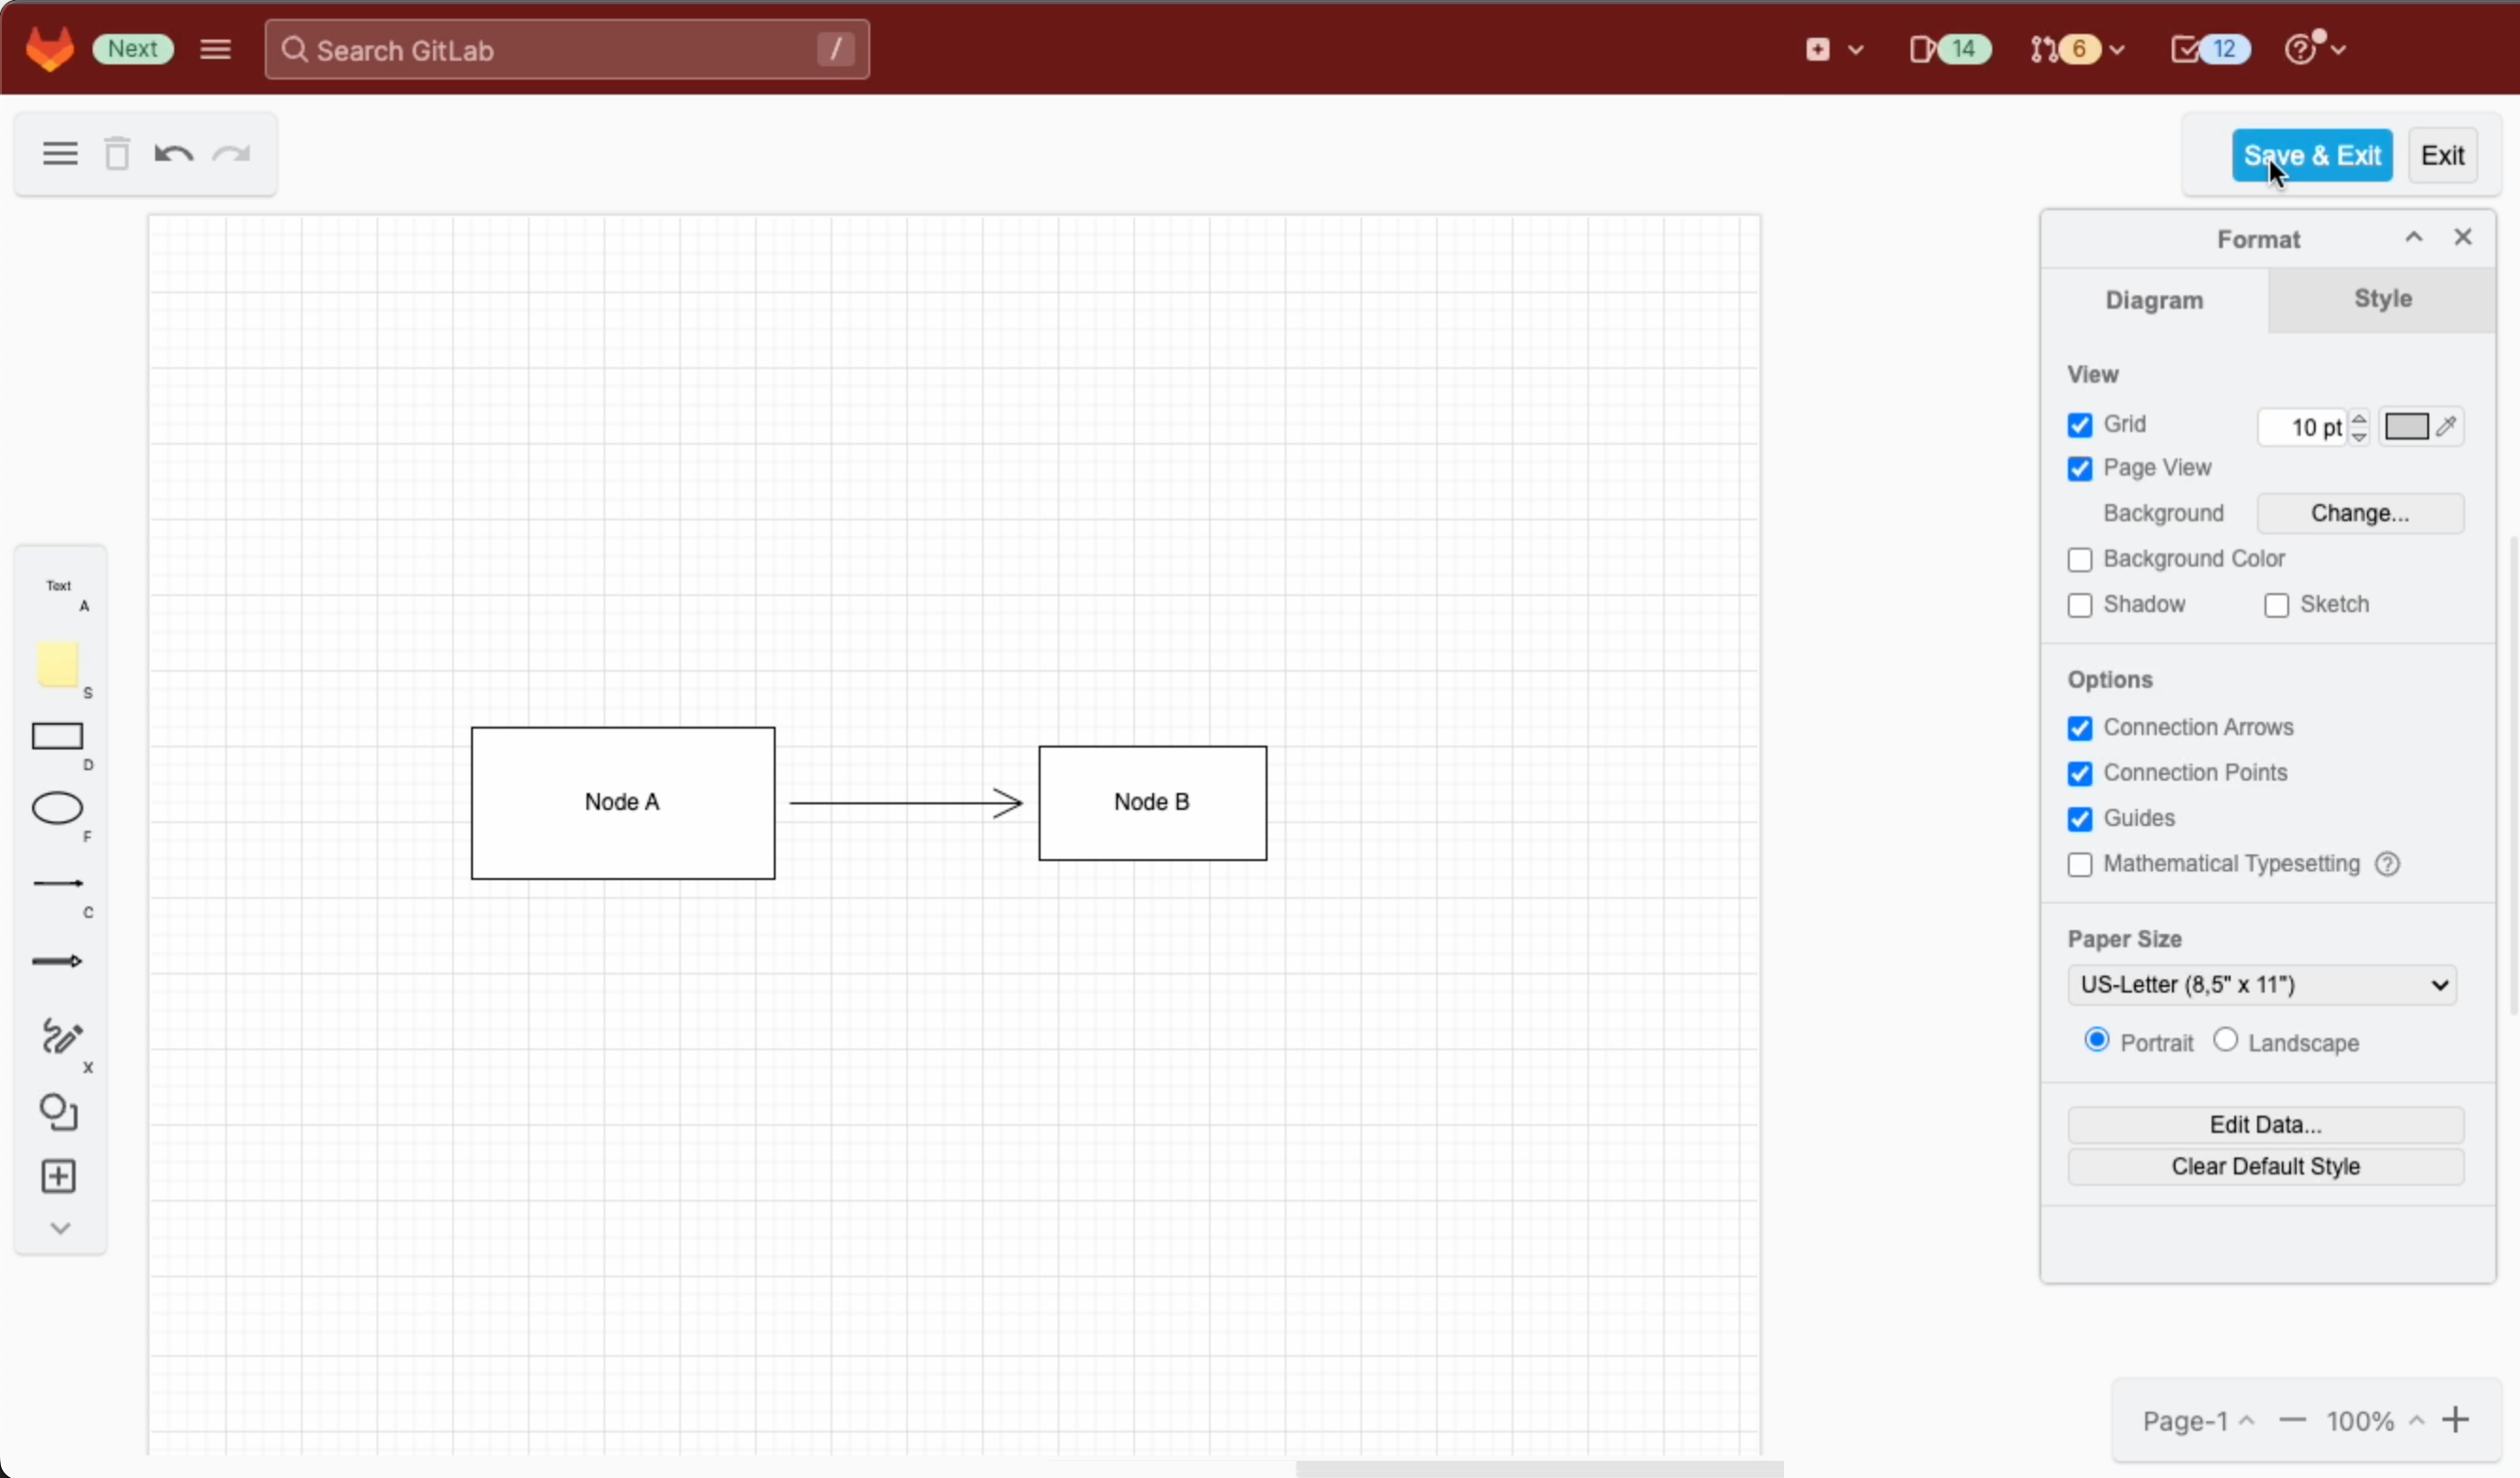
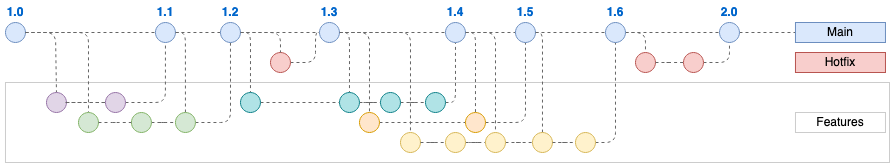
Gitflow diagrams are simple to draw and edit - they use the shapes in the General shape library with basic connectors between them. Follow the steps in our earlier post to create a gitflow that matches your branching structure.

Gitflow modified from the draw.io template for feature-based trunk development before applying feature flag tags
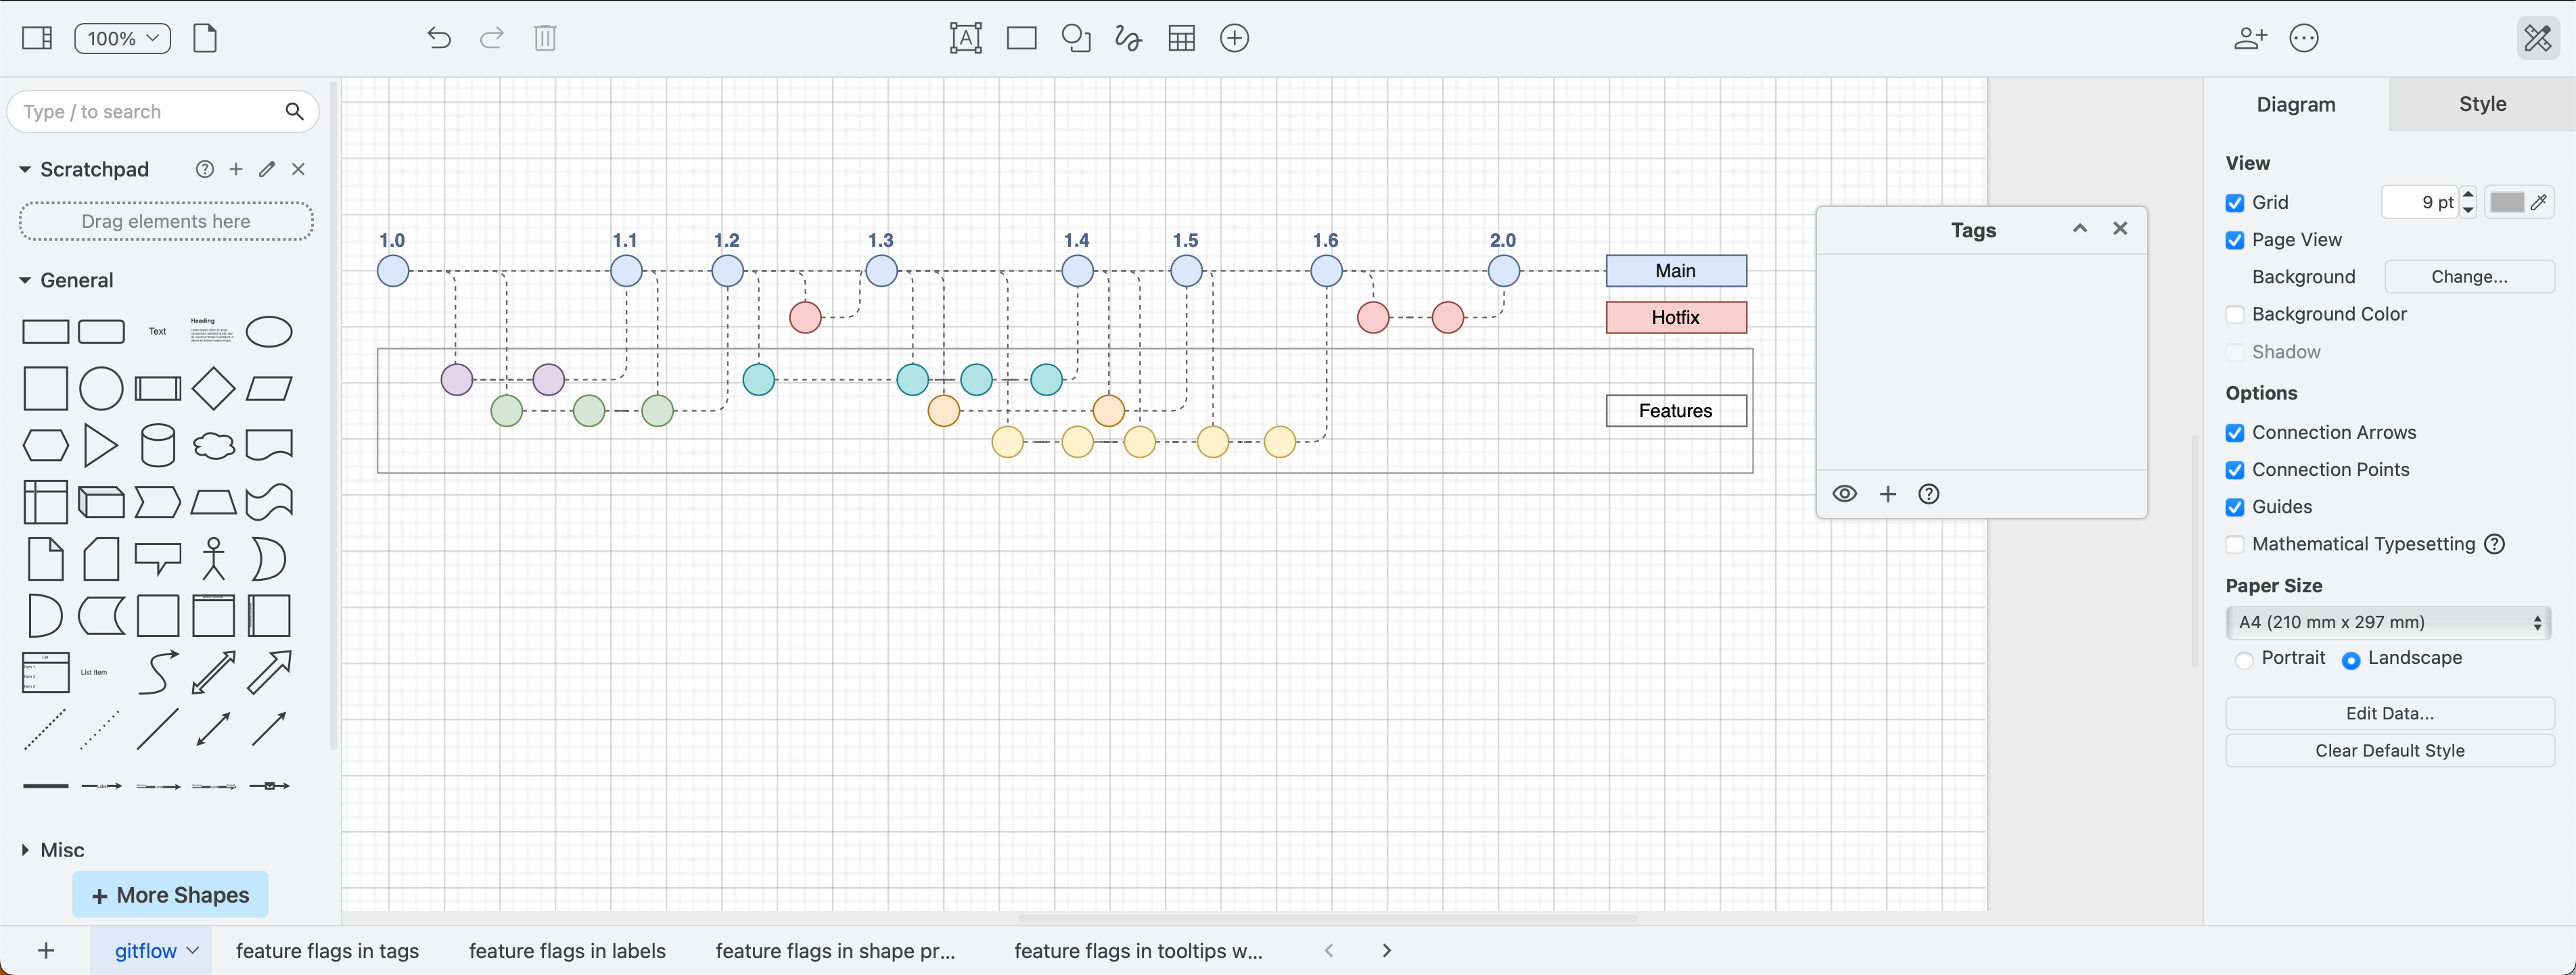
_A modified gitflow from the built-in template to show a trunk-based development structure with short-lived feature branches_

Use tags in your gitflow for feature flags

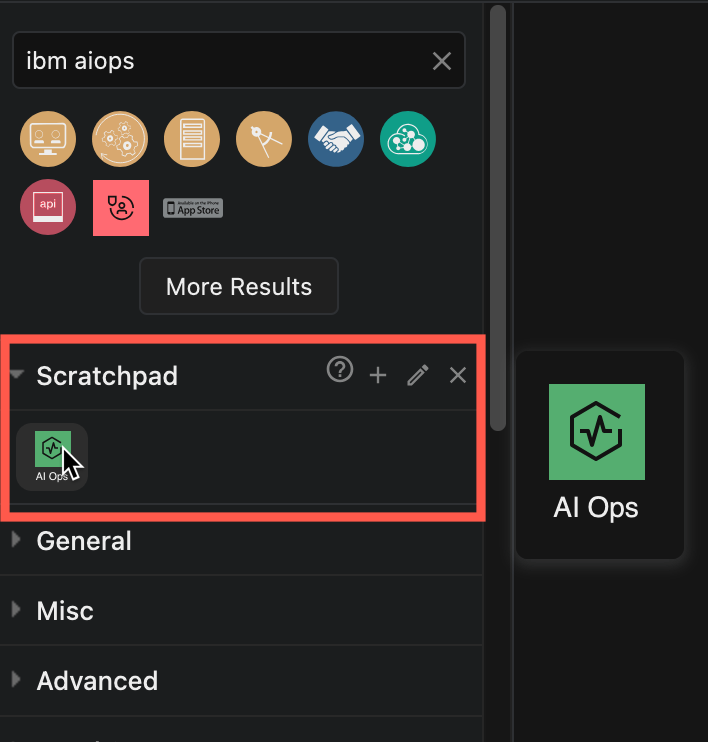
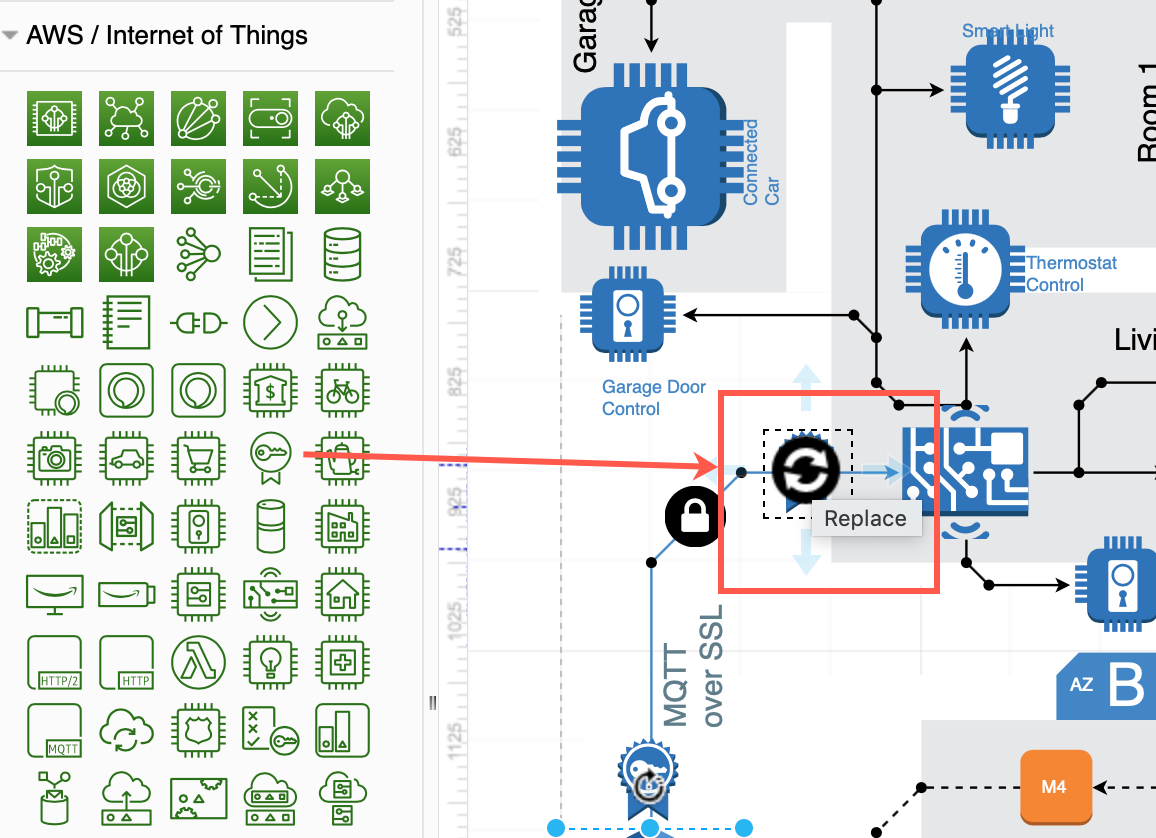
In a draw.io gitflow diagram, you can indicate feature flags in a number of ways, but the easiest is to add tags to shapes.

Tags let you hide or display tagged shapes and connectors, visualising how released software updates will appear to users when feature flags are enabled or disabled.

Add tags to shapes

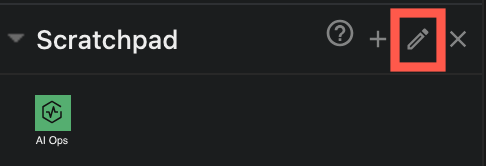
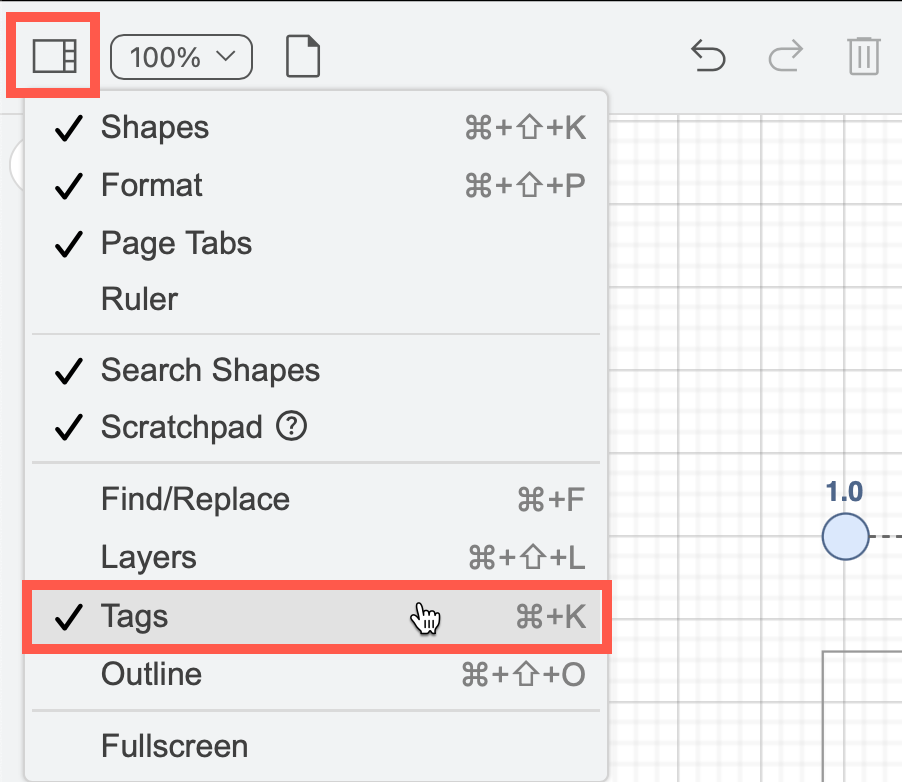
  • To open the Tags dialog, click on View in the left of the toolbar and enable Tags or press Cmd+K on macOS or Ctrl+K on Windows.
    Use the View menu on the toolbar to show the Tags dialog or press Ctrl+K/Cmd+K

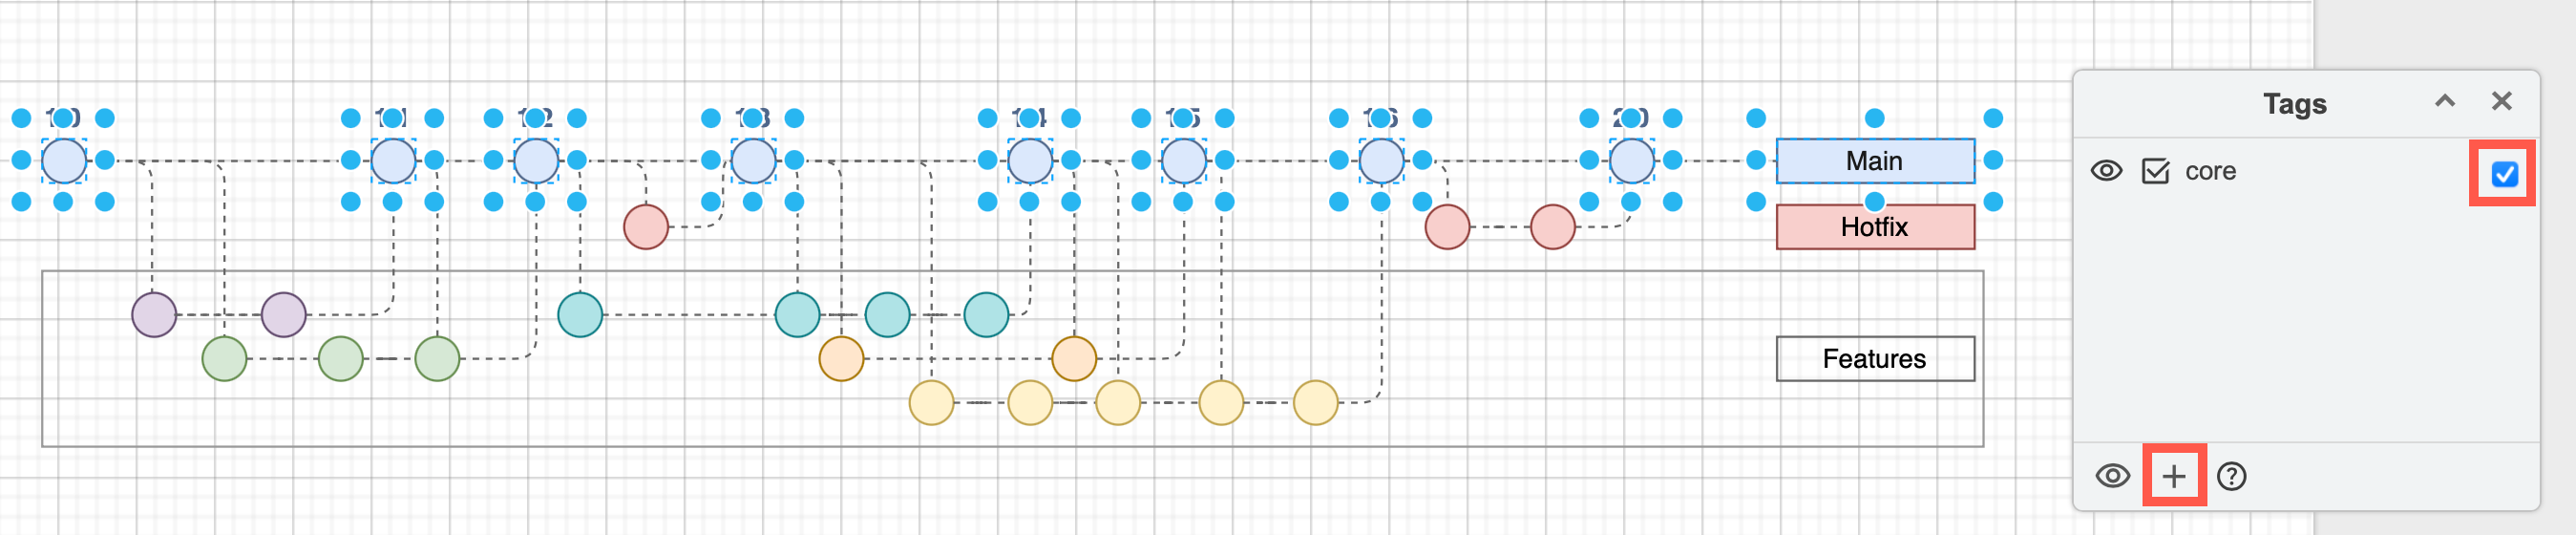
  • Select the shapes and connectors you want to apply a new tag to, and click + in the Tags dialog. Enter the new tag name and press Enter.

  • Select one or more shapes, then click a checkbox to the right of an existing tag to add the tag to the selected shapes.

  • To remove a tag from a shape, select the shape, then deselect the checkbox to the right of its tag name.

Note: In this example, we've added the core tag to all trunk (main) versions to make it easier to visualise.

Gitflow with an added core feature flag to all trunk shapes in the gitflow diagram
Open this gitflow with all feature flag tags in our diagram viewer

Visualise feature flag-affected branches and releases

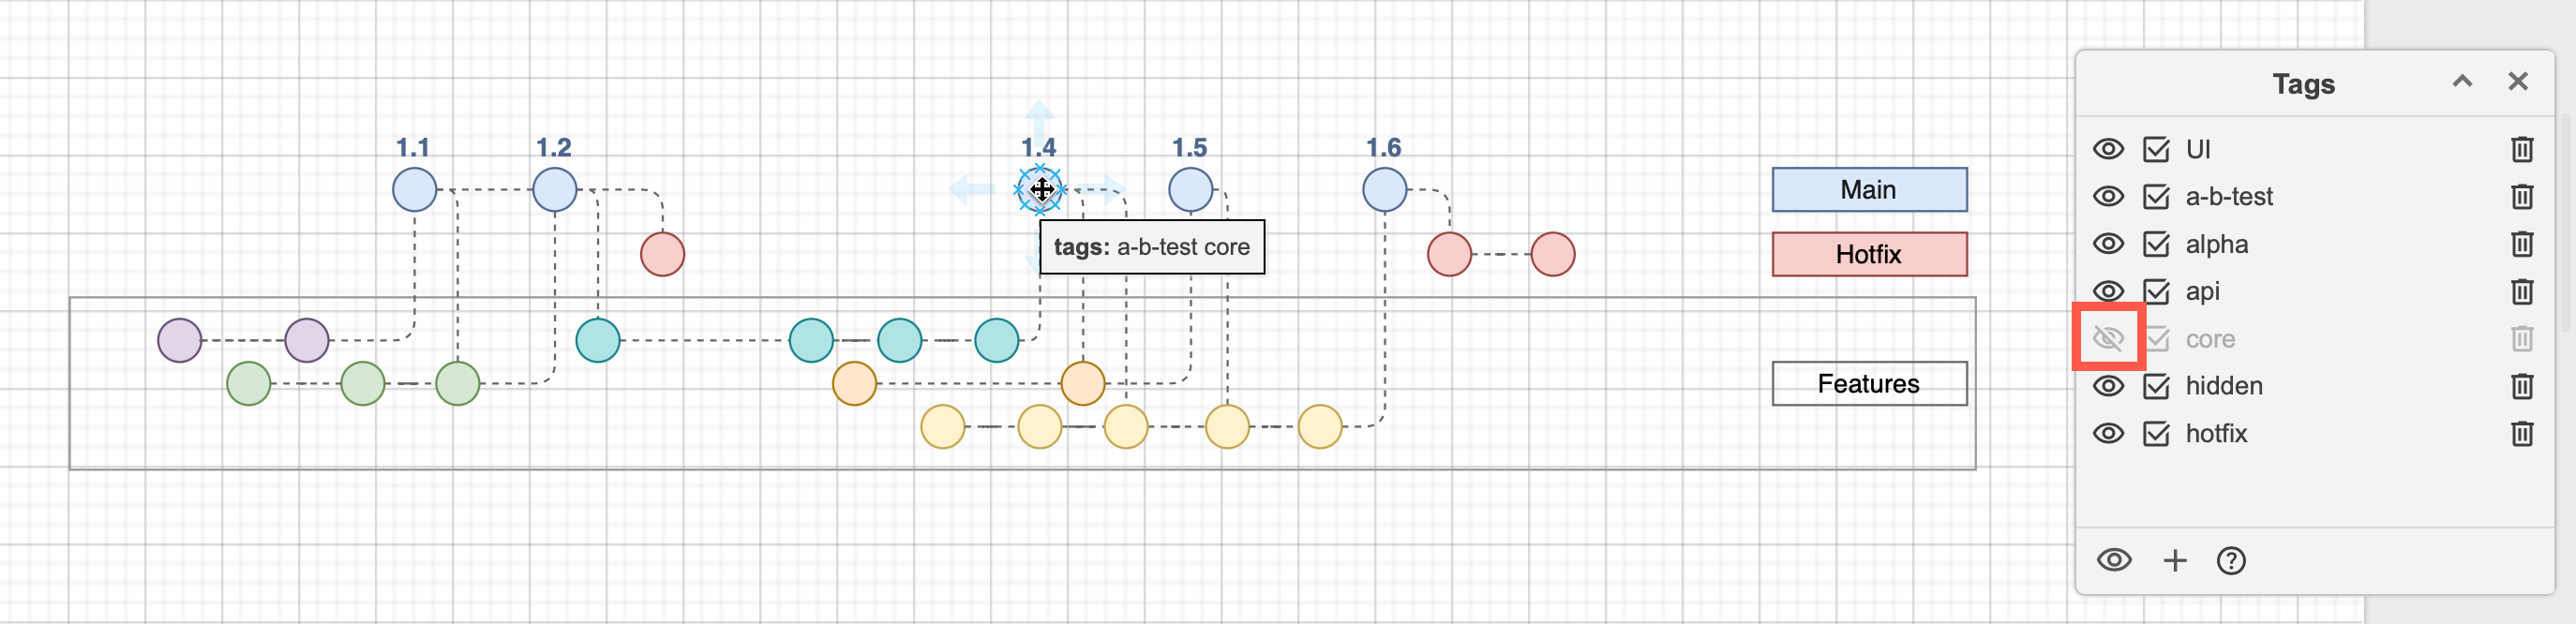
Now, with nothing selected in your diagram, click the eye symbols next to tags (feature flags) to see which feature branches and main versions they affect. If more than one flag is applied to a feature, both need to be hidden to hide those branches they affect.

For example, to see which feature branches are flagged as "api", hide all other branches. If you want to select just those shapes/connectors, click on the select checkbox next to the tag name.
Tags in draw.io let you clearly visualise which feature branches and main versions on the trunk are affected by feature flags and quickly select them

Reset to see all tagged shapes: Click the eye at the bottom of the Tags dialog to show all hidden tagged shapes.

Tips for working with tags in draw.io

  • Hover over any shape to see their tags.
  • Note that connectors coming from or going to hidden shapes will not be displayed even if they are not tagged.
  • Hold down Shift and click on any of the eye symbols in the Tags dialog to hide or display all tags.

In our example Gitflow with feature flag tags, to see which versions on any branch have a feature flags applied, hide the core tag. The shapes that have disappeared are ones that have no feature flags - all customers will be able to see all features on those main versions.
Use an extra tag that applies to all versions on the trunk (main) branch so you can visualise which releases are not actually affected by any feature flags

Alternative methods to add feature flags to gitflows in draw.io

If you don't want the interactive visualisation of tags in the diagram editor or viewer, you could add feature flags in the following ways.


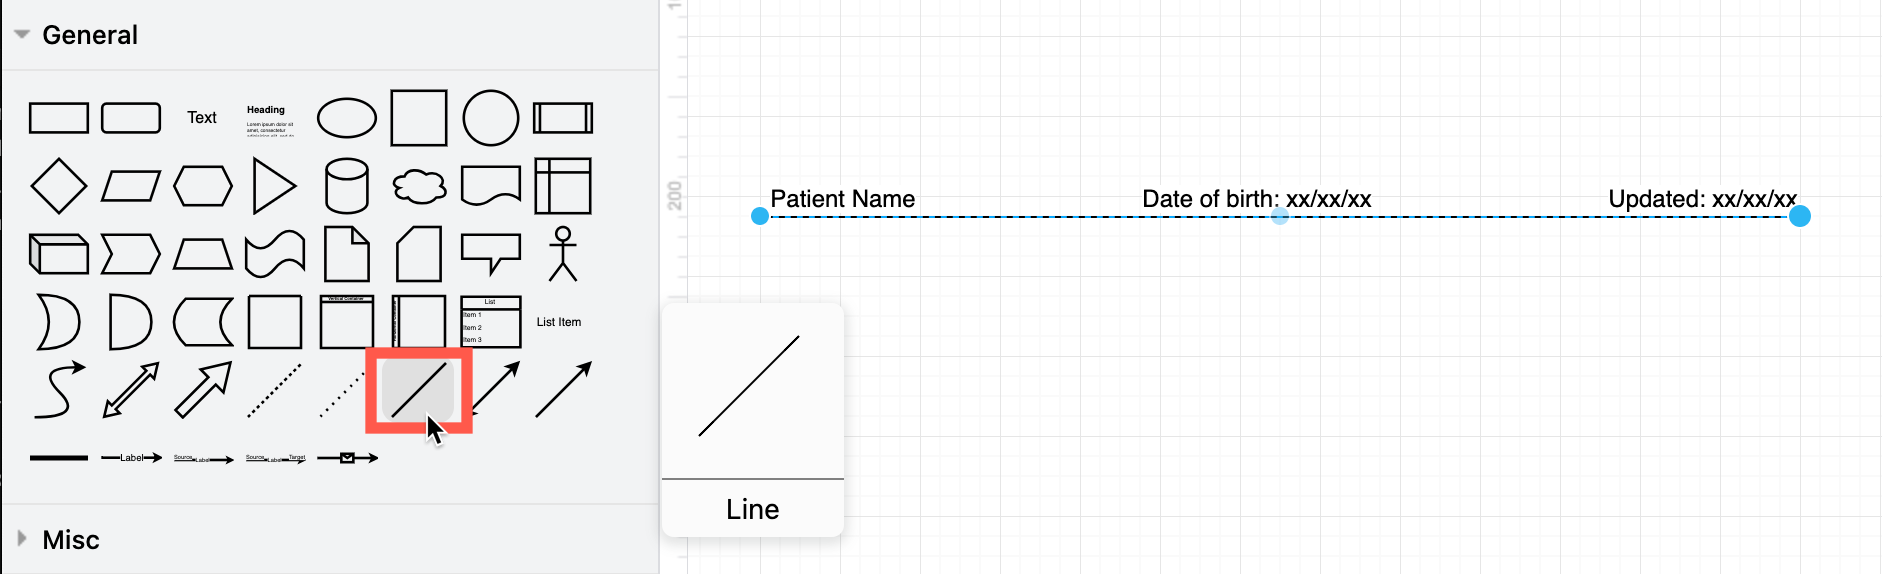
Feature flag labels on released versions

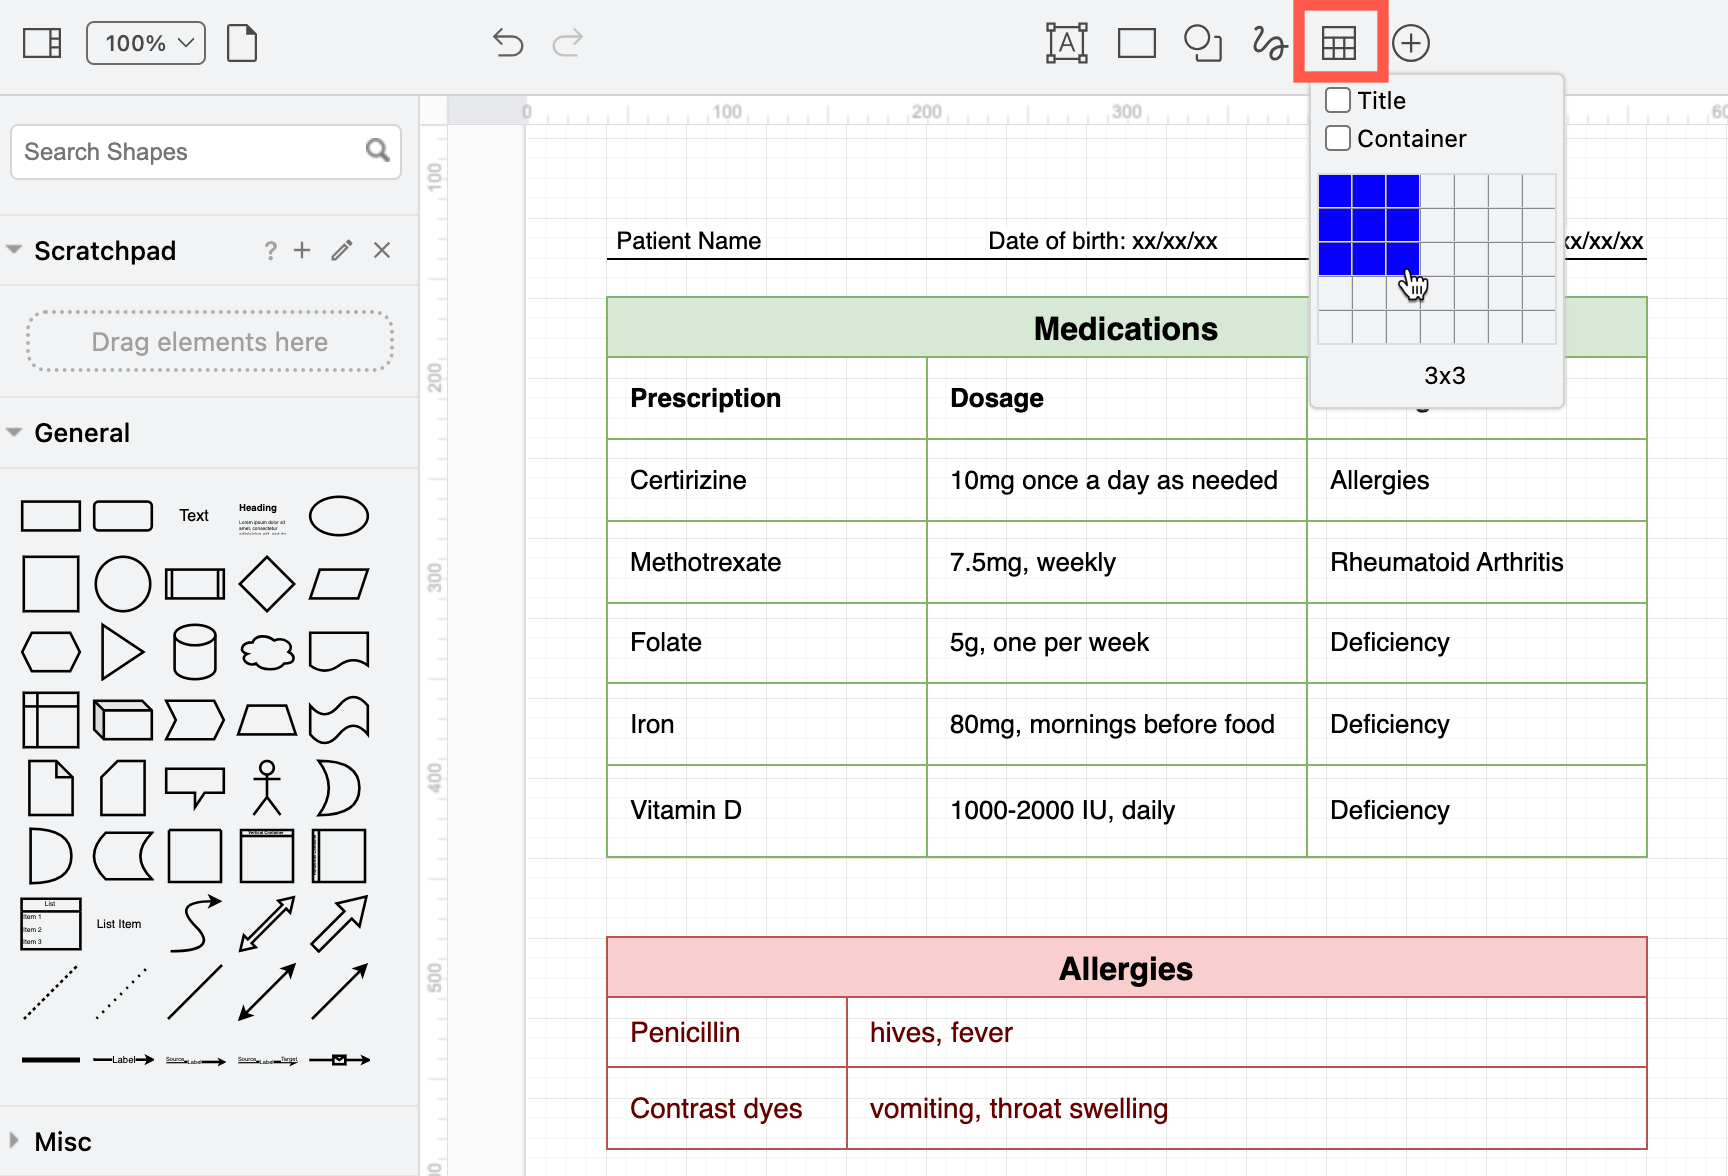
Add callouts with list shapes on the released versions to show which feature flags apply, and avoid cluttering the feature branches in the gitflow.

You could also use a list shape to list the feature flags on each main release
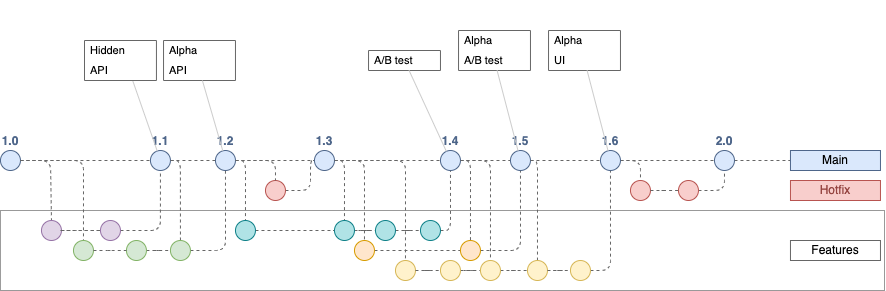
Open this gitflow with feature flags-labelled releases in the viewer


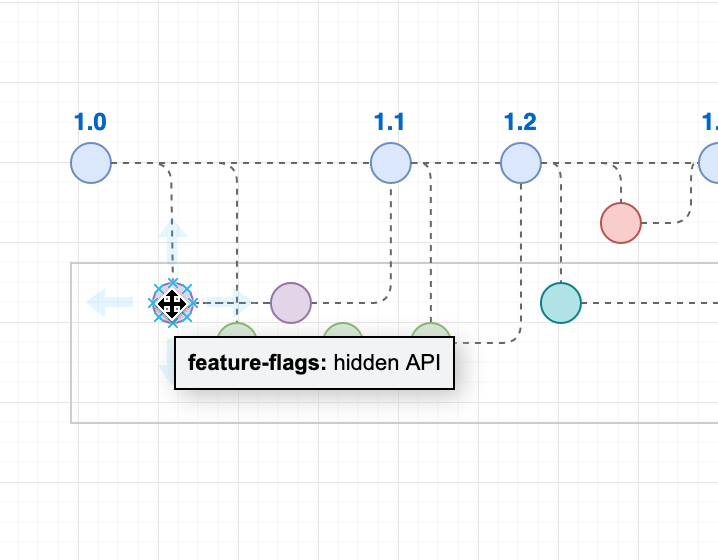
Feature flags in custom shape properties

Also called shape data, these could also indicate feature flags, as just like tags, they are displayed when you hover over a shape in your diagram.
Add feature flags to a custom shape property in your gitflow diagram

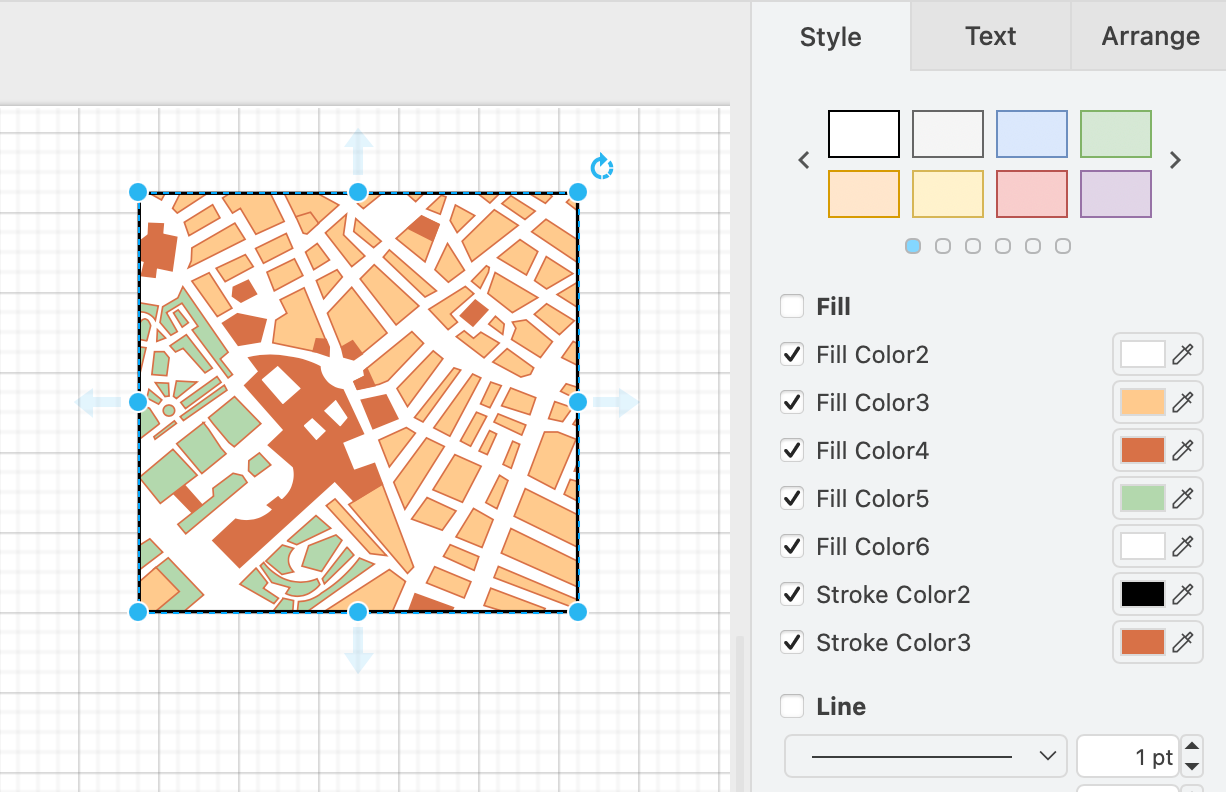
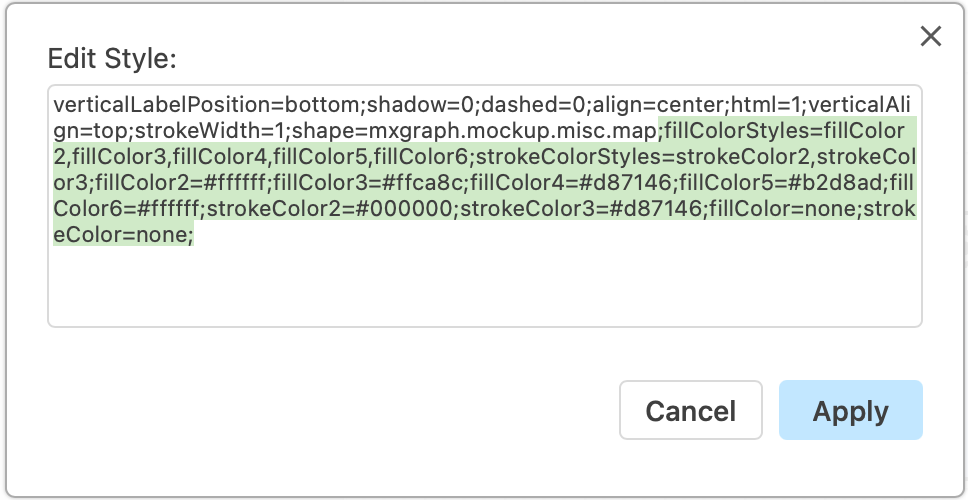
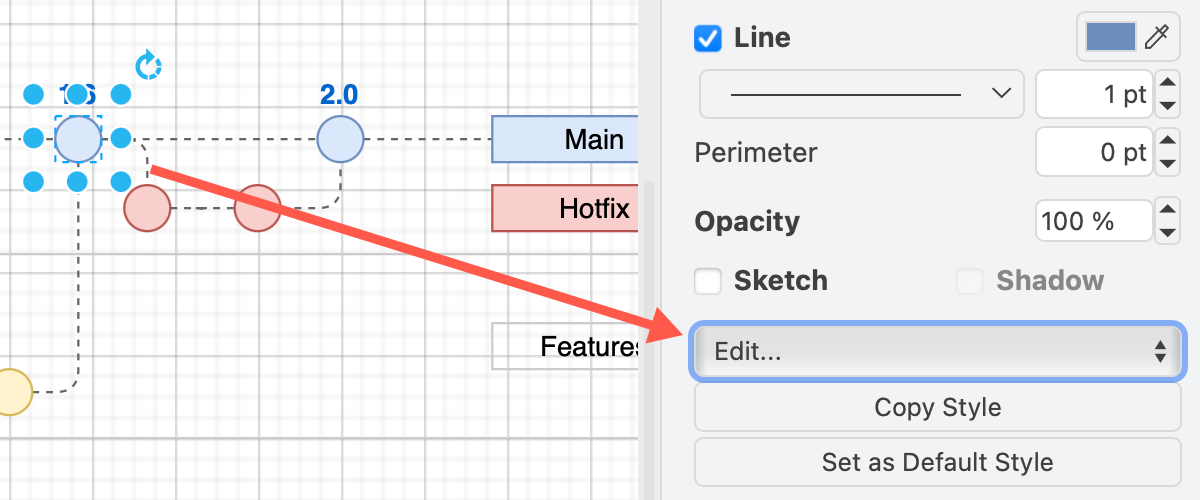
  1. Use the Edit drop down in the Style panel of the format panel on the right to edit, copy and paste shape data, or right-click on a shape then select Edit > Edit Data from the context menu.
    Add feature flags to a shape via Edit /> Data in the Style panel in draw.io
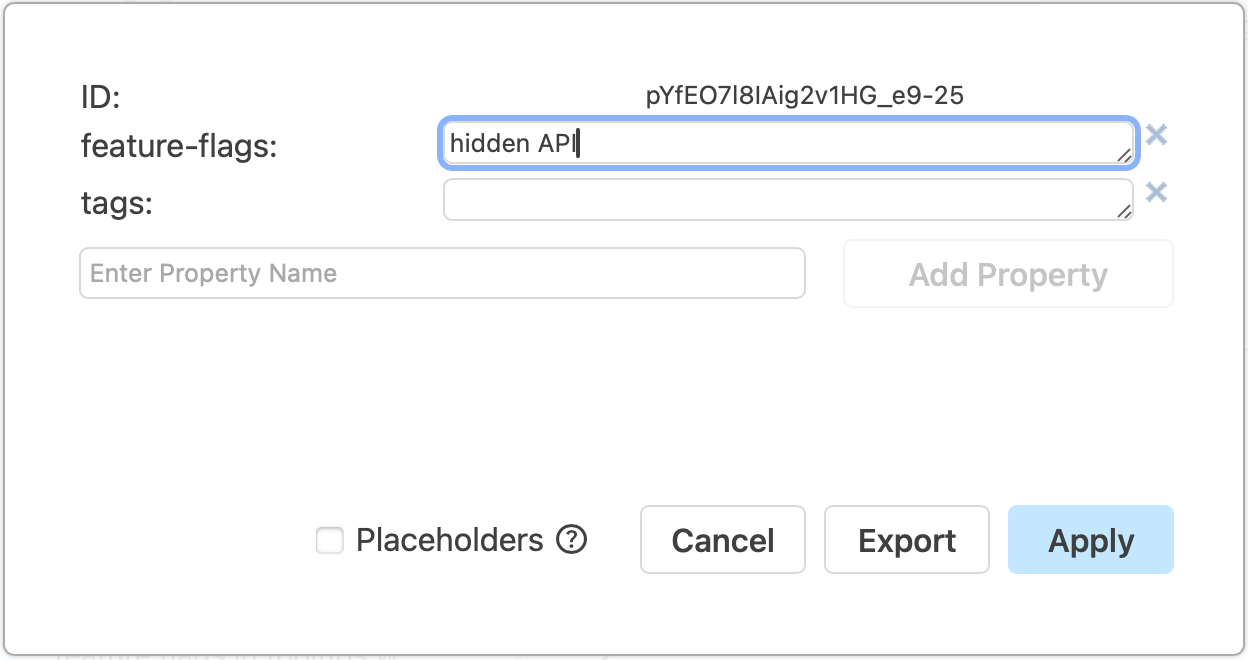
  2. Type the name of a new custom shape property in the Enter Property Name field and click Add Property.
  3. Add the feature flag names in the field next to the new shape property.
    Add feature flags to a custom shape property in your gitflow diagram

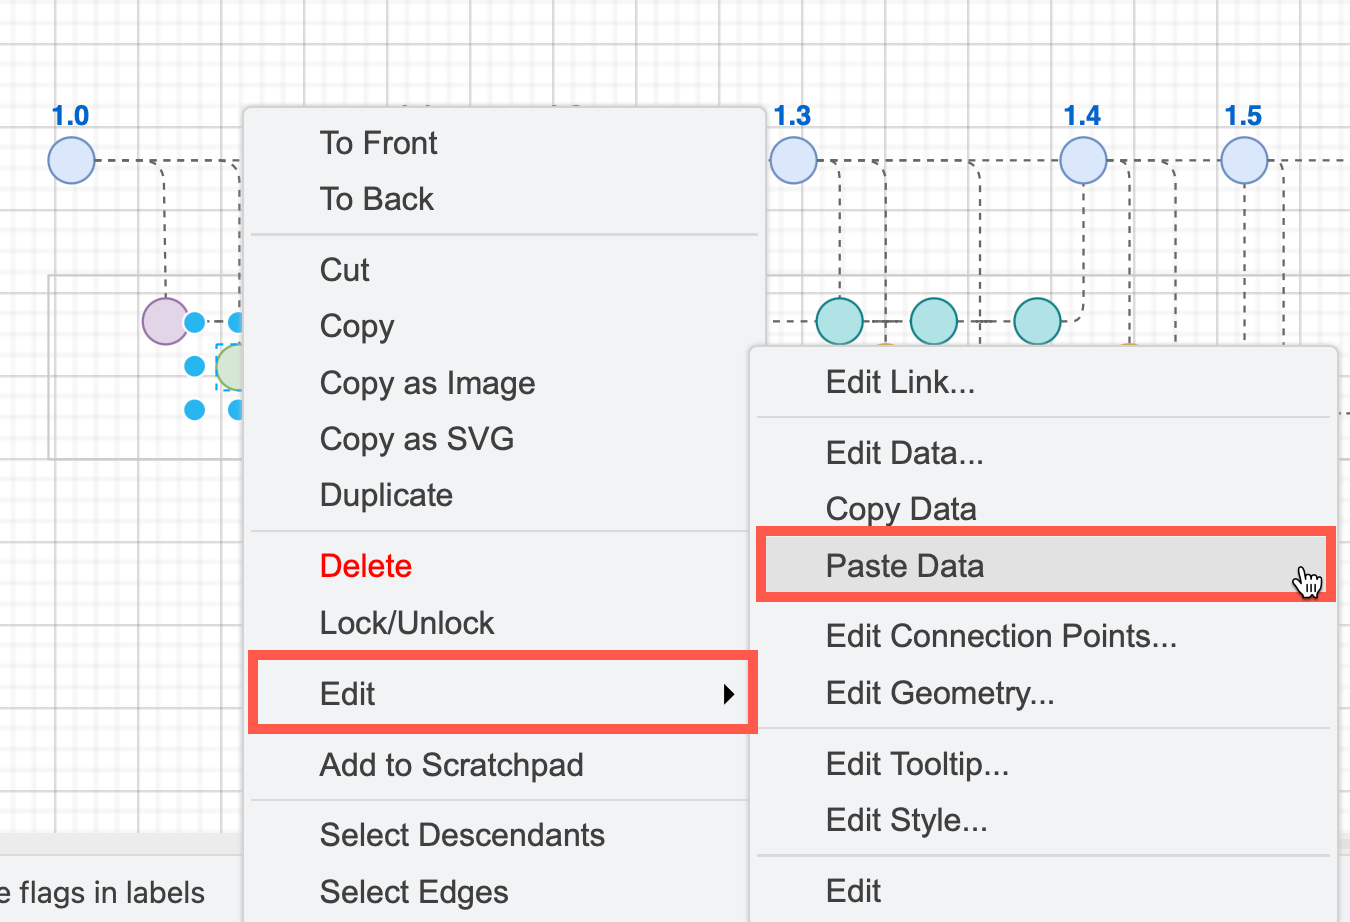
Tip: Copy and paste shape data to quickly duplicate custom properties on another shape via Edit > Copy Data and Edit > Paste Data in the right-click context menu.
Copy and paste tags on shapes via the right-click context menu in draw.io

Learn how to work with custom shape properties

Use custom shape properties to
Open this gitflow in the viewer to see feature flags in shape properties

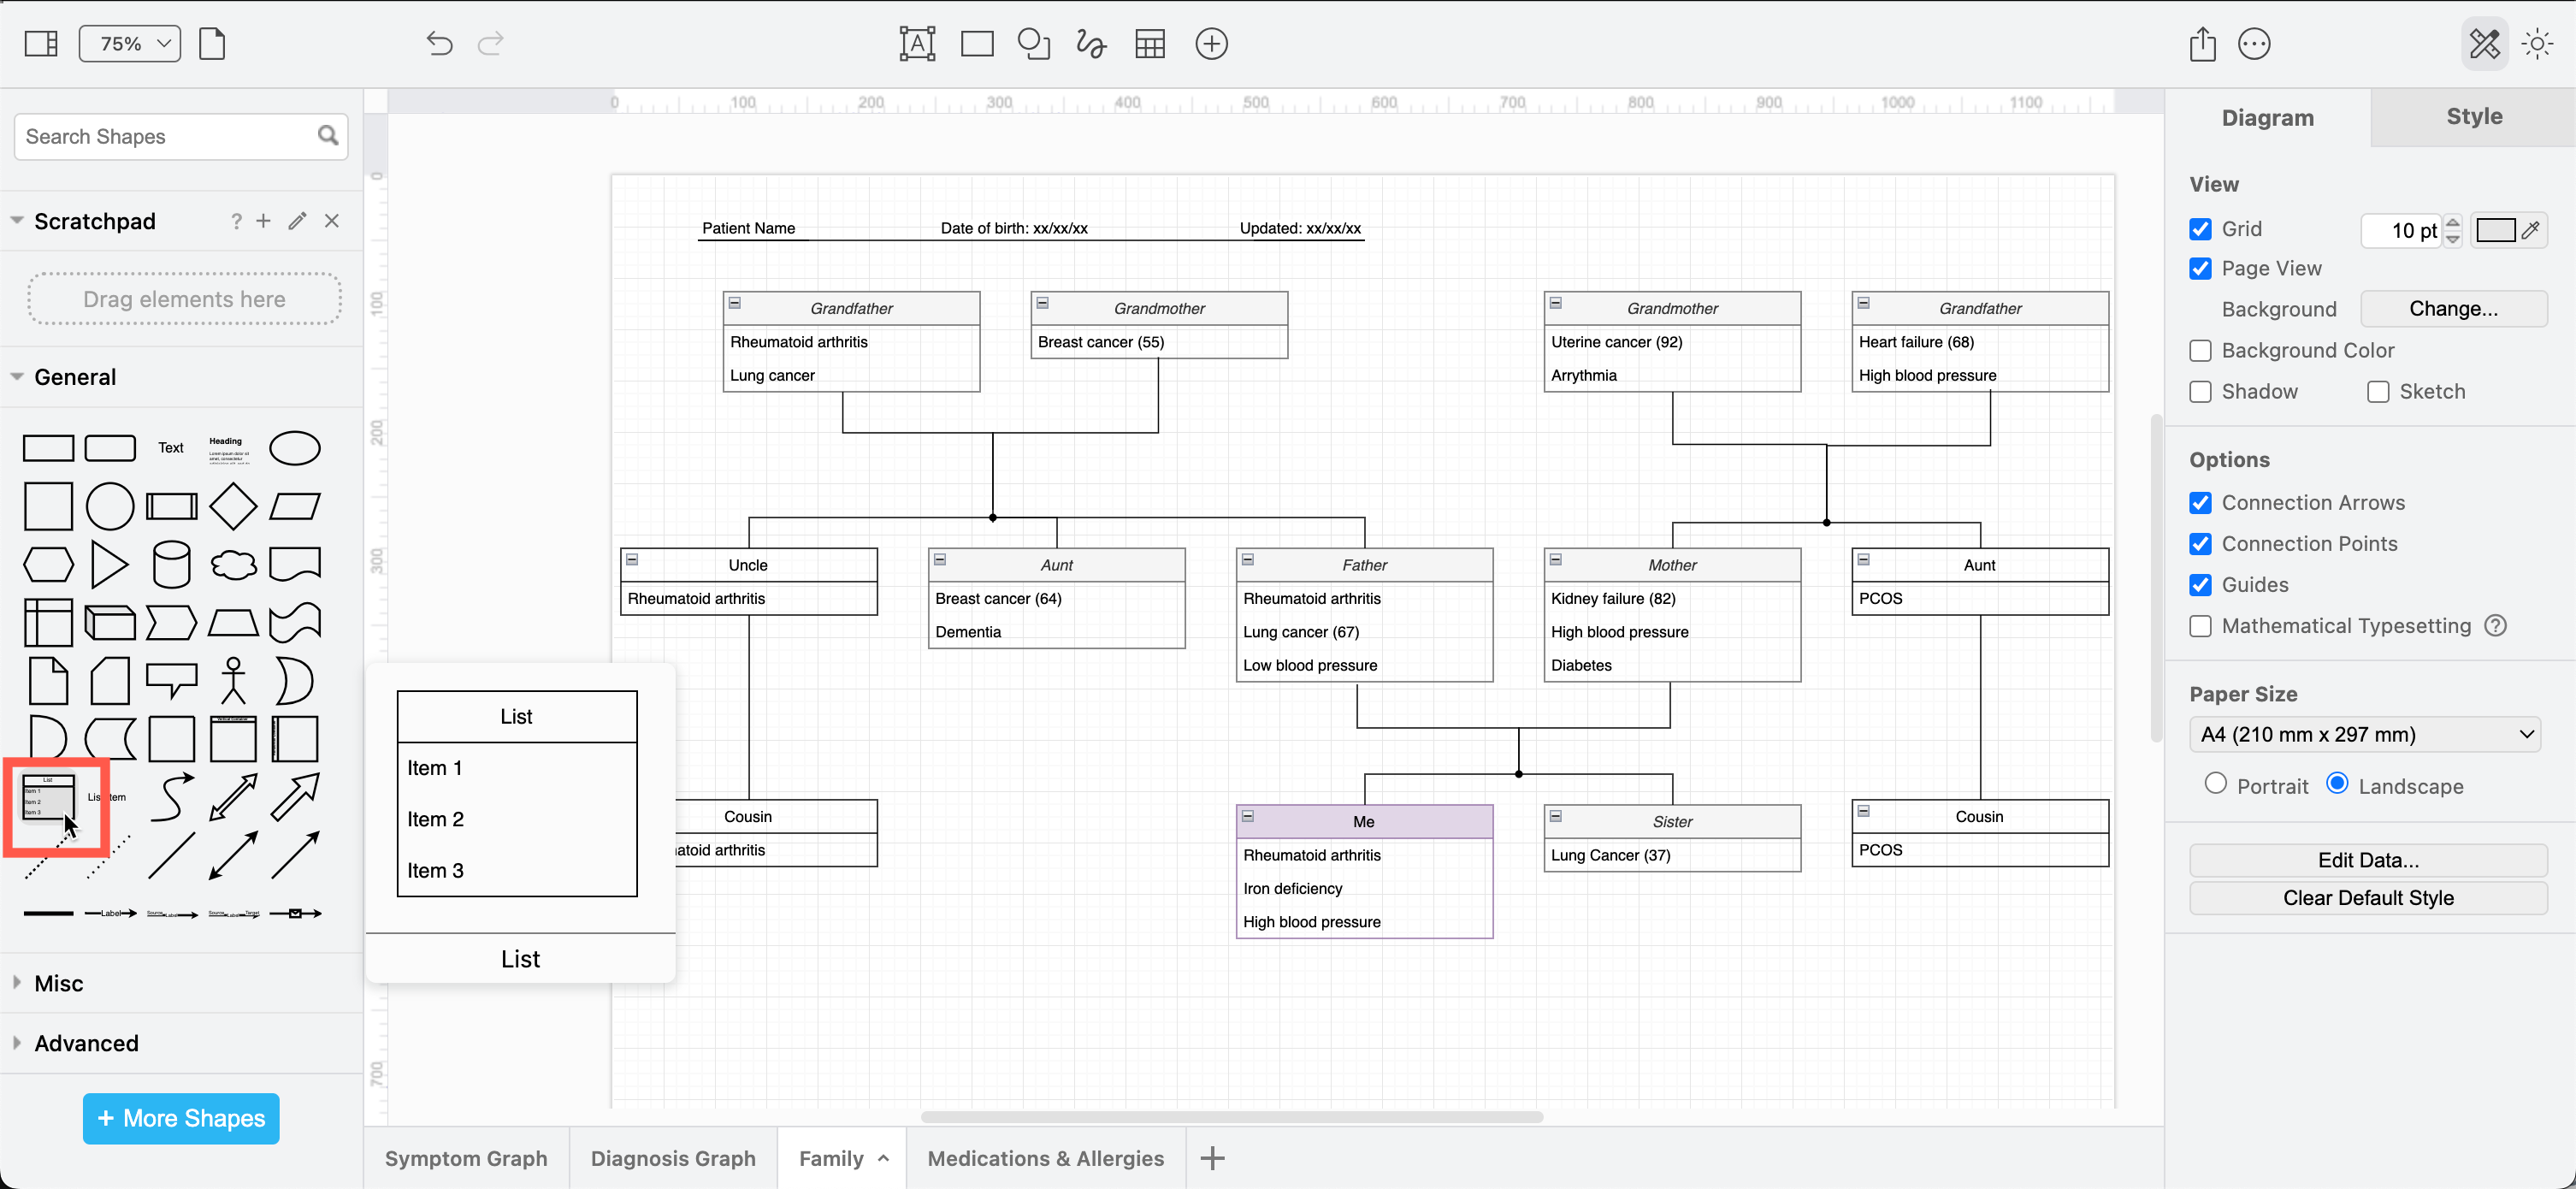
Placeholder shape properties for automatic feature flags

Using container shapes to indicate feature flags, and placeholders on all feature branch shapes can automatically update feature flags tooltips depending on which container they are in.

In this example, a tooltip shape property with a placeholder shows which feature flag container the branch is in when you hover over a shape. Additionally, the shapes used to label the containers also contain placeholder values.

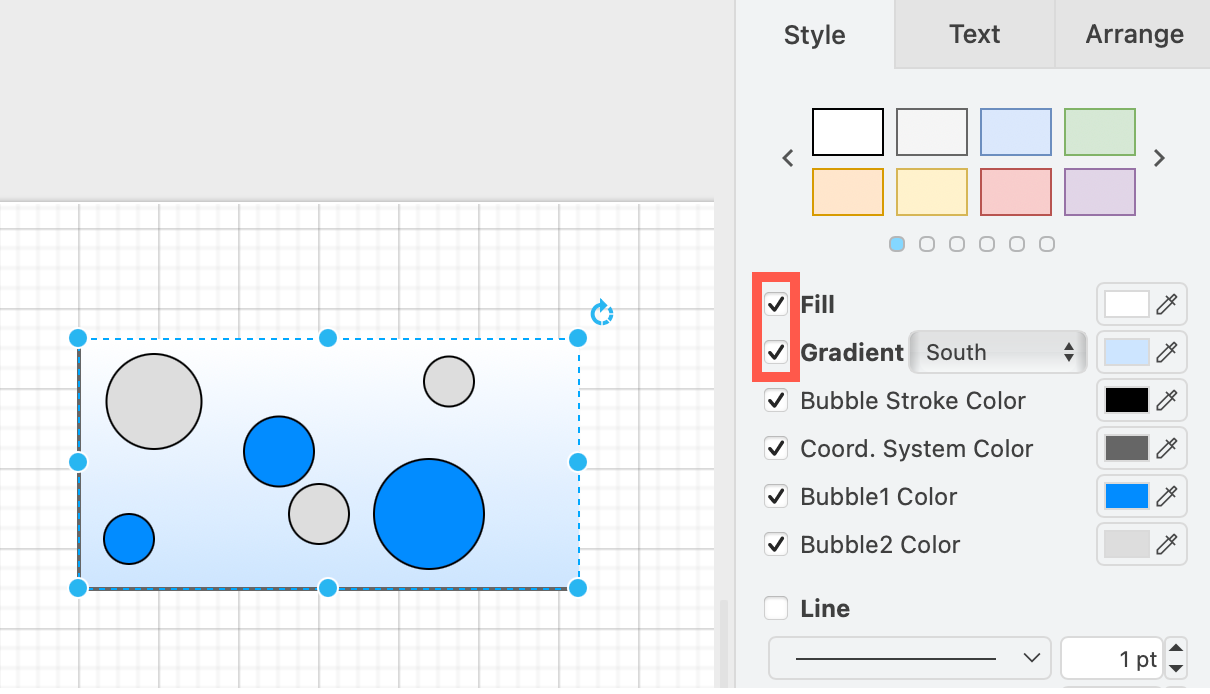
  1. Select the shape that forms the container, expand its Properties in the Style tab in the format panel, and ensure the Container checkbox is selected.
    Make sure the shape for the feature flag is a container
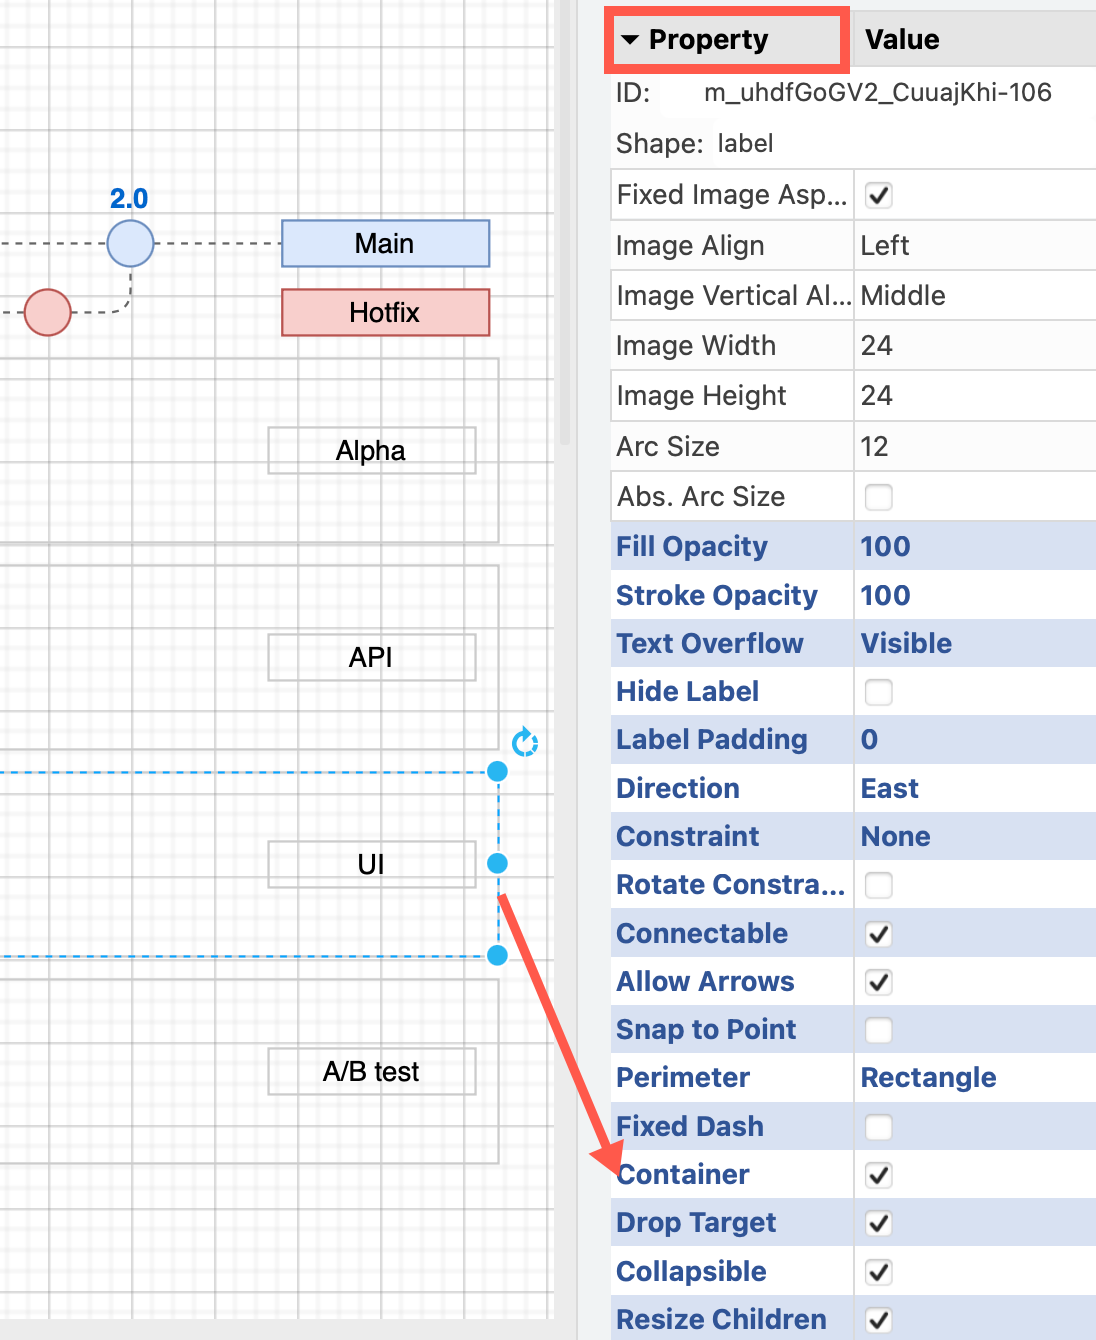
  2. Add the name of the feature flag to a custom shape property in the container shape, and ensure Placeholders is enabled.
    Add the name of the feature flag to a custom property in the container shape
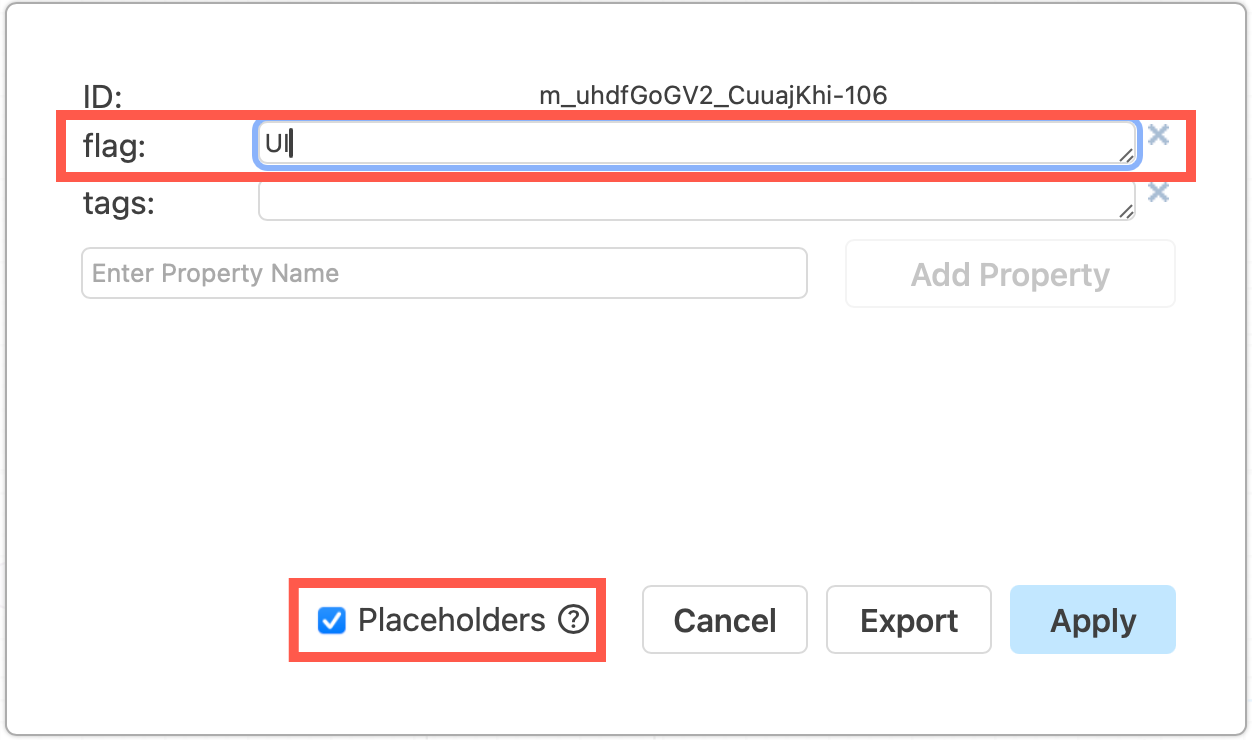
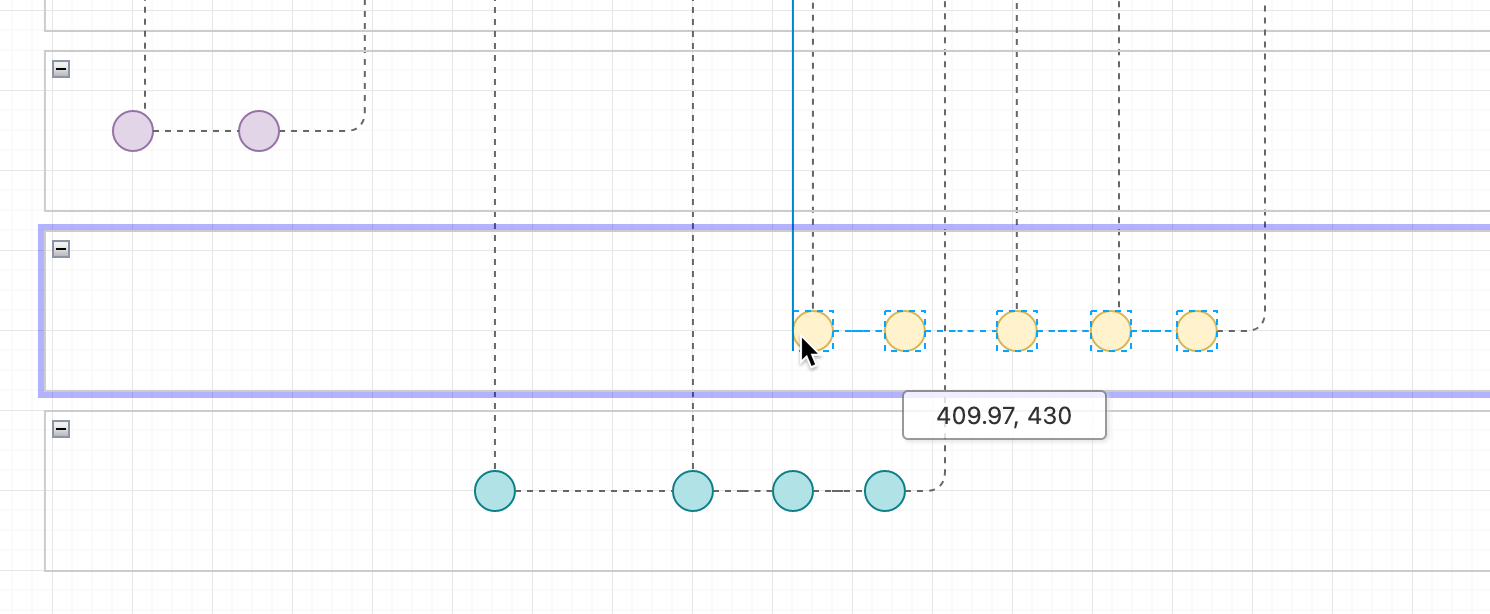
  3. Drag the feature branch shapes into the container shape, and drop them when the outline is purple.
    Add the name of the feature flag to a custom property in the container shape
  4. Edit the shape properties of one of the feature branch shapes, ensure Placeholders is enabled and add the tooltip custom property with the value being the feature flag property you defined in step 2 surrounded with percentage characters: %flag%
    Add placeholders to shape properties to have labels and tooltips update automatically
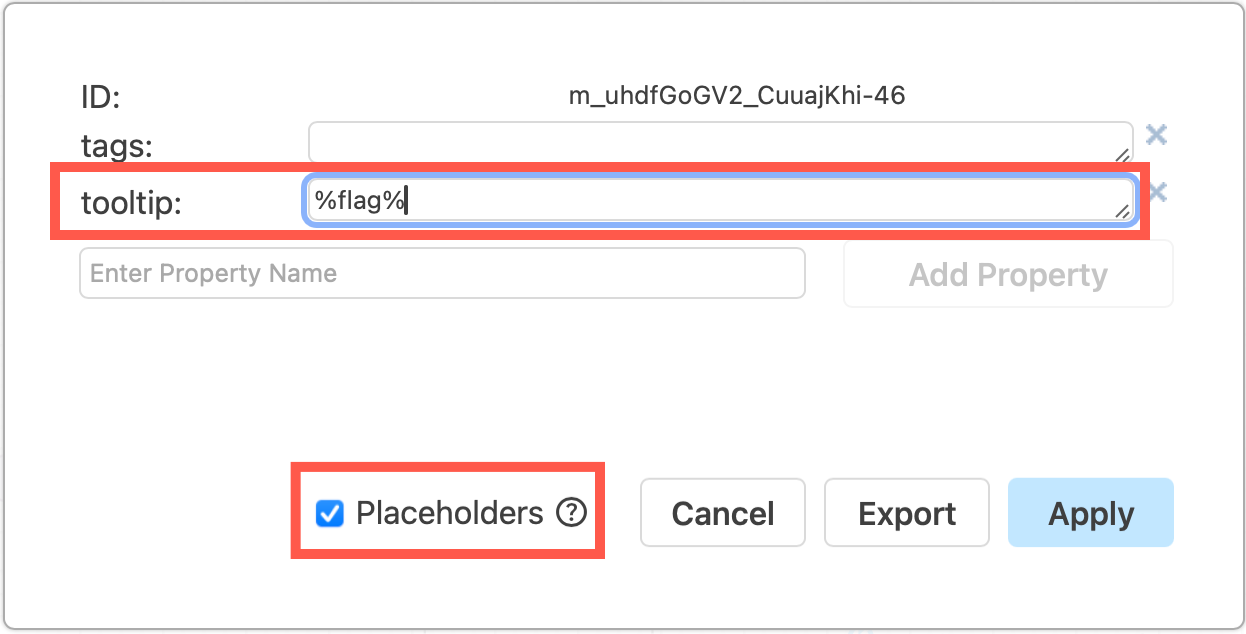
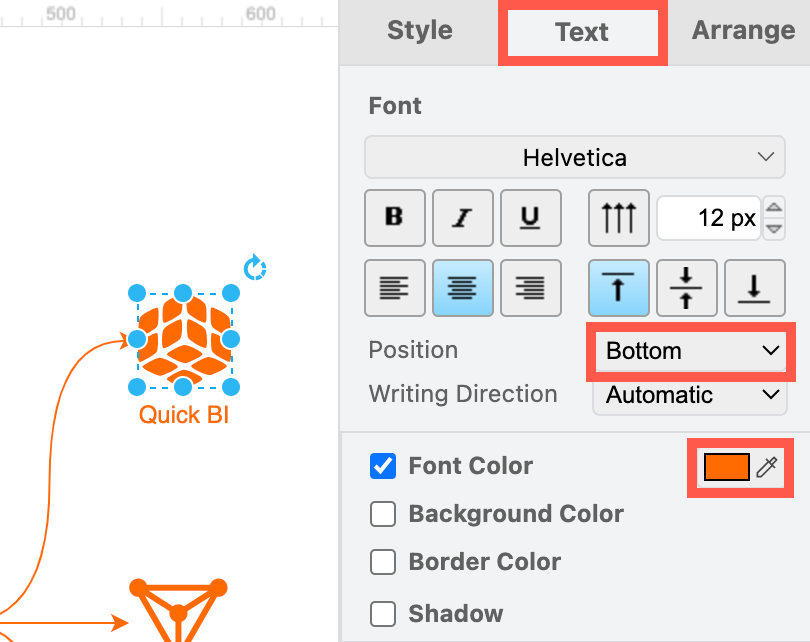
  5. In the shapes used noting the the containers' feature flag, write the same shape property placeholder in the shape labels - e.g. %flag%

Keep in mind that shapes will only be able to have one feature flag if you use this method as placeholders respect scope, where the placeholder (or variable) takes the value of the container in which it is located.
Container shapes for feature flags show clearly which feature branches in the gitflow diagram use each flag, additional labels on the main branch show which feature flags apply to released versions
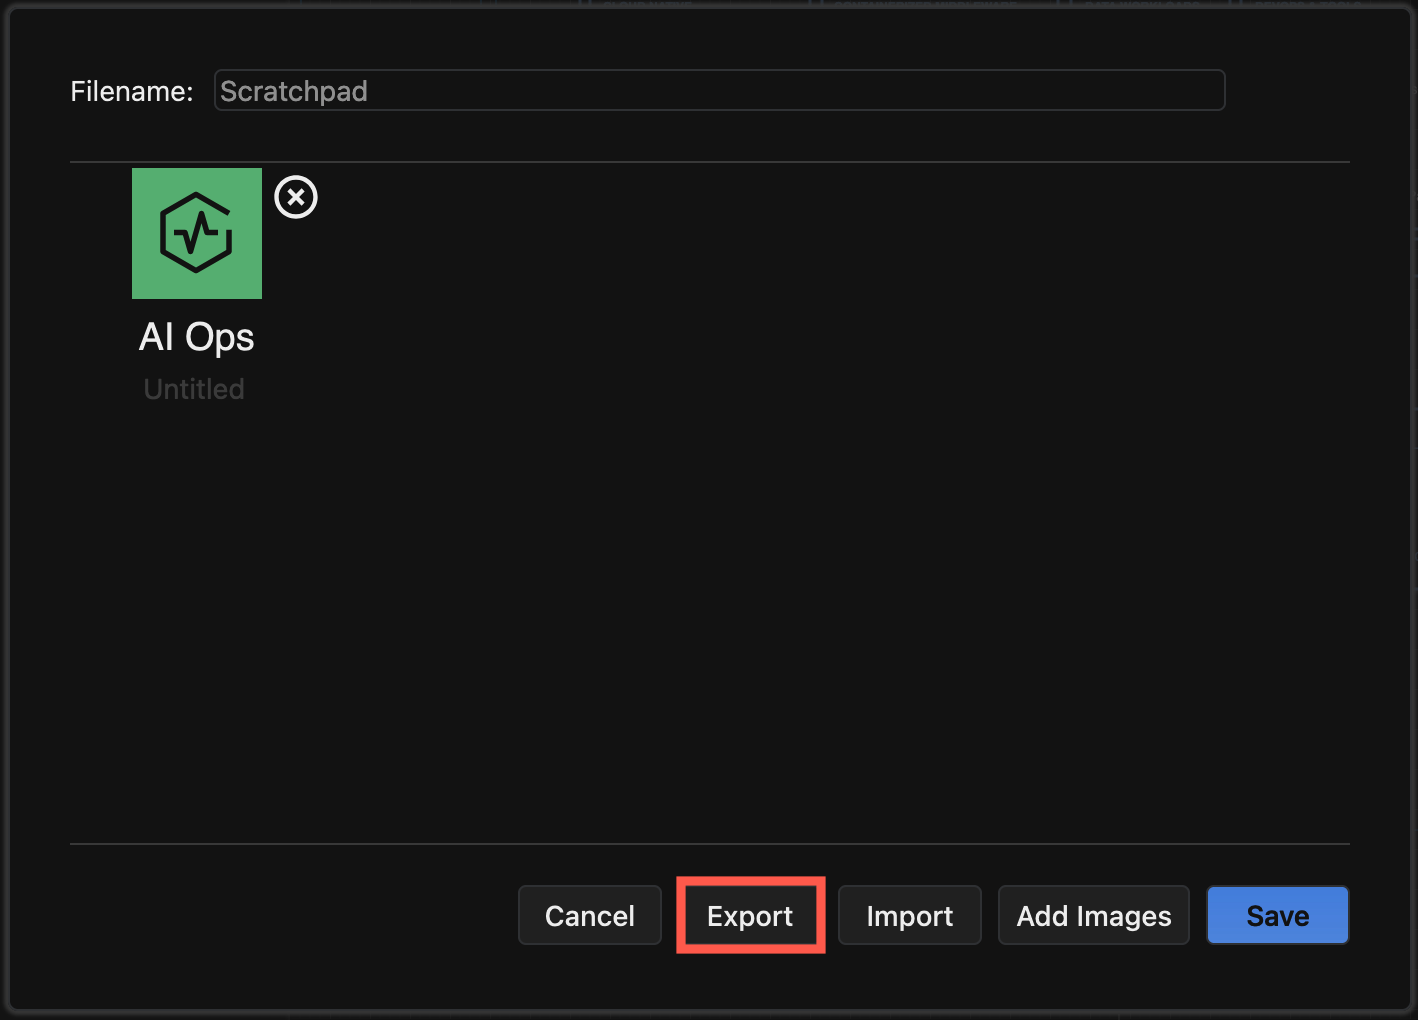
View this gitflow then click on Edit (the pencil) in the toolbar to open it in the editor and see how placeholder feature flags work

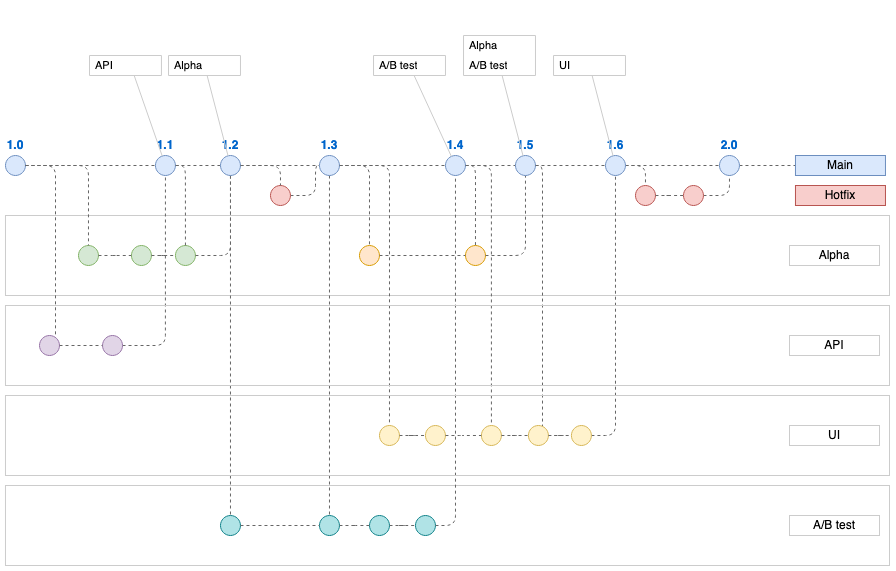
This structure clearly separates branches visually into each feature flag. You can combine this structure with list shapes on the trunk to show which flags apply to the actual release versions.

See how both the tooltips and the shape label changes when we move shapes to another container.
Use placeholders in shape properties and container shapes for feature flags in gitflow diagrams to automatically update shape data when you move shapes to another container

Learn more about placeholder shape properties

Create data-driven diagrams with draw.io

· 8 min read
draw.io
draw.io Team

Using diagrams.net or draw.io together with scripts and data sources, you can create data-driven diagrams, with colours, shapes, text labels and even animations that change to reflect live data.
Update shapes in a diagram based on live data with draw.io, Grafana and the Flowcharting plugin

Aside from live diagrams of cloud network infrastructures, and charts that visualise data in graphs, there are few true data-driven diagrams. As draw.io does not include spreadsheet or graph functionality - it's a diagram editor - dynamically updated charts are not possible.

You can program your own scripts or use integrations with other applications to achieve data-driven diagrams where diagram shapes change to reflect live data because draw.io is open source and the .drawio diagram format uses accessible XML.

How it works

Each shape in a draw.io diagram has a unique shape ID.

Because the diagram data is stored in your file using XML tags, you can use a script to search for the shape ID in the XML source and replace common shape properties with a different value to reflect the data at that time.

What you'll need

  • diagram created in the draw.io editor and saved as an XML file
  • application or script to do the following:
    • display and refresh the diagram
    • query or read the live data
    • analyse the data values and update the shape properties in the diagram according to programmed rules

Example - factory status floorplan

To show you how to build such a data-driven diagram, we'll use an example of a dashboard that shows the status of a machine on a factory floorplan based on real-time sensor data from that machine.

This example uses Grafana and Arnaud Genty's Flowcharting plugin to feed the real-time sensor data recorded in a database to scripts that update the shapes in the diagram based on rules that we define.


Draw your diagram and set it up for data

Create your diagram in draw.io online or one of our draw.io apps.

You can draw any type of diagram - flow charts, wireframes, floorplans, org charts, wiring diagrams, etc.

Avoid using complex shapes for elements you want to update. Those that contain multiple fields, like tables, entity shapes or swimlanes won't typically have unique IDs that you can refer to later.

In this example, we've created a factory floorplan with simple text shapes to show important machine information.
Draw your diagram in draw.io

Set custom unique shape IDs

For each shape that will dynamically update based on a data source, you should override the auto-assigned shape ID to make it easier to refer to later.

  1. Right-click on a shape and select Edit Data. Alternatively, select a shape and press Ctrl+M or Cmd+M.
  2. Hold down Shift and double click on the ID string at the top.
  3. Change the shape ID to something more memorable - make sure it is unique.
  4. Click Apply to save the new shape ID, then click Apply to save the shape data.
    Give each element in your diagram that you want to dynamically update a new, memorable and unique shape ID via its shape data - select a shape and press Ctrl+M

In our example, all of the text shapes that say Text are to be updated. Each has been assigned a new custom unique shape ID.

View the shape IDs in the Properties section on the Style tab.
Check each shape has a unique ID assigned in the Properties section of the Style tab in the format panel

Export your diagram as an XML file

You need to read (and copy) the full XML source of your diagram, so export it as an XML file so it can be easily opened by a text editor.

  1. Select File > Export As > XML from the menu.
  2. Save the file to your local device.

Create a dynamic dashboard

  1. Install Grafana and the Flowcharting plugin.
  2. Configure one or more data sources in Grafana.
  3. Create a new dashboard and add a Flowcharting panel.
    Install Grafana, connect a database and create a dashboard with the Flowcharting plugin - you can add the .drawio diagram in the next step

Add the diagram to the dashboard

  1. Open the diagram .xml file you previously saved in a text editor.
  2. Copy all the diagram data that appears after the initial <?xml ... > tag.
    Open the .xml file in a text editor and copy all of the text that appears after the first XML tag
  3. Now, add the diagram data to the Flowchart panel in Grafana.
  • Set the Editor URL & Theme to our online service at embed.diagrams.net, and select Dark or Light from the drop down list. If you run your own draw.io server, use its URL instead.
  • Set the Source Type to XML.
  • In the Source Content text field, paste the diagram data you copied from your text editor.
    Add the diagram data to the Flowchart panel in Grafana

The diagram will appear in the dashboard preview panel.

Map diagram shape IDs to data queries with rules

Now, you need to link the diagram shapes you want to update, with queries of a data source and rules defined in the Flowchart panel.
Map the diagram shapes you want to dynamically update to data using rules in the Flowchart panel in Grafana

  1. Write the queries to extract the data you need from your data sources. Set the name of the metric to the diagram shape ID that it updates so it's easier to see which query updates which shape.
    Update the name of each metric to match the diagram shape ID that it updates for ease of understanding
  2. Set the behaviour in the Mapping section for each query.
    • Set Identify by to ID as that is how we identify a specific shape.
    • Enable Regular expression and add some rules. In the What field of the rule, enter the specific shape ID for the shape you want to update.
      Set up the rules for each of the shapes you want to update based on data query values
      The shape label is Active or Stop based on the latest database value.

Refer to the Flowcharting mapping documentation if you need help with this step.

You can change the colour or tooltip of the shape, its text label or link, or add an animation.

Now, when your dashboard runs and your data queries are updated, your diagram will update according to the rules you have set.

Update shapes in a diagram based on live data with draw.io, Grafana and the Flowcharting plugin

More data-driven diagram examples

  1. Select one of these live examples of diagrams in the Flowcharting plugin.
  2. Expand the title and select Edit to see how it is set up.
    Have a look at a live example of a draw.io diagram used with the Flowcharting Grafana plugin

Updated shapes for GCP and AWS network diagrams

· 4 min read
draw.io
draw.io Team

You can create network diagrams from scratch in draw.io using shapes that match the platform you are using - AWS, GCP, Veeam, Azure, Cisco, IBM and many more. Both the draw.io AWS19 and GCP Icon shape libraries for network and cloud architectures have been updated recently.

Open the updated network shape libraries

Both the Amazon Web Service and Google Cloud Platform shape libraries have been updated recently. Enable the shape libraries that you need to use in draw.io.

  1. Click on More Shapes in the left-hand panel.
  2. In the Networking section, click on the checkboxes next to the libraries you want to enable, then click Apply.
    Enable the AWS19 shape library for Amazon Web Services infrastructure diagrams in draw.io

If you want to see the shape names even when you aren't hovering over a shape in the shape libraries, click on the Labels checkbox in the shape library selection dialog.

Hover over any shape in the shape libraries on the left of the drawing canvas to see a preview and its name.
Hover over any shape to see a preview and its name in draw.io

Drag the shape library panel edge towards the drawing canvas to expand the panel and see more shapes.
Drag the edge of the shapes panel to make it larger

Updated AWS19 network shapes

Enabling the AWS19 shape library will give you a large number of sub-libraries in the left panel, sorted into logical categories. Expand the categories that you need by clicking on the sub-library's title or the arrow next to it.

As you can see below, the AWS19 shape library for modelling cloud service architectures on Amazon's platform is large and varied.
The AWS19 shape library for Amazon Web Services infrastructure diagrams has been updated in draw.io

Create a new diagram with the AWS19 shape library already enabled

Updated GCP Icons

The large Google Cloud Platform shape library containers older labels and icons, whereas the updated GCP Icons are sorted into their own shape library. Click More Shapes and enable the GCP Icons library to see updated sub-libraries shown below.
The GCP icons shape library for Google Cloud Platform infrastructure diagrams has been updated in draw.io

Create a new diagram with the GCP Icons shape library already enabled

Some cloud visualisation platforms can output diagrams in the .drawio format, including Cloudcraft and Cloudockit.

Embed the exported diagram in your system documentation or display it in your wiki with one of our draw.io integrations.

Network diagram templates

draw.io includes many templates for common cloud infrastructures on several platforms. Select Arrange > Insert > Template from the menu.
Network diagrams in the templates at draw.io

Reviews from real draw.io users

· 3 min read
draw.io
draw.io Team

The barrier to anyone diagramming and whiteboarding with draw.io is lower compared to many other SaaS applications. From reviews and customer feedback, some of the things they like the most include:

  • you don't need to register and it costs nothing
  • you can diagram in all major operating systems
  • there is an offline desktop version
  • you can give your diagram to anyone else and they will be able to load and edit it freely
  • you can store unlimited diagram files wherever you prefer
  • project development is in the open and anyone can take part

But don't take our word for it - here is what draw.io users are actually saying on popular review sites.

On Capterra

Capterra verifies reviewers through LinkedIn and checks their reviews for a range of fraudulent activity and credibility. They are one most popular software review sites for businesses.

draw.io review from real users on Capterra


draw.io review from real users on Capterra


draw.io review from real users on Capterra


draw.io review from real users on Capterra

See more draw.io reviews on Capterra

On GetApp

GetApp has monitored software trends for the past 10+ years, and collates reviews on its site from a number of other trusted platforms.

draw.io review from real users on GetApp


draw.io review from real users on GetApp

See more draw.io reviews on GetApp

On G2

The G2 company gathers user reviews of software products from their own community, and aggregated data collated from various other social and online sources, with more weight given to recent reviews.

draw.io review from real users on G2.com


draw.io review from real users on G2.com

See more draw.io reviews on G2

Thank you to our reviewers

Useful as these reviews are, we don't actively monitor review sites regularly - if you have a suggestion or want to report a bug, please go to the the support page on the Github project. That is best place to get our attention.

Create a remote kanban board with draw.io

· 7 min read
draw.io
draw.io Team

Kanban boards show the breakdown of large projects into smaller tasks that you prioritise and track as they are completed. Collaborative projects benefit from a kanban board as it helps everyone visualise workflows, the state of the project, and the current workload.
The kanban template in draw.io automatically updates colours and labels when you move tasks to another column

The Kanban method or system is commonly used by project and production managers, agile and system developers, designers and content marketers. Almost all areas of a business can use this method to track work, identify bottlenecks, and improve processes.

You can draw remote kanban boards in draw.io in many different ways - you don't have to use the simple kanban template as shown above. You can use simple sticky note shapes over coloured rectangles, list elements, or entity table shapes - whichever you find most convenient.

Create your kanban board in draw.io using simple shapes, lists, entity tables or the simple kanban template

However, the simple kanban board template in draw.io will automatically colour tasks based on the column (the swimlane or state) they are in, and update the label text accordingly.

Using the kanban board template

Insert the simple kanban template

  1. Select Arrange > Insert > Template from the draw.io menu to see the template library.
  2. In the Basic library, select the Kanban template, and click Insert.
    The kanban template in draw.io automatically updates colours and labels when you move tasks to another column

You aren't limited to just three columns in your kanban board. This template uses a custom shape property on the swimlane (column) to set the label text, and the swimlane's fill colour for the tasks.

Add and move tasks

  1. Hover over one of the tasks in a column to see the direction arrows, then click on it. A new task will be added in that direction with a copy of the previous task label.
  2. Double click on the new task and edit their task name
    Tip: Don't edit the %status text - learn more about this placeholder in the section below.
  3. Drag tasks from one column to another to change their state and show where they are in your workflow.
    The kanban template in draw.io automatically updates colours and labels when you add tasks or move them to another column

Delete a task: Select the task, and press Delete or Backspace.

Vote and prioritise on the kanban board

Teams can work remotely and collaboratively on their kanban board diagrams, add links to external sites or documents, add and link to other diagram pages, and vote on priorities.

Vote on tasks or set task priorities by placing pins or other simple shapes on your kanban board in draw.io
  • Hold down Alt to overlay shapes on the kanban board, such as when prioritising or voting on the next tasks to implement.
  • To make your kanban board more readable, select all of the voting/pin shapes, go to the Arrange tab on the format panel, and click To Front to make sure they will be visible on top of your tasks.

Tip: Right-click on the drawing canvas and share your mouse cursor with your team in real-time with draw.io for Confluence Cloud, as well as in draw.io when storing shared diagram files in Google Drive or Microsoft OneDrive.

Add a new column to the kanban board

  1. Select a column (one of the swimlanes) and hover over one side to see the direction arrows.
  2. Click on the direction arrow to add a new column in that direction.
    Add a new column to the kanban template in draw.io

Delete a column: Select the column (swimlane), and press Delete or Backspace.

Change the colour of the tasks in a column

Task colours are automatically set to match the swimlane's fill colour.

  1. Select the column (swimlane), then in the Style tab of the format panel, click on the Fill colour button.
    Change the colour of the tasks in a column to the kanban template in draw.io
  2. Select a new colour from the palette, and click Apply.

Change the status text in the task label

As you saw in above, the status text in the simple kanban board template is a placeholder. When you select the text in one of the tasks, you'll see the word status surrounded by percentage characters: %status%.
Placeholders are used to set text automatically in the simple kanban template in draw.io

The text that replaces this placeholder is set in the swimlane's custom properties.

  1. Select the column (swimlane), then press Ctrl+M on Windows or Cmd+M on macOS to open the shape properties dialog.
    Placeholders are used to set text automatically in the simple kanban template in draw.io
  2. Change the status text, and click Apply.

Note: The title of the column is not set automatically. Select the column and start typing to replace the column's title.

Learn more about custom properties and placeholders

Embed your kanban board

The many different draw.io integrations let you use your kanban boards with the tools you use.

Embed your kanban diagram wherever you are working: HTML pages, VSCode and GitHub projects, Google Workplace and Microsoft Office documents and slides, Atlassian Confluence, Notion pages, and more.

See the draw.io editor embedding walkthrough if you want to embed your kanban board and the draw.io editor in another application.

Kanban in a simpler diagram editor

Use the Minimal or Sketch editor theme, with the editor grid turned off to make your kanban board feel more like sticky notes on a whiteboard. Use the draw.io Board macro in Confluence to use the Sketch editor theme by default.
Use the Minimal or Sketch editor themes in draw.io to make your remote kanban board feel more like a whiteboard
Open these examples in the minimal draw.io editor