
17 posts tagged with "use-cases"

View All Tags

Work with entity relationship table shapes in draw.io

· 7 min read
draw.io
draw.io Team

Entity relationship diagrams or ER models in software engineering show the structure of and relationships between database objects. They are used extensively in database modelling to plan new systems, and document existing systems for maintenance and updates.
Use the basic entity relationship diagram template as your starting place
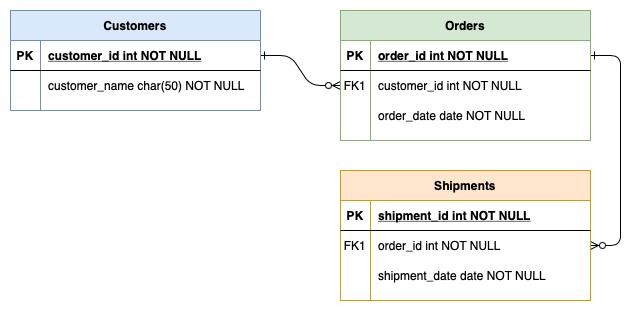
Open this ER model in the draw.io editor

In draw.io, entity relationship diagrams have their own shape library, and use the new extended table tools in the Arrange tab of the format panel. These tools and keyboard shortcuts let you quickly add and delete rows from your relational database model.

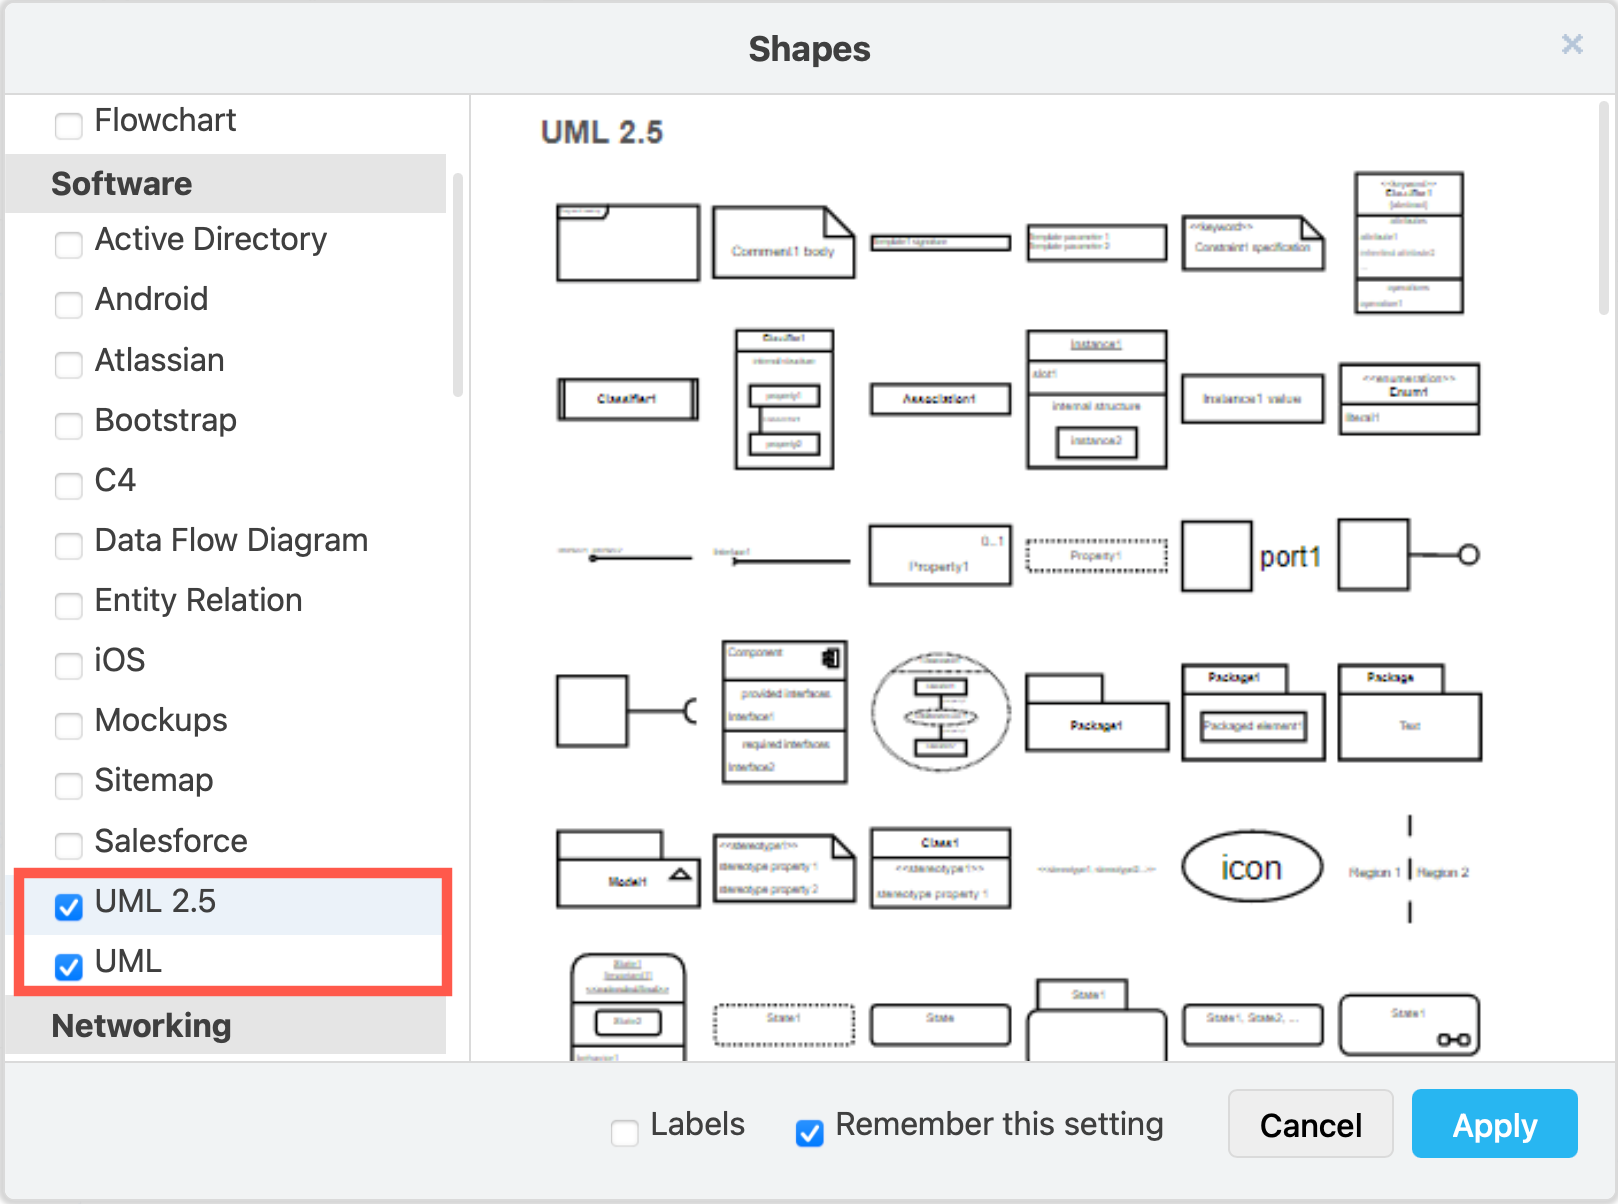
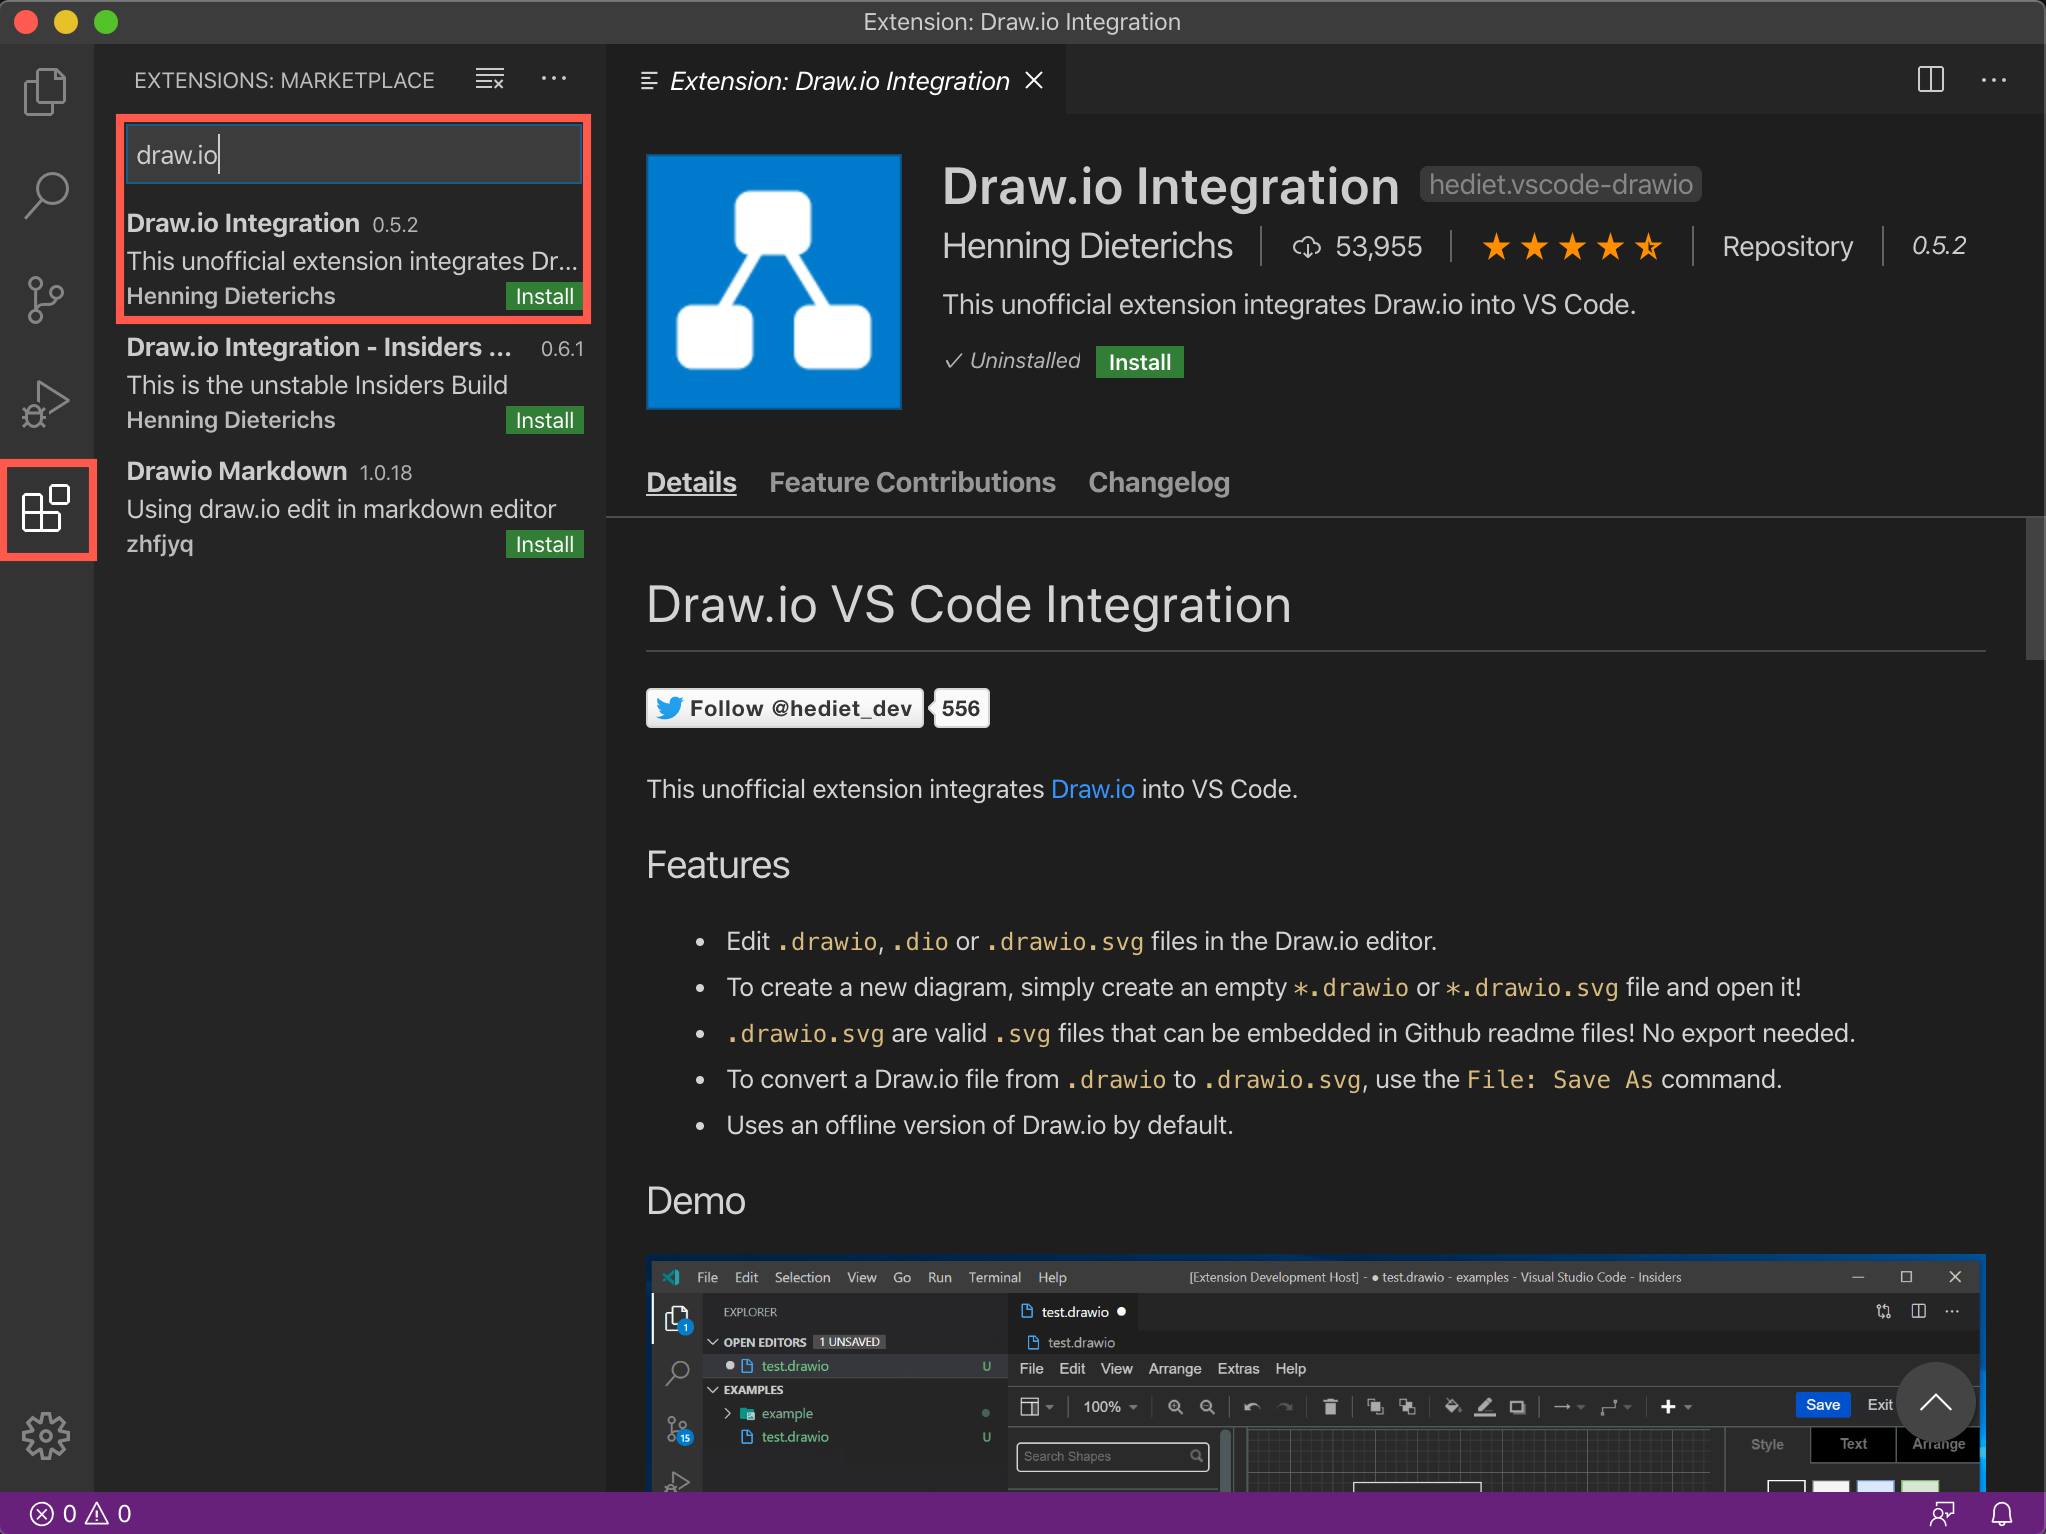
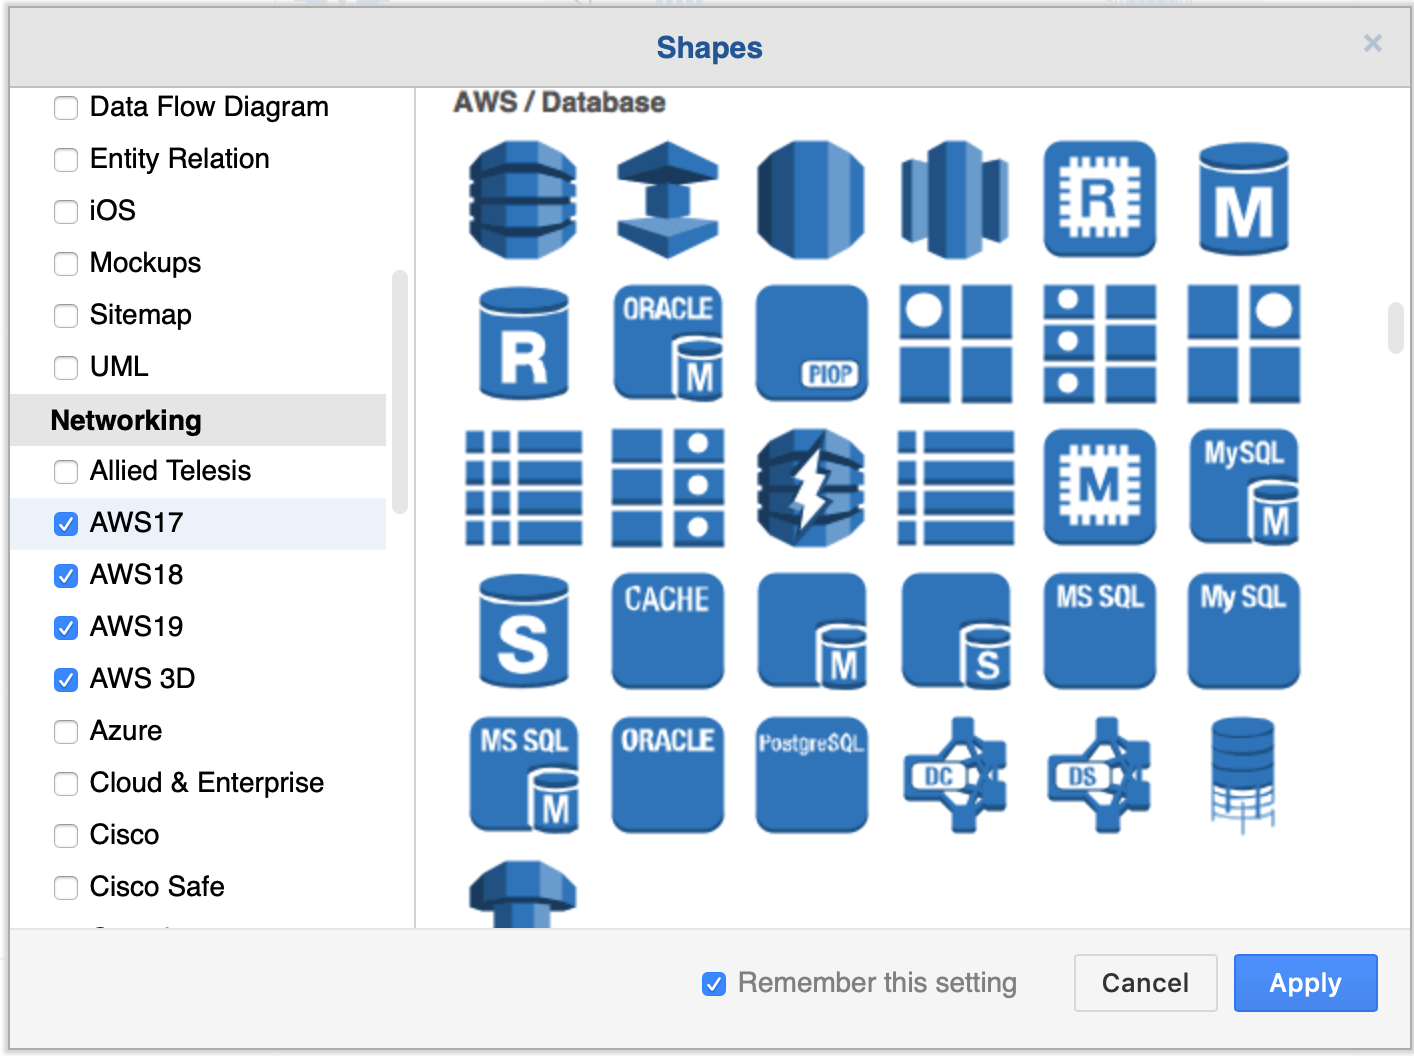
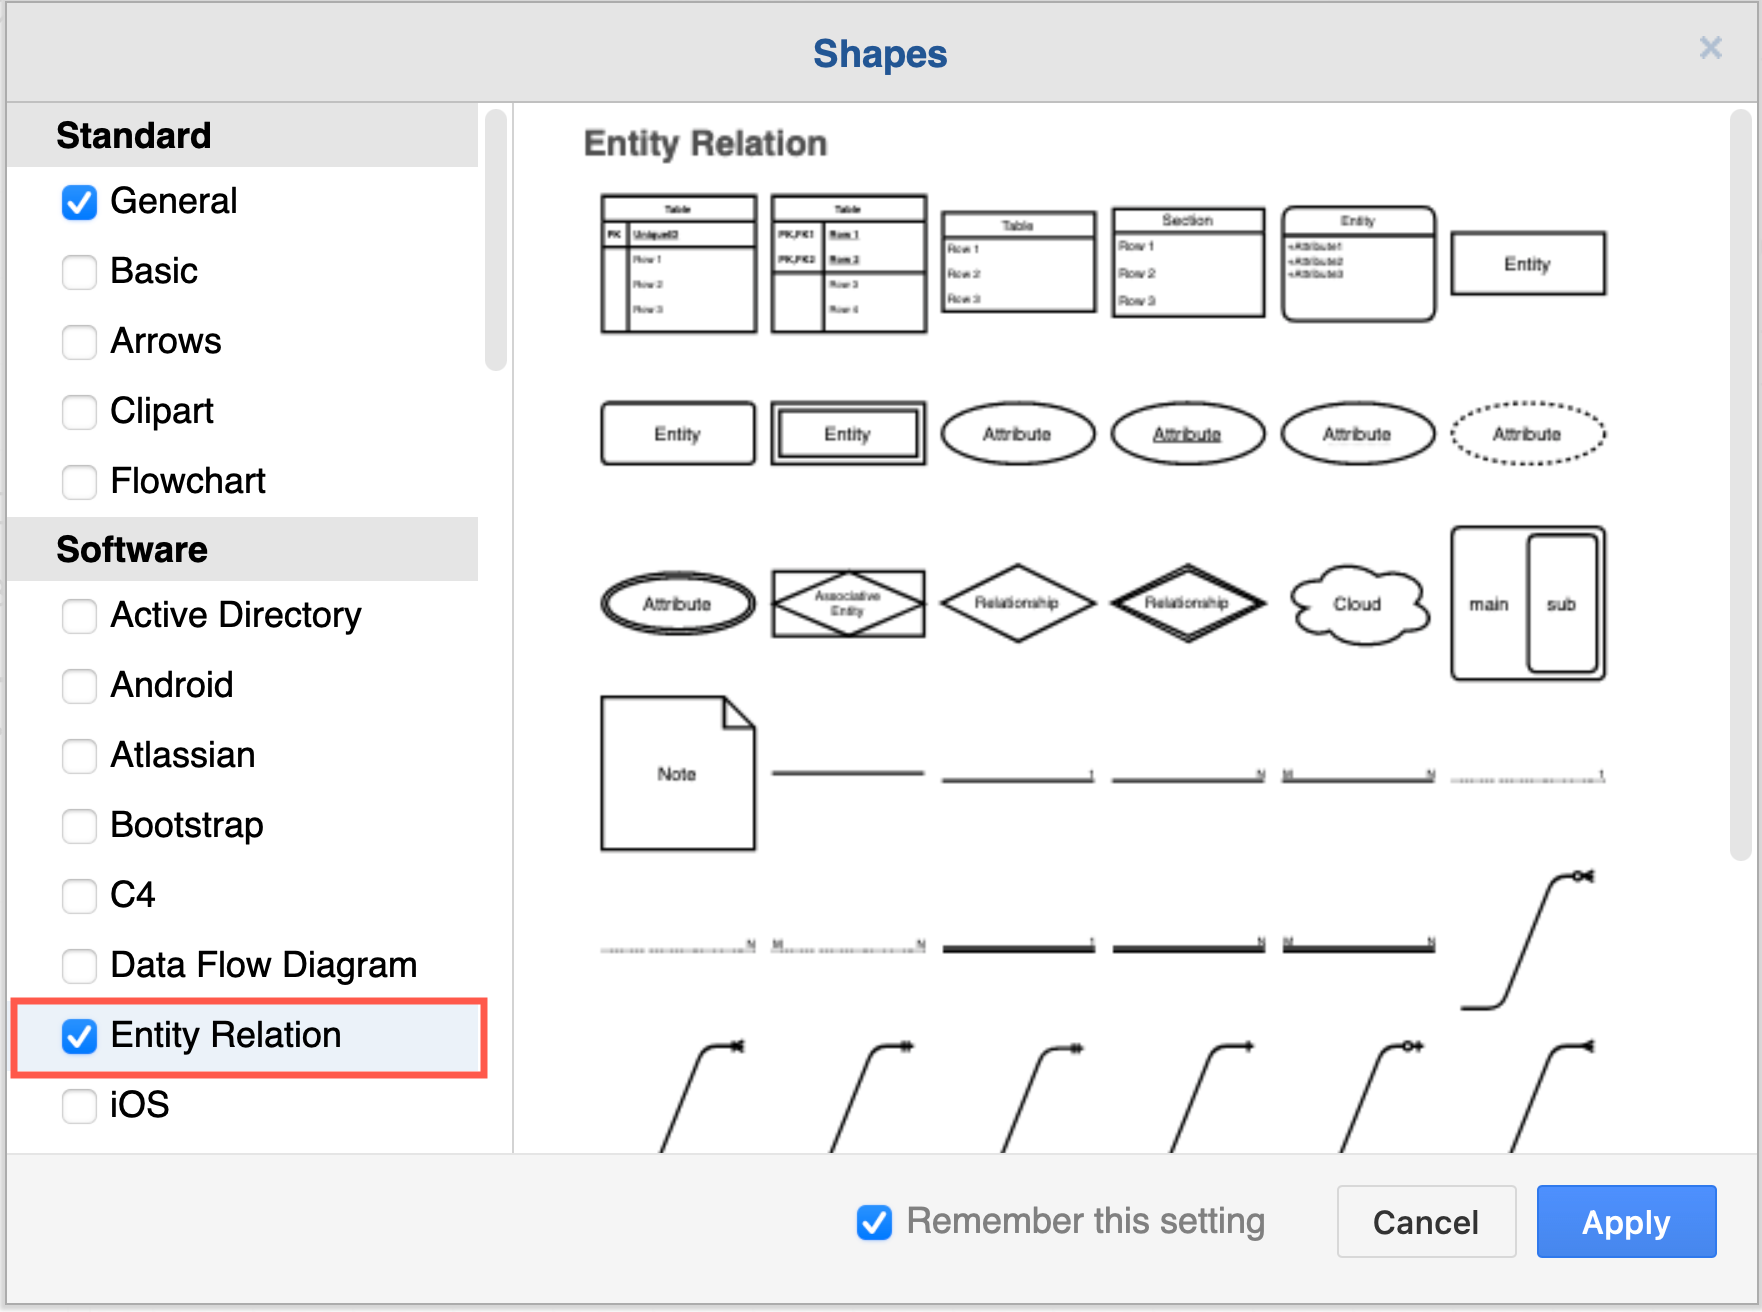
Enable the Entity Relation shape library: Click on More shapes at the bottom of the left panel, select the Entity Relation shape library in the Software section and click Apply.
Enable the Entity Relation shape libary via More shapes in the left panel in draw.io

If you prefer to work from a template diagram, see the end of this post to access one of the many ER diagram templates in draw.io.

Select a row inside a table: Click on an entity once to select the entire table. Click a second time, this time on a row inside that table, to select that cell within the row. Click a third time to select the entire row.

Add a row to a table or ERD table shape

There are many ways you can add new rows to your entity table shape in draw.io.

  • Add a blank row: In the Arrange tab of the format panel, click the Insert Row After or the Insert Row Above button. If you had selected the entire table shape, a blank row will be inserted at the end or at the start of your table, otherwise it will be inserted before or after the selected cell.
  • Add a row from the shape library: Drag a row (with or without a primary or foreign key) from the Entity Relation shape library and drop it on an existing entity (highlighted in purple*).
  • Clone a row: Select a row, and press the keyboard shortcut Ctrl+Enter on Windows or Cmd+Enter on macOS to insert a clone of the selected row immediately below. The Ctrl+D/Cmd+D keyboard shortcut or right-clicking on the row and selecting Duplicate from the context menu work in the same way.
  • Move a row from another entity: Drag a row from one existing entity and drop it on another, just as you would a new row from a shape library.
    Add new rows to entity tables in an ER model in draw.io many different ways

Tip: To reposition rows inside the table shapes, simply drag them to a new position.

Combine entity relationship tables and delete rows

When you want to reorganise your database entities, you can drag and drop an existing table onto another table shape to combine all of their rows. The primary key and foreign keys may not make sense after this, so make sure you delete any unnecessary rows.

  1. Drag and drop one table onto another table.
  2. Select the extra primary and foreign key rows and click the delete row tool in the Arrange tab of the format panel on the right. Just pressing the Delete key will delete the row's content, but not the row itself.
    Combine entity tables and delete rows in an ER model in draw.io

Tip: When you fully delete a row that has a connector attached to it (rather than just delete its contents), the connector is automatically deleted.

Connect to entity tables or rows

Some people prefer to connect primary to foreign keys across entities in an ER diagram to better show which elements are related. Use the connectors in the Entity relation shape library to show what type of a relationship exists.

  • Drag a connector end and hover over the entity's name to add a floating connector to the outside of the table shape. You can move rows around inside the table without moving the connector.
  • Drag a connector end and hover over a row inside the entity table, and drop the connector when the row is highlighted to connect it to that row. When you move that row, the connector will stay attached to it.
    Draw floating connectors between entity tables, or connect them directly to rows inside the table

Tip: You can either set the ends of the connectors using the style tab, or use the connectors in the Entity Relation shape library. Hover over the connector shapes in this shape library to see which relationship they represent.
Hover over a connector in the Entity Relation shape library to see how it is used to show a relationship

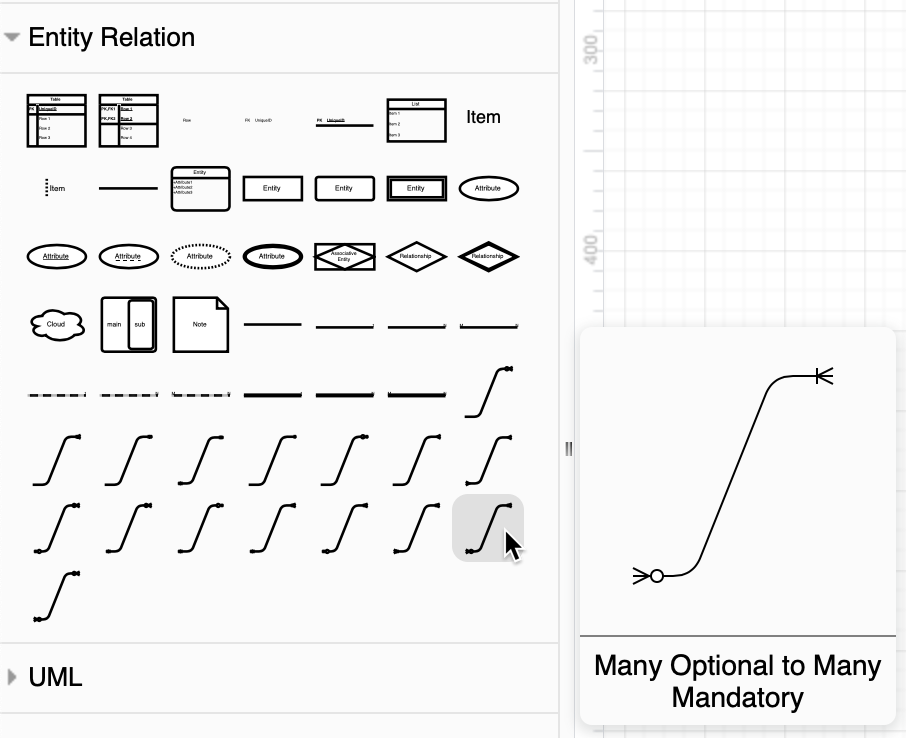
There are various notations you can use for the connector ends. The most common is crow's foot notation.

Work from an ER diagram template

When you create a new diagram, you can choose from a wide variety of templates, including many different entity relationship models. You can also insert one of these templates into an existing diagram.

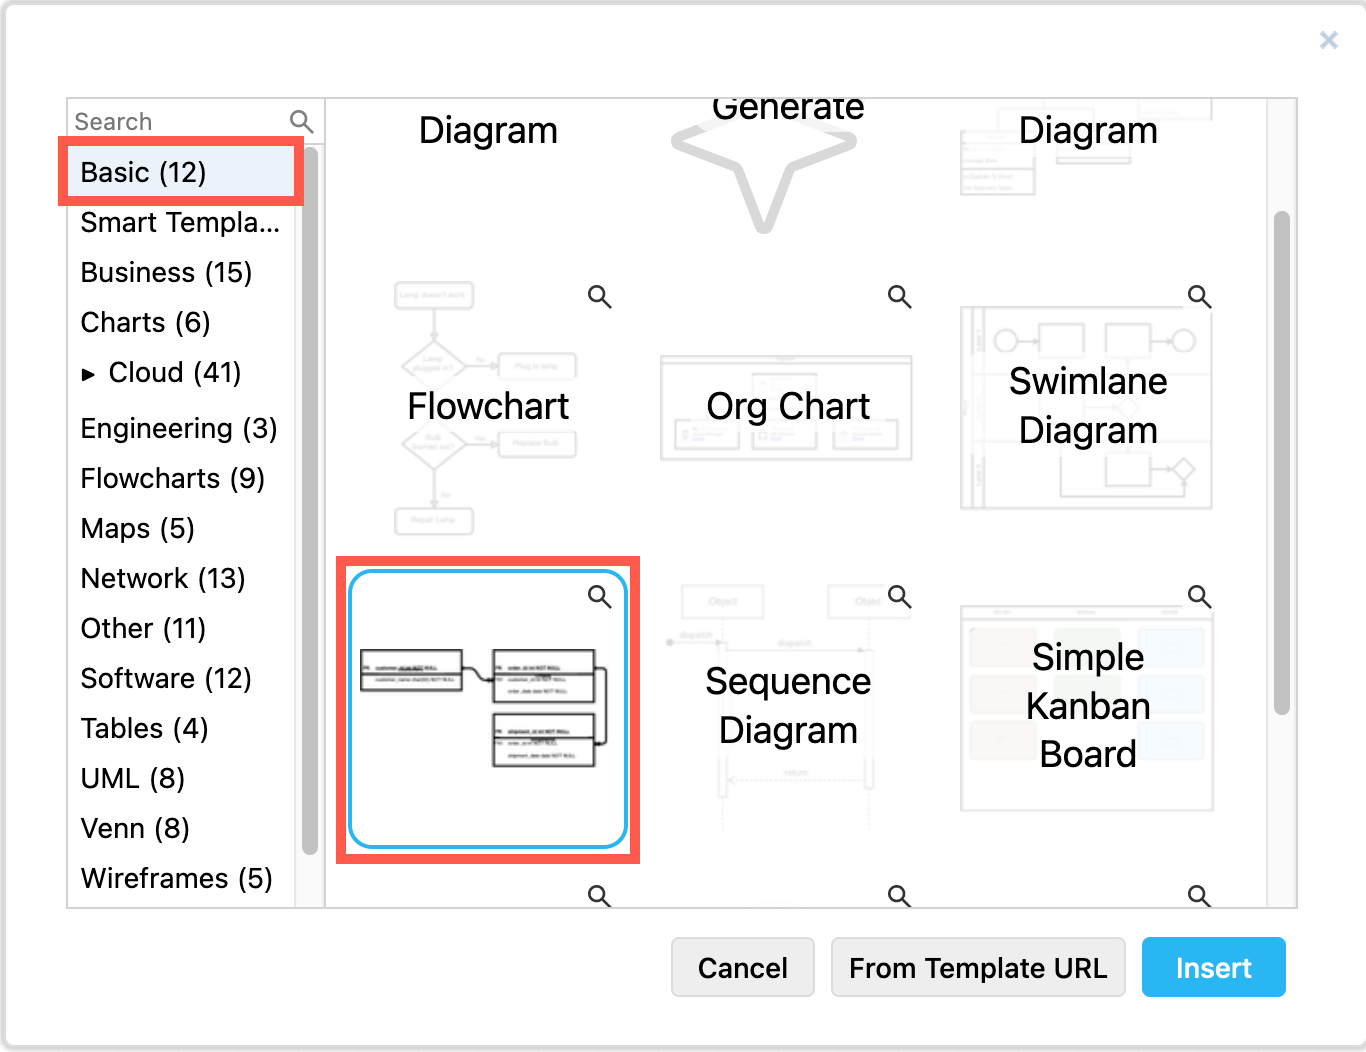
Select Arrange > Insert > Template from the draw.io menu to open the template manager.

There are two categories of templates containing ER diagrams:

  • Select Basic, then select the simple Entity Relationship Diagram template for a simple model with three tables.
    Select the basic Entity Relationship Diagram template in the draw.io template manager
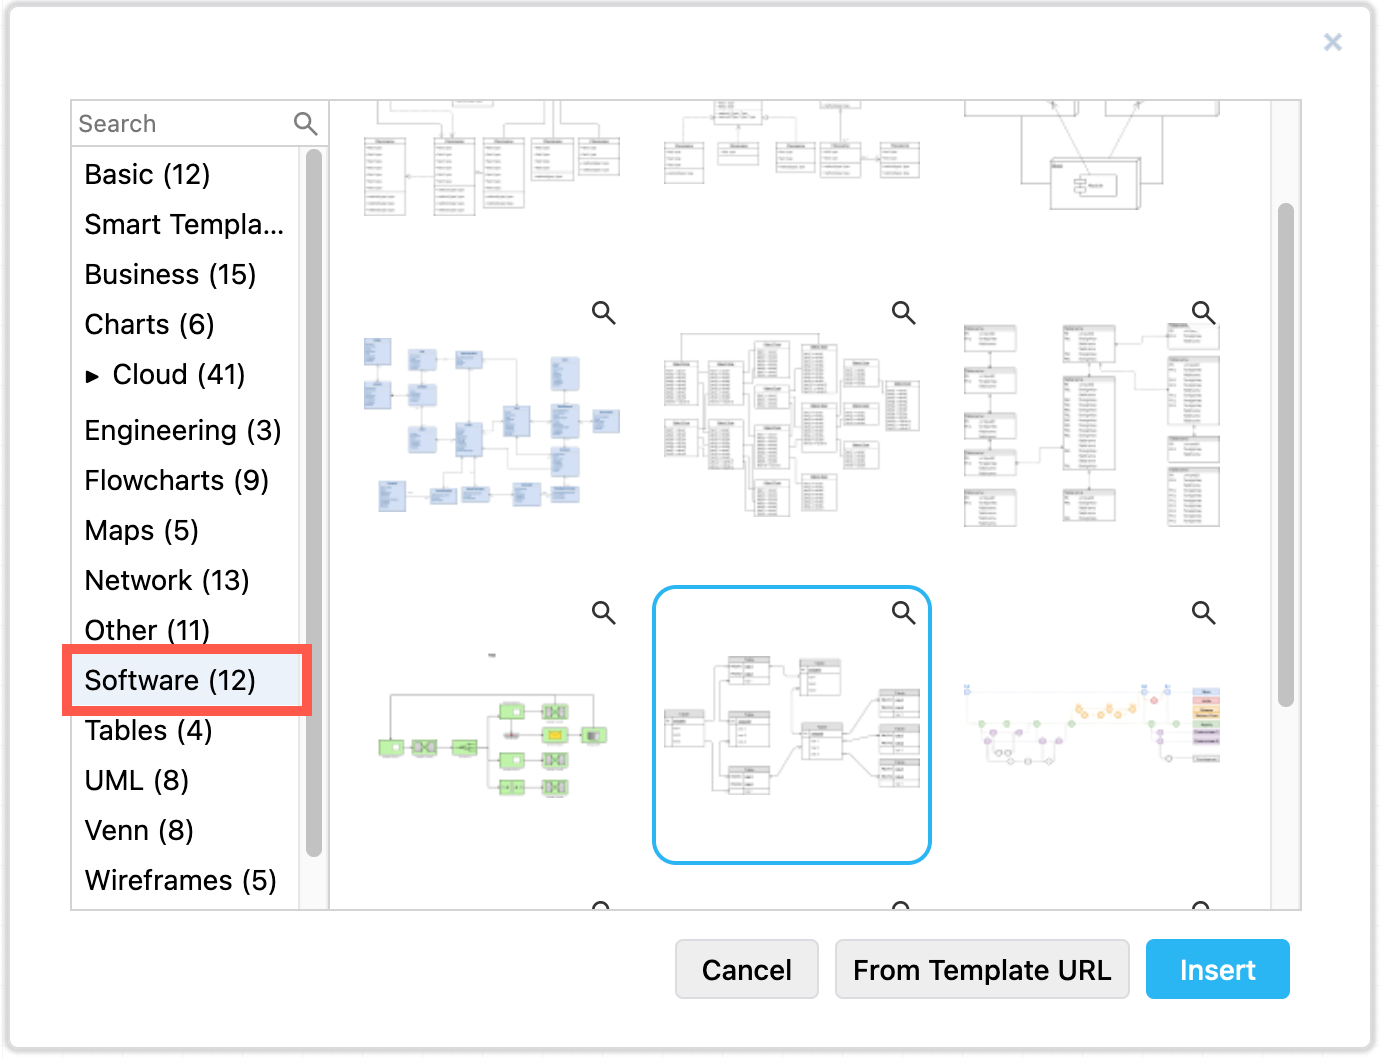
  • Select Software, then choose one of the many different example ER diagram templates. These are much more complex than the basic ER diagram template. Click on the magnifying glass icon in the top right of a template to see a larger preview.
    Select one of the many more complex entity relationship diagrams in the Software section of the draw.io template manager

Generate a custom smart template

You could also generate a custom smart template diagram based on a text description of your system and process.

  1. Open the template library (Arrange > Insert > Template) and select Smart Templates.
  2. Select Entity Relationship Diagram from the list of diagram types.
  3. Describe your system and process and click Generate.
    Generate a custom template from a text description in the Smart Templates section of the draw.io template manager
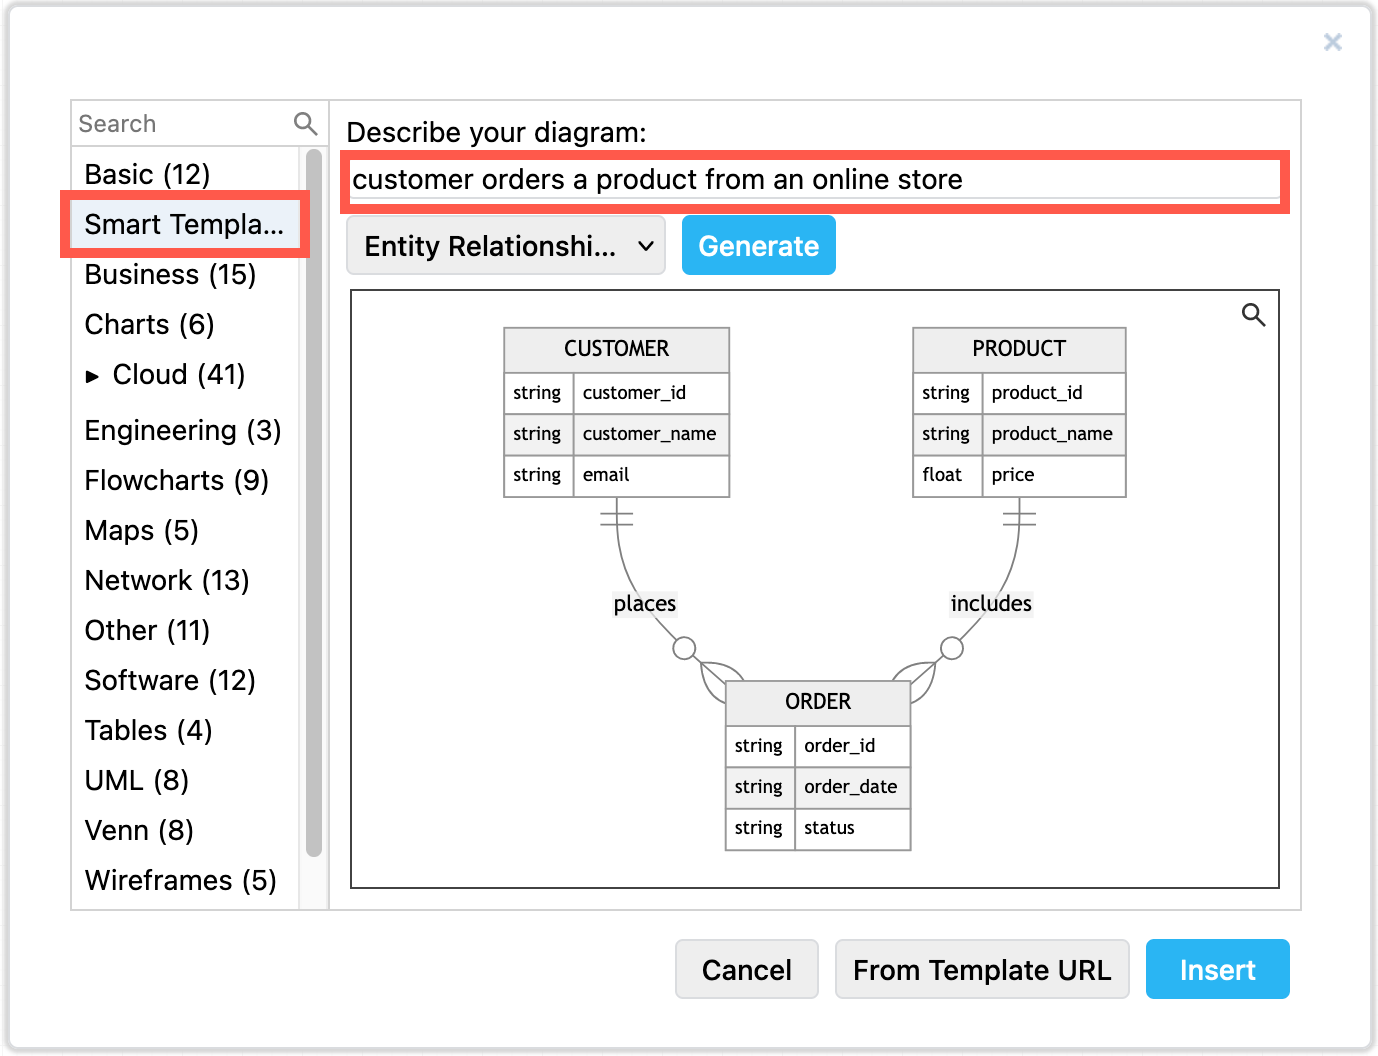
  4. If you are happy with the generated smart template, click Insert or Create to add it to the drawing canvas.

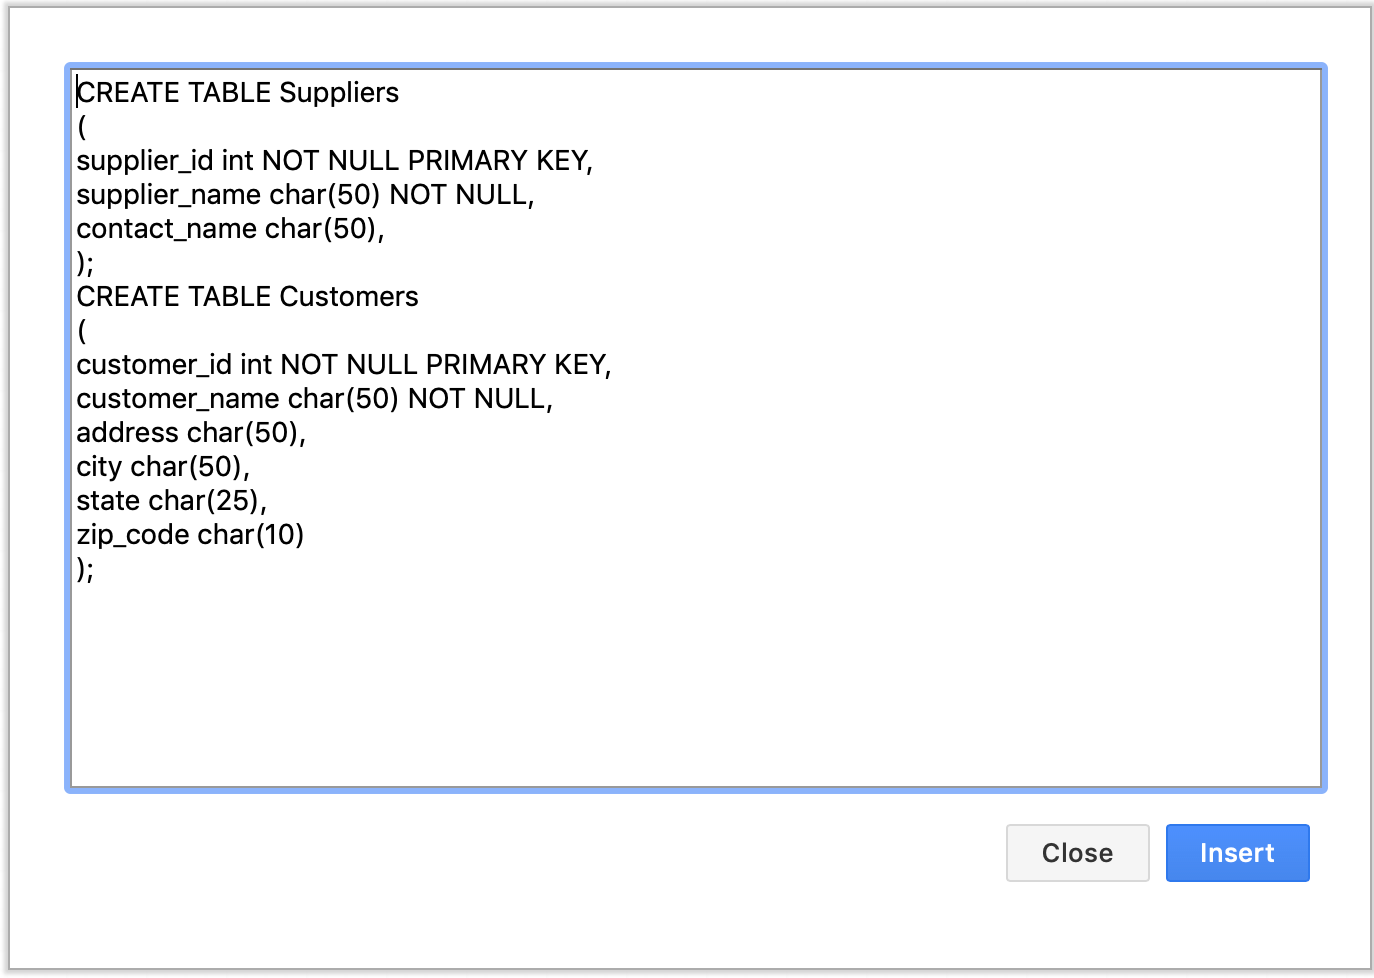
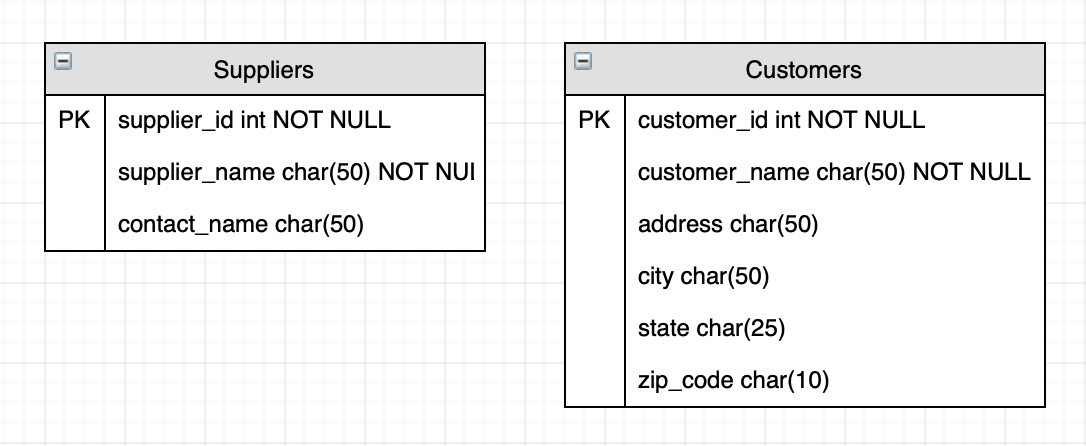
Create entity table shapes from SQL code

You can insert SQL code to create your entities automatically. Once you've inserted the code and generated the entities on the drawing canvas, all you need to do is draw the connectors between them to show their relationships. This is useful for modelling existing relational database systems.

Insert SQL code then click Insert to create an ER diagram automatically Entity shapes are automatically created based on your SQL code

UML 2.5 shape library with updated shapes

· 5 min read
draw.io
draw.io Team

The Unified Modeling Language (UML) is a set of standard symbols and diagram types, commonly used in data modelling, workflow visualisation, and system modelling. UML notation is the defacto industry standard in the fields of software development, IT infrastructure, business systems and other fields. Many languages, such as SysML, SoaML, and a number of architecture frameworks use and extend UML.
Activity diagrams are used to model workflows in various ways

The UML 2.5 specification updated the notation, or the shapes used in diagrams so they could represent a wider range of concepts more clearly. The specification document was extensively rewritten to make it easier to understand.

No new diagram types were added in UML 2.5 - the 14 diagram types that were previously defined in UML 2.0 are extended to cover the additional concepts, with many examples provided in the specification document.

UML diagram types

UML diagrams are divided into two categories that provide you with static (structural) and dynamic (behavioural) views of a system.

Diagram types defined in UML 2.5
Open this in our free diagram viewer

Enable the UML 2.5 shape library

  1. Click on More Shapes at the bottom of the left panel in draw.io, scroll down and click on the checkbox next to the UML 2.5 shape library in the Software section. You may want to also enable the UML shape library. Then click Apply.
    Enable the UML 2.5 shape library, and the older UML library if you wish to use those shapes
  2. The UML 2.5 shape library will appear in the left panel.
    The shapes in the UML 2.5 shape library let you create clearer and more extensive UML diagrams of many types

Using these shapes, and some of the shapes from the General and older UML shape libraries, you can create the full range of UML diagrams.

Example UML diagrams

Click on a diagram below to open in our diagram viewer

Component diagrams show the dependencies between the logical and physical components of a system with the interfaces that each component requires and provides and their ports.

Component diagrams show the dependencies between the components of a system.

Composite structure diagrams are used to show the internal structure of a classifier, with its properties, parts and relationships, or how a collaboration behaves. You can break down the behaviour of a collaboration into one or more specific situations (occurrences) in a collaboration or collaboration use diagram.

Composite structure diagrams are used to show the internal structure of a classifier

Deployment diagrams shows the system infrastructure and how various software executables and artifacts are deployed on deployment targets.

Deployment diagrams shows the system infrastructure and how various software executables and artifacts are deployed on deployment targets.

Activity diagrams are used to model workflows in various ways. In this example, the workflow actions are arranged into swimlanes representing the actors, with a section that allows an interrupt (exception) to cancel the order.

Activity diagrams are used to model workflows in various ways

Embed a diagram in GitHub markdown

· 4 min read
draw.io
draw.io Team

You can use a versioned diagram in a GitHub README file in a number of different ways, and include links to edit the diagram or use it as a template for a new diagram.

You can also use GitHub as the storage location for your diagrams, even if you don't plan to display them in the README files.

The integration with GitHub to display and edit diagrams uses the draw.io editor's embed mode, where the storage of the diagram is taken care of by a host application (GitHub), and where our online editor (app.diagrams.net) is used for diagram editing.

Embedded diagrams and diagram editing in Github support the following file formats: .png, .svg, .html and .xml (default)

Embed a diagram in GitHub wiki markdown

  1. Save your diagrams as editable .png or .svg images.
    • When editing your diagram, select File > Export as > PNG or File > Export as > SVG and make sure the checkbox for Include a copy of my diagram is selected.
  2. In your GitHub markdown, include these images as normal, with or without alt text. For example: ![Alt text here](images/someimage.png)

Embed editable diagrams in GitHub wiki pages

View this example of diagrams in a GitHub wiki page

Edit a diagram in a GitHub README

Using the file edit-diagram.html, available from our GitHub repository, you can enable developers with appropriate access to edit the diagrams embedded in Github markdown pages.

The edit-diagram.html file interfaces with GitHub and uses draw.io in embed mode allowing you to edit and save diagrams stored in a repository. The following URL parameters are required: user, pass, repo, path, ref and action=open.

Use action=open, and pass the user and pass parameters to create links that let your developers immediately edit diagrams. Your link will look similar to the following.

http://jgraph.github.io/drawio-github/edit-diagram.html?repo=drawio-github&path=diagram.png

Use links to edit diagrams directly when they are stored in a GitHub repository

View this GitHub README file with embedded editable diagrams

Use a diagram in GitHub as a template

Pass the diagram as a URL parameter to the draw.io editor at app.diagrams.net to use the diagram stored in GitHub as a template. Your link will look something like the following:

https://app.diagrams.net/#Uhttps%3A%2F%2Fraw.githubusercontent.com%2Fjgraph%2Fdrawio-github%2Fmaster%2Fdiagram.png

Embed a self-editing SVG image in GitHub markdown

You can display an SVG file with embedded PNG data (to support Internet Explorer users who are unable to use foreignObject). The SVG file combines an image format that you can include in markdown with <img src="..." />, with scripting for GitHub integration.

To edit such a 'self-editing' SVG image, you need to build a link like the following:

http://jgraph.github.io/drawio-github/self-editing.svg

Use HTML as a container for self-editing diagrams

You can build a 'self-editing' HTML file with embedded diagrams, using nanocms.js for the GitHub interface and diagram editing functionality, as well as Bootstrap and nanocms.css for CSS styling. HTML can be used in this way with diagrams in a number of formats, including inline SVGs containing links.

Go to the following example of a self-editing HTML file containing diagrams

Use this example for self-editing HTML with diagrams to see how to implement this in GitHub

Create diagrams directly in VS Code

· 3 min read
draw.io
draw.io Team

Diagrams make coding go a lot smoother, especially when you are programming in teams. Having diagrams version tracked and right with the code they reference, and version tracked similarly in your code editor saves you time. You don't have to exit your workspace to switch to an external tool, or have to export/import every time you want to update a diagram.

Henning Dieterichs has created a third party diagramming integration for the VS Code editor that lets you do exactly that. Now you can create .drawio diagrams using the draw.io editor without leaving your code editor.

At the moment, you can create and edit .drawio, .dio, or .drawio.svg files, with .drawio.png file support under development. The diagram editor extension is bundled with the VS Code editor so you can code and diagram offline.

This is possible because draw.io is both open source, and supports being embedded in other applications.

See the full list of third-party integrations

Install the VS Code integration

  1. In the VS Code editor, click on the Extensions section in the left panel.
  2. Search for draw.io.
  3. Click Install on the Draw.io Integration created by Henning Dieterichs.
    Install the diagramming extension in the VS Code editor to create .drawio diagrams

Create a new diagram in VS Code

Create a new file as usual in the VS Code editor, and make sure the file extension is .drawio. A new blank diagram will be shown in the embedded diagram editor.

Edit a diagram within VS Code

  1. Open the folder in which you have stored your diagram, then select the diagram file.
  2. The diagram will open in right-hand pane. Resize the panes to get a larger diagramming area if required.
    Open and edit a diagram in the VS Code editor

Change the diagram editor to use a different theme

The diagram editor automatically uses the dark theme in the VS Code editor to match its default dark theme. You can change this easily.

  1. Select Preferences > Settings in the VS Code menu.
  2. Search for theme on the Settings page.
  3. Under Extensions, click on Draw.io integration, then select a new theme from the drop-down list. Learn more about the draw.io.
    Change the diagram editor theme via the VS Code Settings
    You can use a different diagram editor theme within the VS Code editor

Use Cloudcraft to export your AWS architecture to a .drawio diagram

· 4 min read
draw.io
draw.io Team

Using Cloudcraft, you can securely connect to cloud environments and infrastructure components via your architecture diagrams where statistics, resource information and more is updated in real time. The 3D isometric view that Cloudcraft uses is familiar to engineers and IT staff as it often matches the tools they learned on. The automatic updates driven from your company's live systems makes Cloudcraft a fantastic tool for monitoring your AWS cloud infrastructure. The statistics are also helpful to estimate costs when you want to make changes to your system.
Examples of Cloudcraft infrastructure diagrams exported to draw.io

Get started with your AWS infrastructure using the Amazon Architecture Center's training section and the reference architectures.

AWS architecture documentation also needs to be static

To document how your AWS infrastructure changes over time, you need snapshots - diagrams before and after you make changes. You can't use a live system to document what happened in the past. This is especially important to comply with audit and security standards, and to show progress on your IT infrastructure projects.

Export the various stages of your AWS infrastructure's development into static diagrams. You can easily share these diagrams, open and edit them in draw.io, incorporate them into official documentation and reports, and store them in your revision control system to ensure compliance and painless audits.

Cloudcraft makes it easy to export to draw.io.

How to export from Cloudcraft

Note: Please allow pop-ups in your browser.

In your Cloudcraft account, in the top right of the drawing area, click Export > 2D export to draw.io

Export AWS infrastructure from Cloudcraft

The draw.io version of your AWS architecture will open in a new tab in your browser. You can now save this diagram file to your version control system, cloud storage platform, or whichever location you have chosen to maintain a record of your infrastructure.

Exported 2D IoT AWS infrastructure from Cloudcraft into draw.io

When exporting to draw.io, Cloudcraft may not use the most recent AWS shapes in your diagram, but it's easy to update your diagram to the newest AWS shapes yourself.

Editing AWS diagrams in draw.io

First, enable the AWS libraries. Click More Shapes at the bottom of the left panel, enable one or more AWS libraries under Networking, then click Apply.

Enable the AWS libraries

There are many AWS shapes available to visualise your AWS infrastructure. When you enable just one of the shape libraries above, you'll see a number of sub-categories of shapes appear in the left panel.

Some of the AWS shapes available in draw.io

Replace shapes

Drag a replacement shape from a shape library and hover over a shape in the diagram until you see the black replace shape arrow appear. Then release. The shape you just dropped will replace the old shape on the diagram. You may need to tweak the size and style afterwards. Once you have replaced all the shapes, change the sizes and styles to multiple shapes at once to save time.

Drag a shape from the library and hover over a shape until you see the black replace arrow

Copy styles

Select a shape that has the style you want to copy. In the Style tab of the format panel on the right, click Copy Style. Select one or more shapes that you want to update, and click Paste Style.

Copy sizes

Select a shape that has the size you want to copy. In the Arrange tab of the format panel, click Copy Size. Select one or more shapes, then click Paste Size.

In this example, all of the older AWS shapes and 3D shapes have been updated to use a more recent AWS shape library.

IOT example using 2019 AWS shapes
Open this AWS diagram in the free draw.io diagram viewer