Collaborative editing in draw.io in Confluence DC
Collaborative editing has long been possible in draw.io for Confluence Cloud. From the draw.io for Confluence DC release 13.0, you and your team will be able to edit the same diagram and see each other's changes.
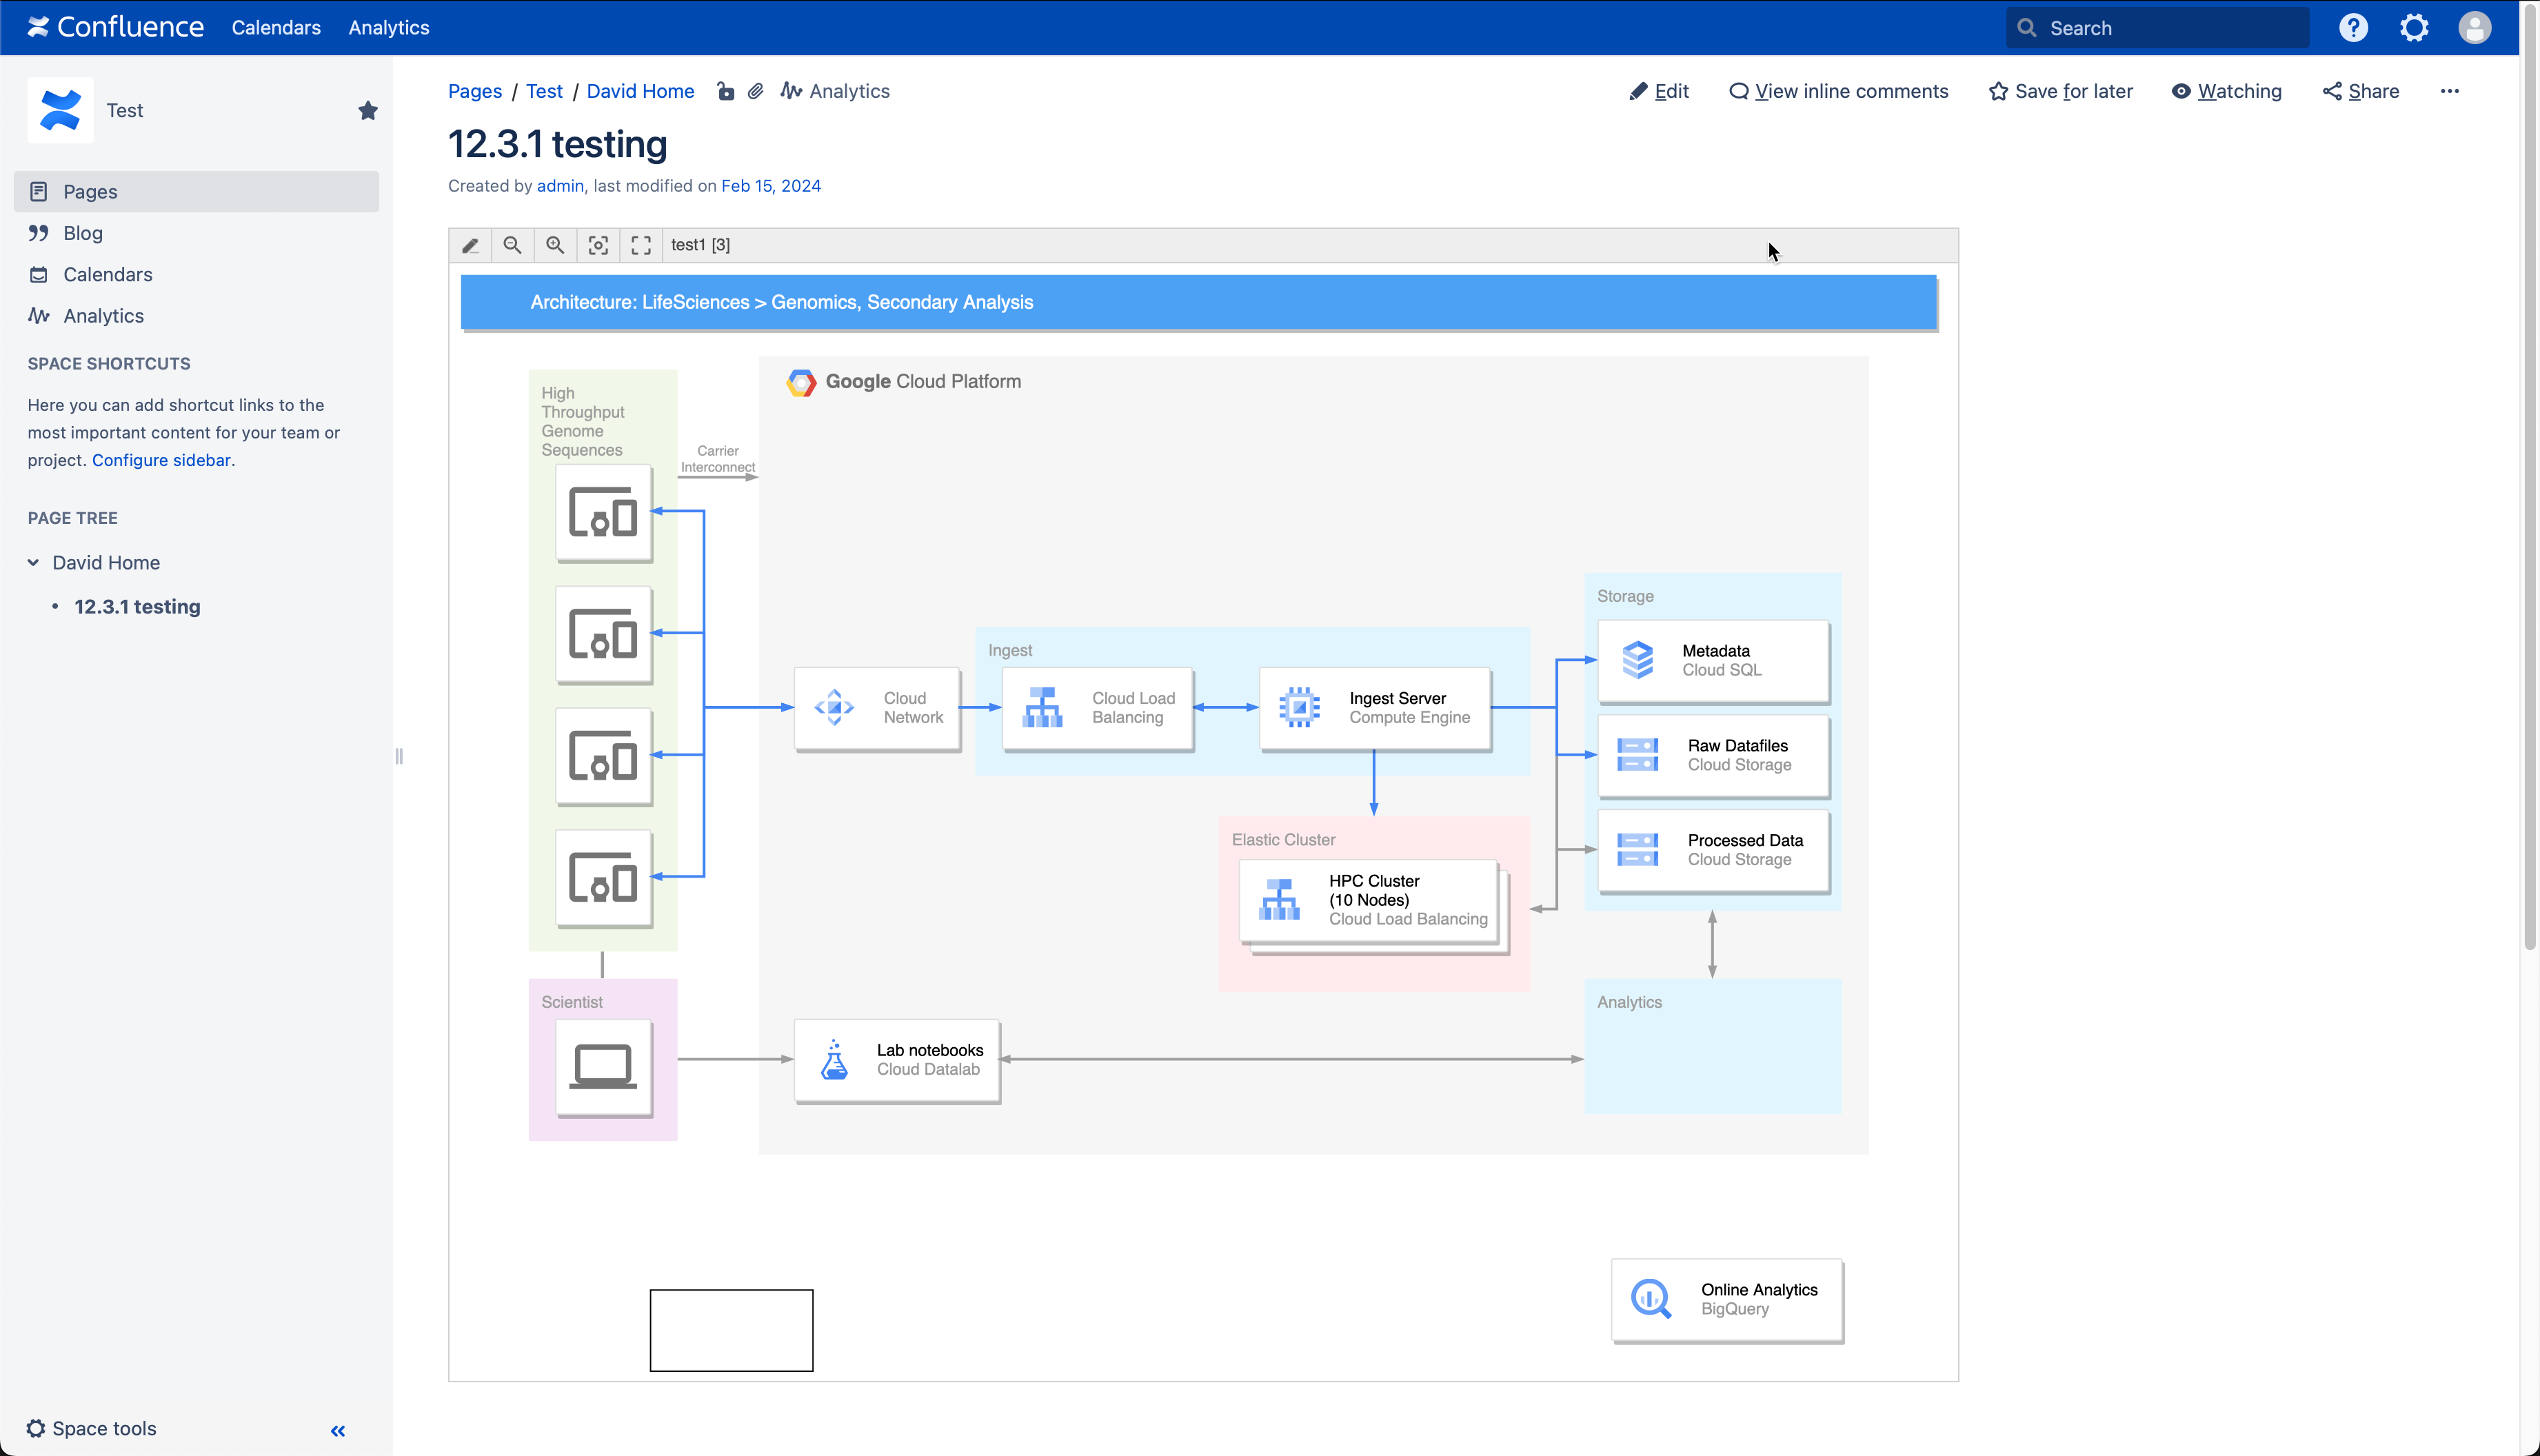
Collaborative editing works in both the draw.io Diagram macro and the draw.io Board macro in Confluence DC. Note the collaboration isn't real-time, we need to ensure a slower update rate is stable and causes no performance issues in the first release.
Real-time multi-user diagramming
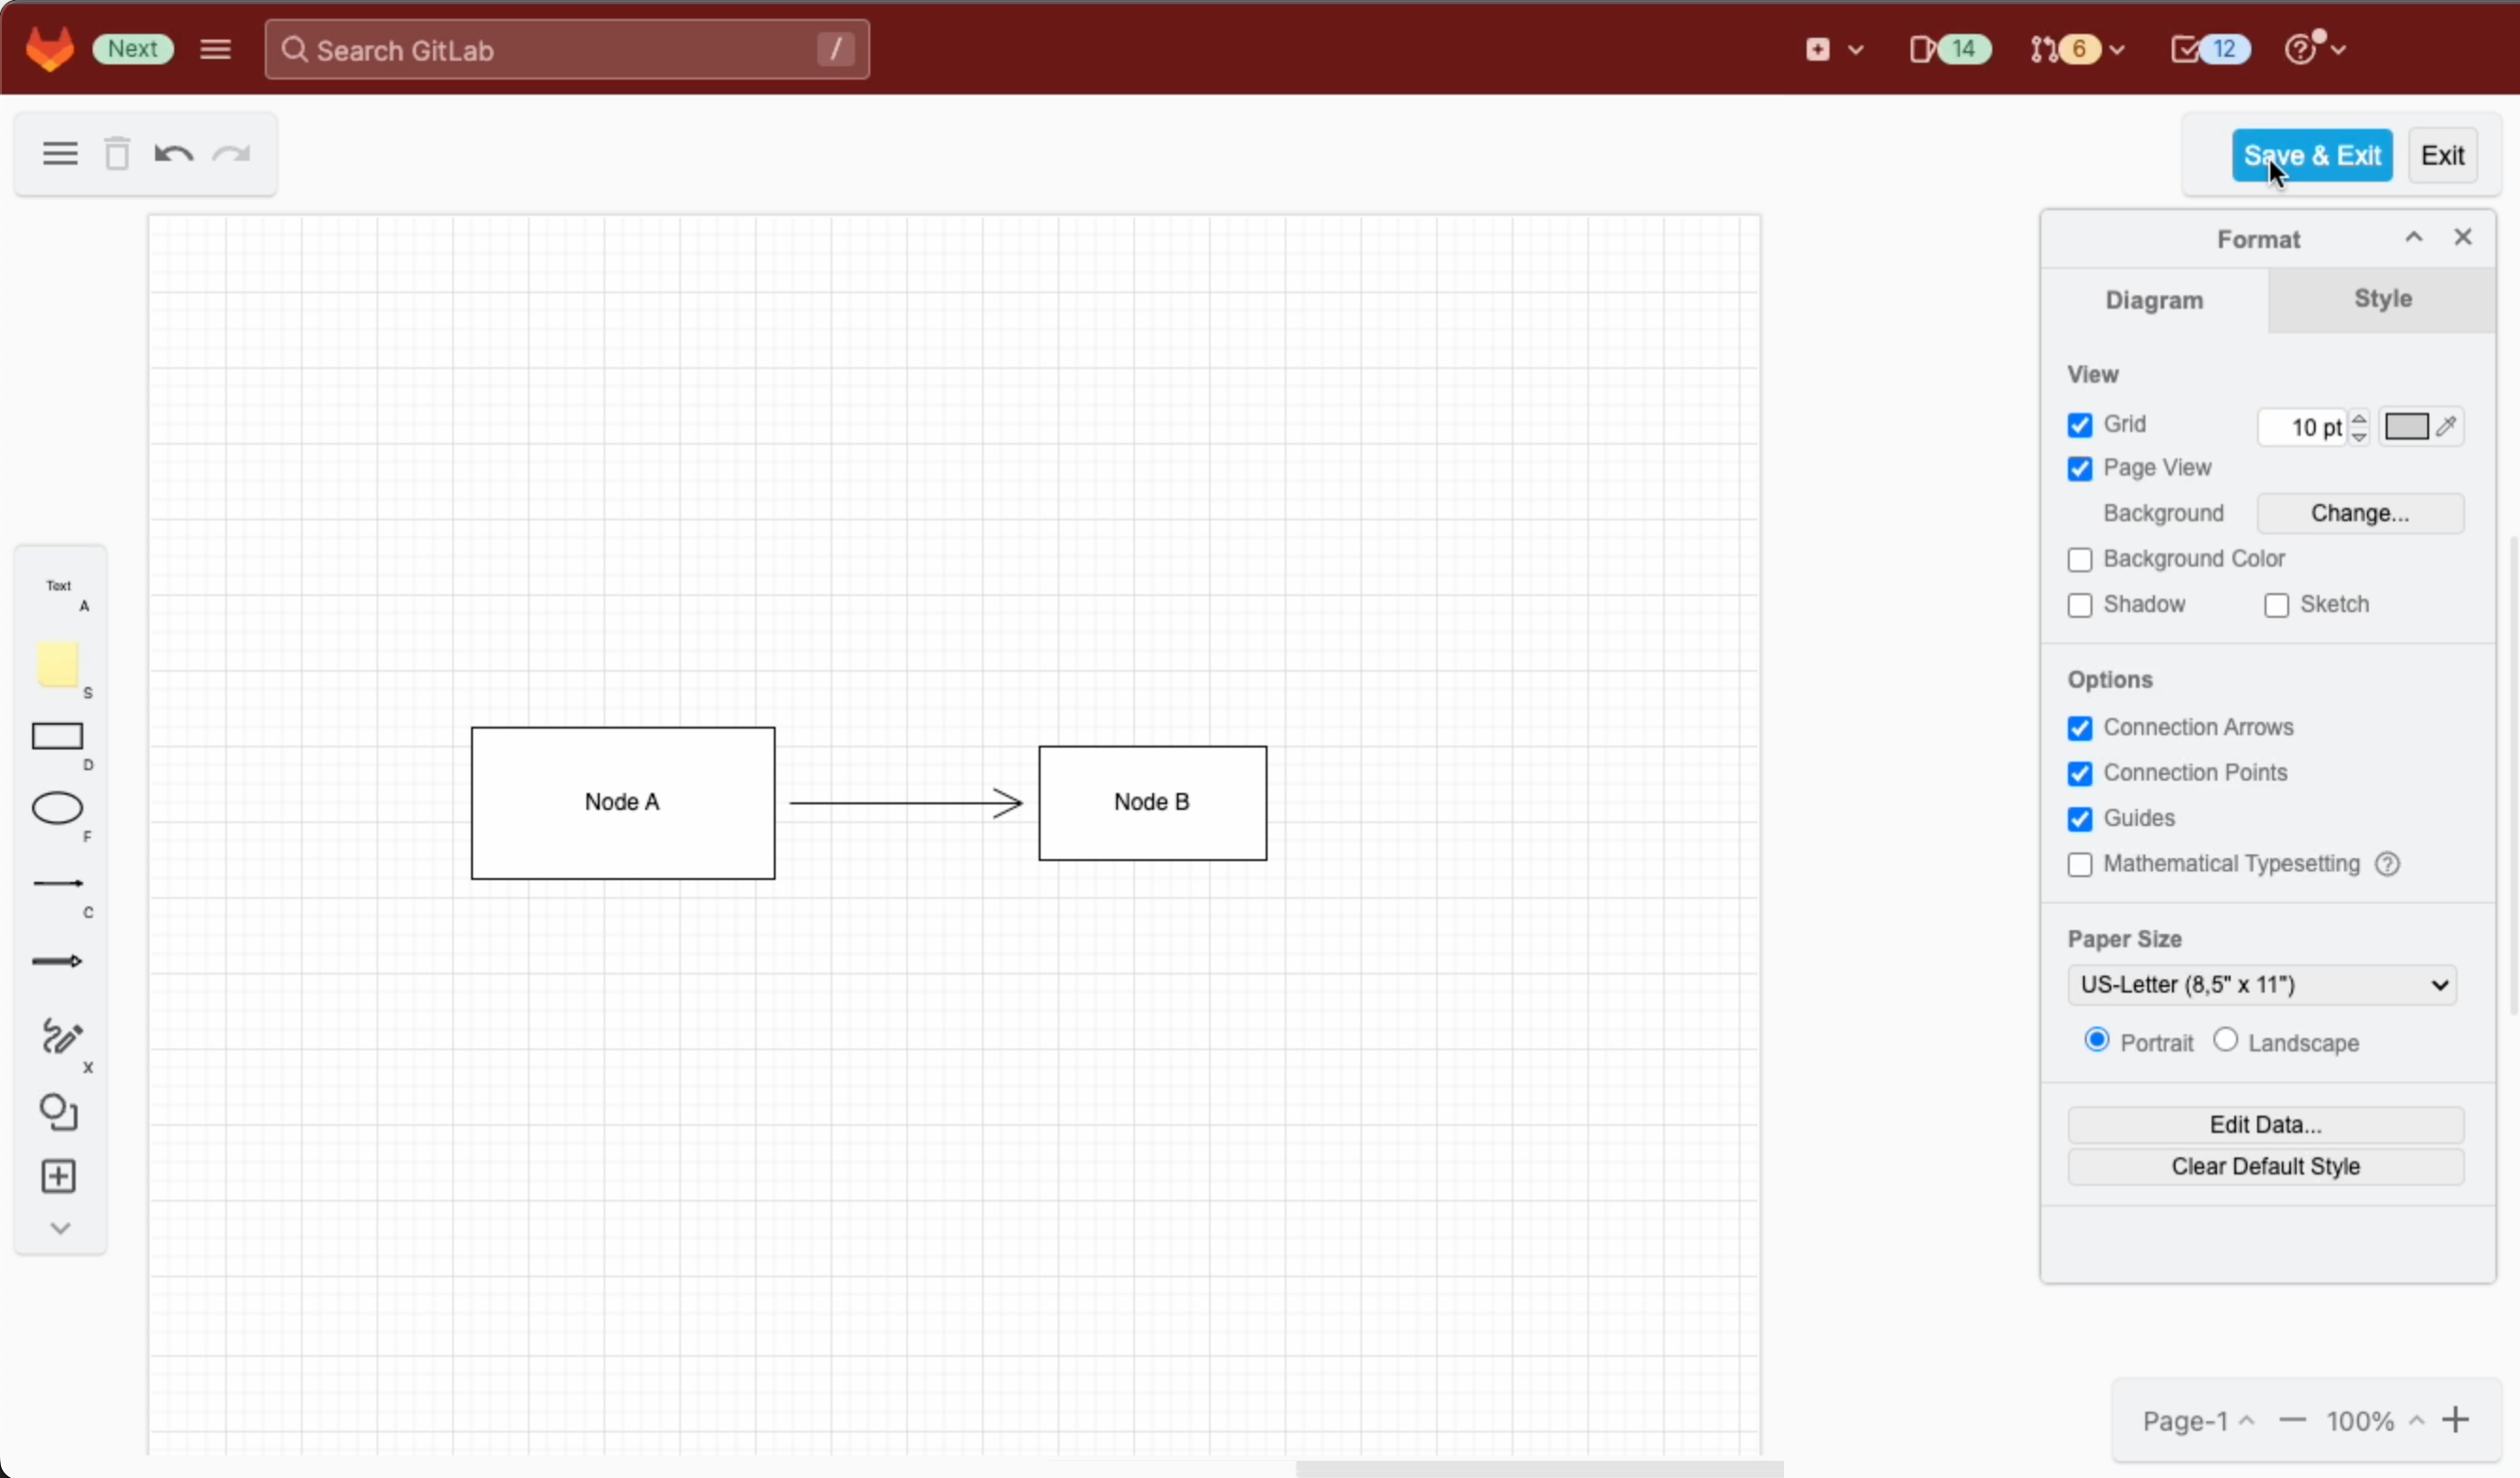
Just like in draw.io for Confluence Cloud, the new collaborative editing feature in draw.io for Confluence DC uses the built-in auto-save feature.
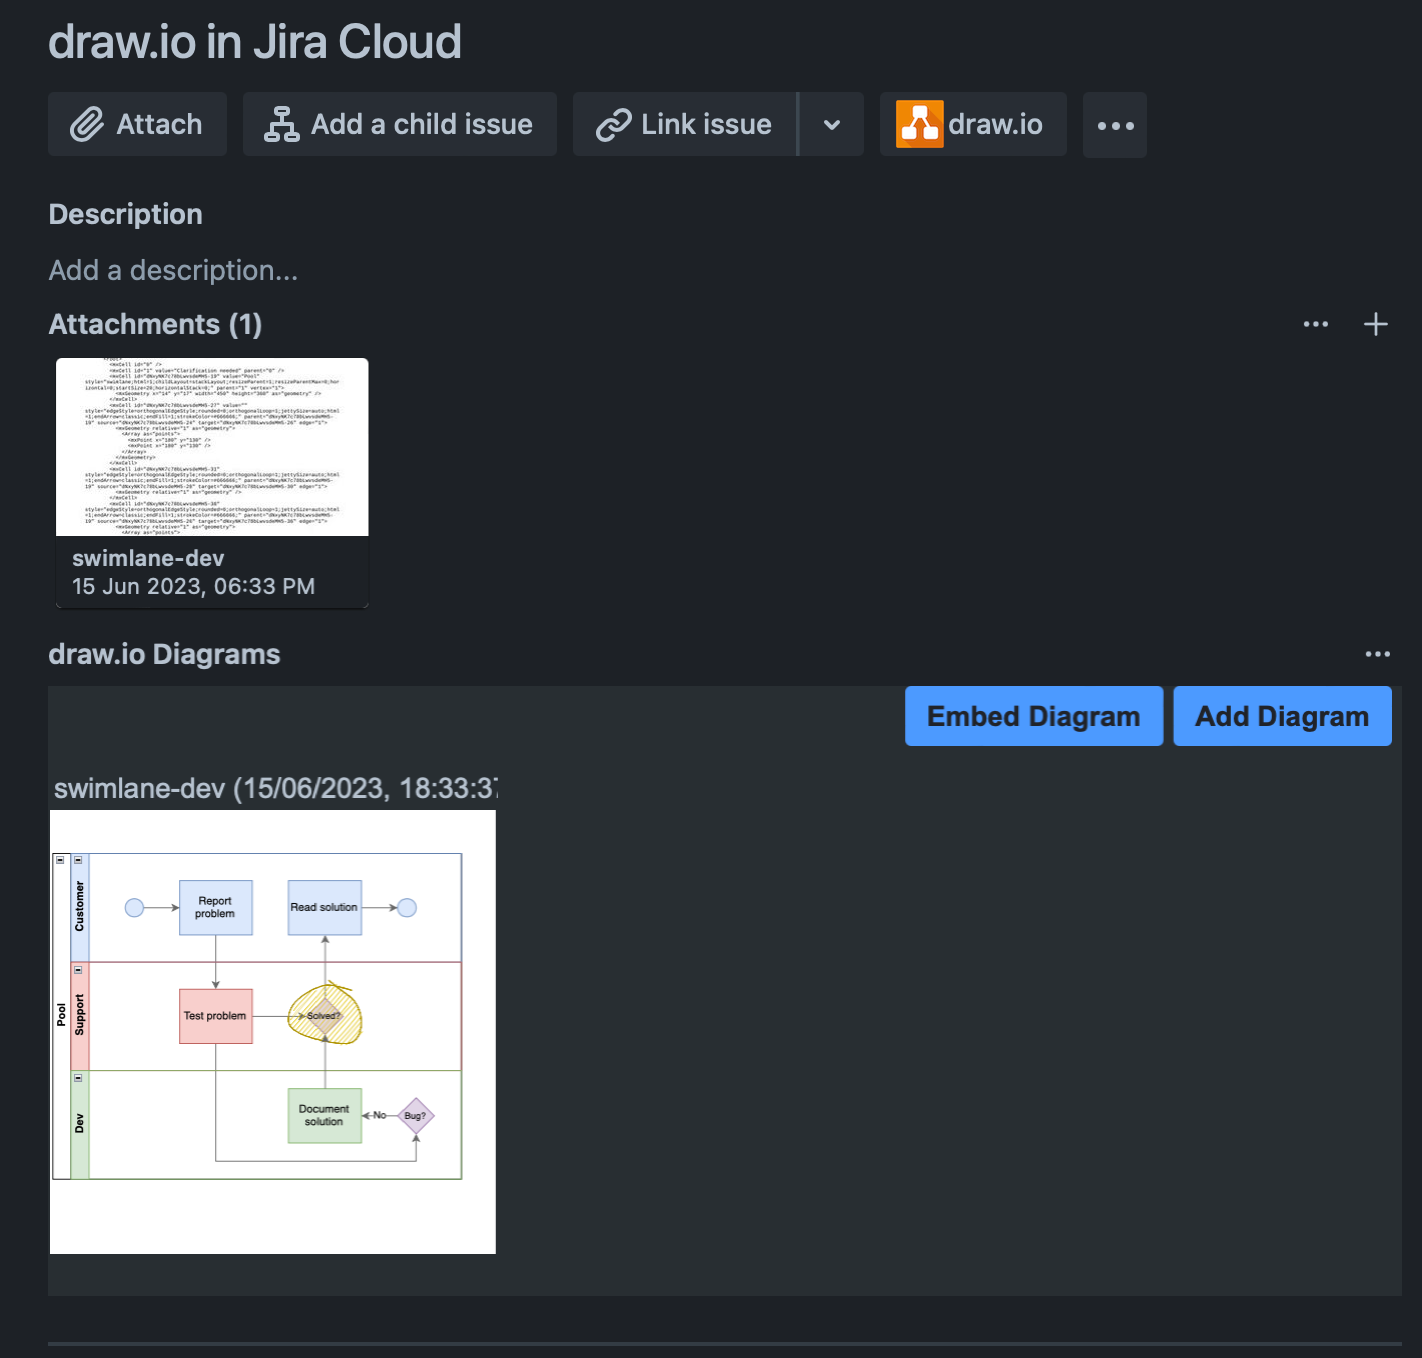
- When you make a change to a draw.io diagram - add, style, or delete shapes, text and connectors, the diagram will be automatically saved to the Confluence page attachments.
- The draw.io diagram editor regularly polls the Confluence DC instance to see if any changes were made by other users, then loads these changes into your editor.
You don't need to manually save or synchronise the diagrams - changes will automatically appear in the draw.io editor for everyone editing the diagram.
No shared cursors?
As Confluence DC is not a cloud service with web sockets, there is no way to share and synchronise users' cursors as they work inside the diagram editor.
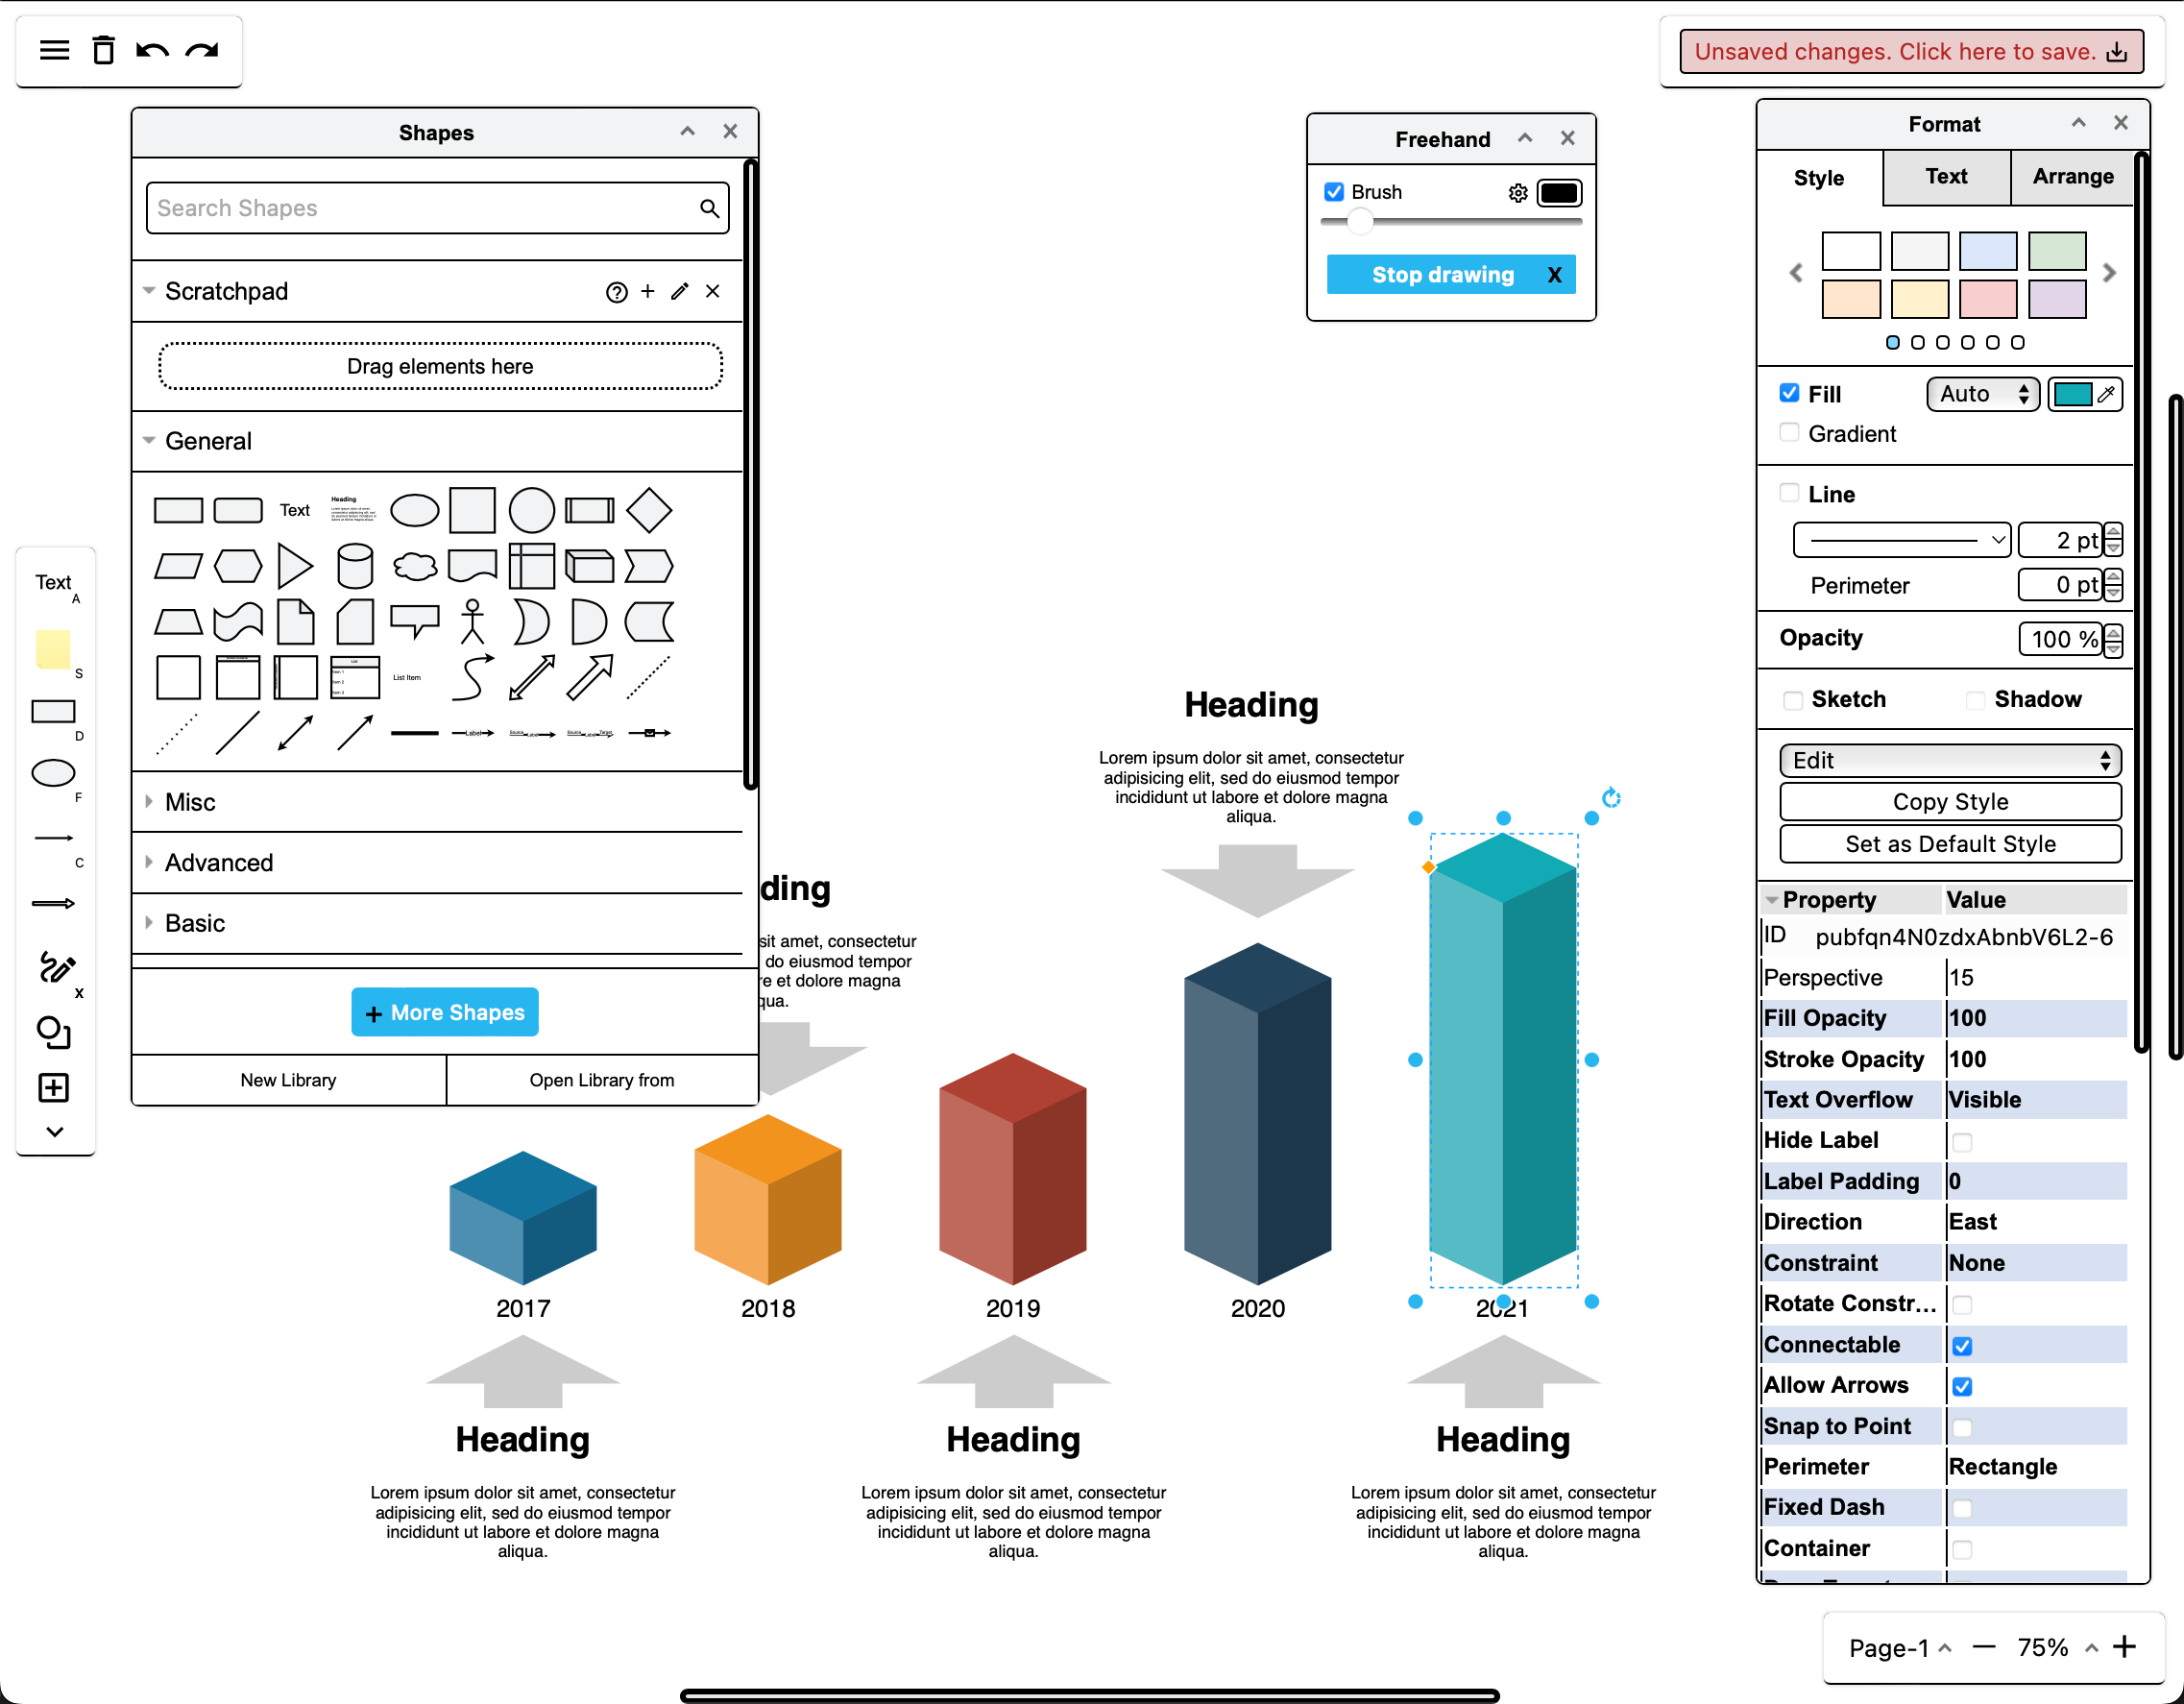
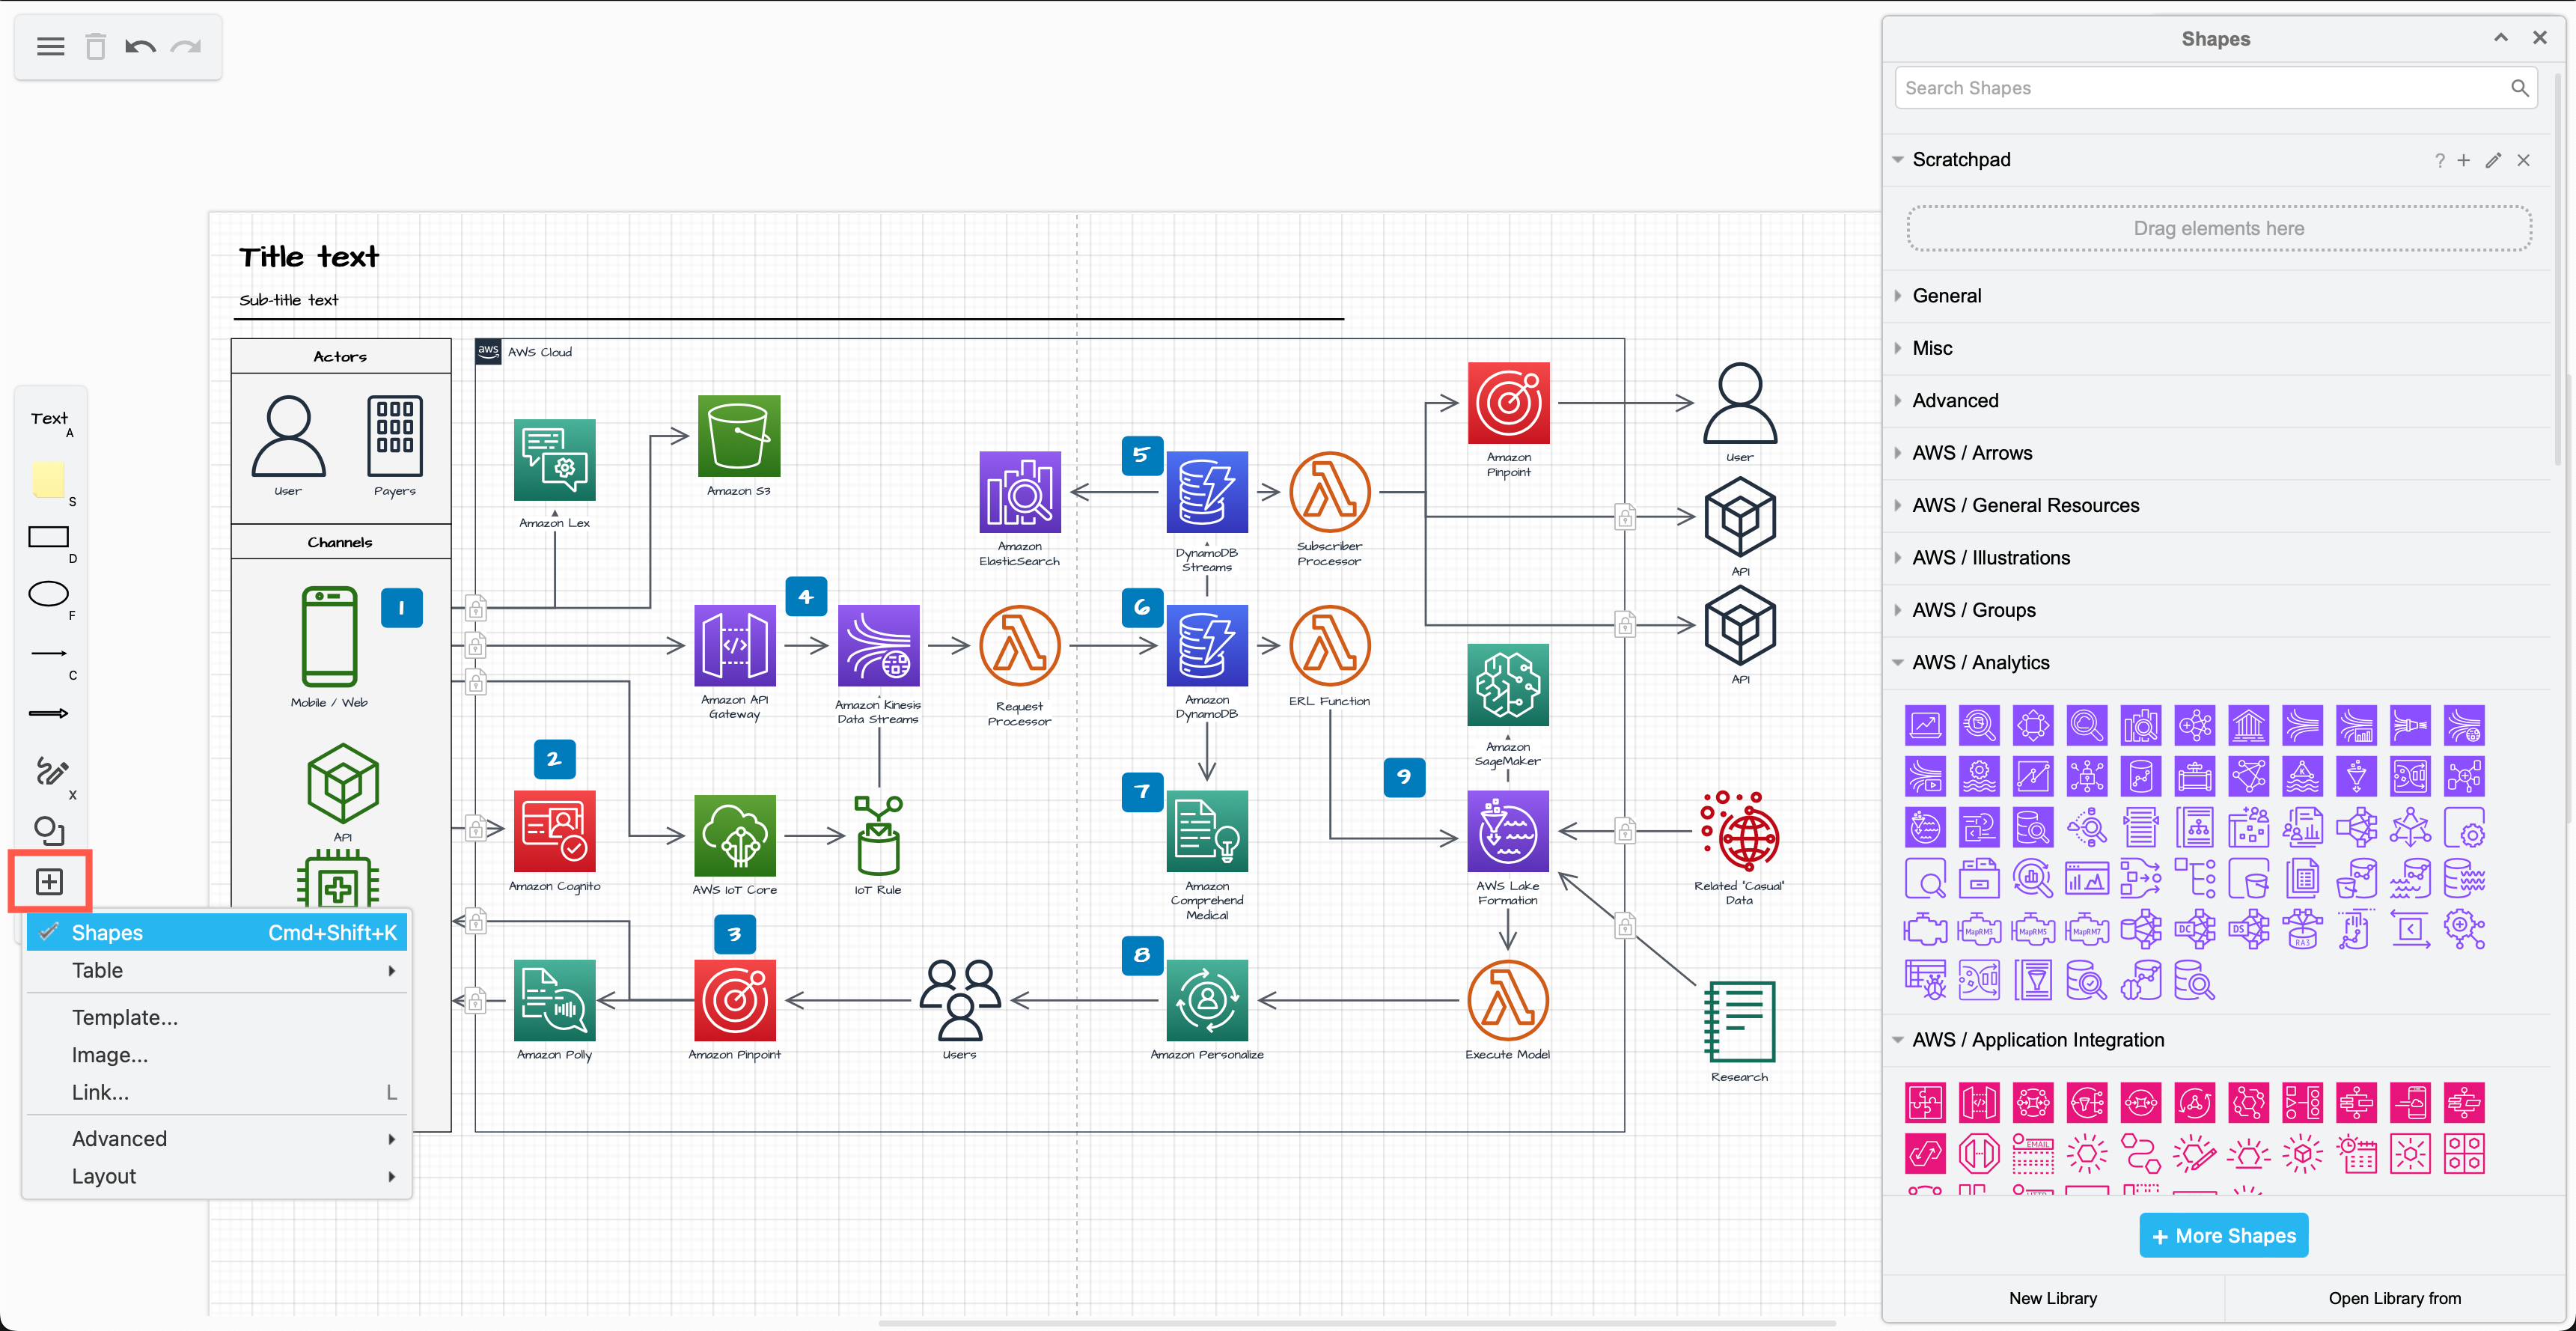
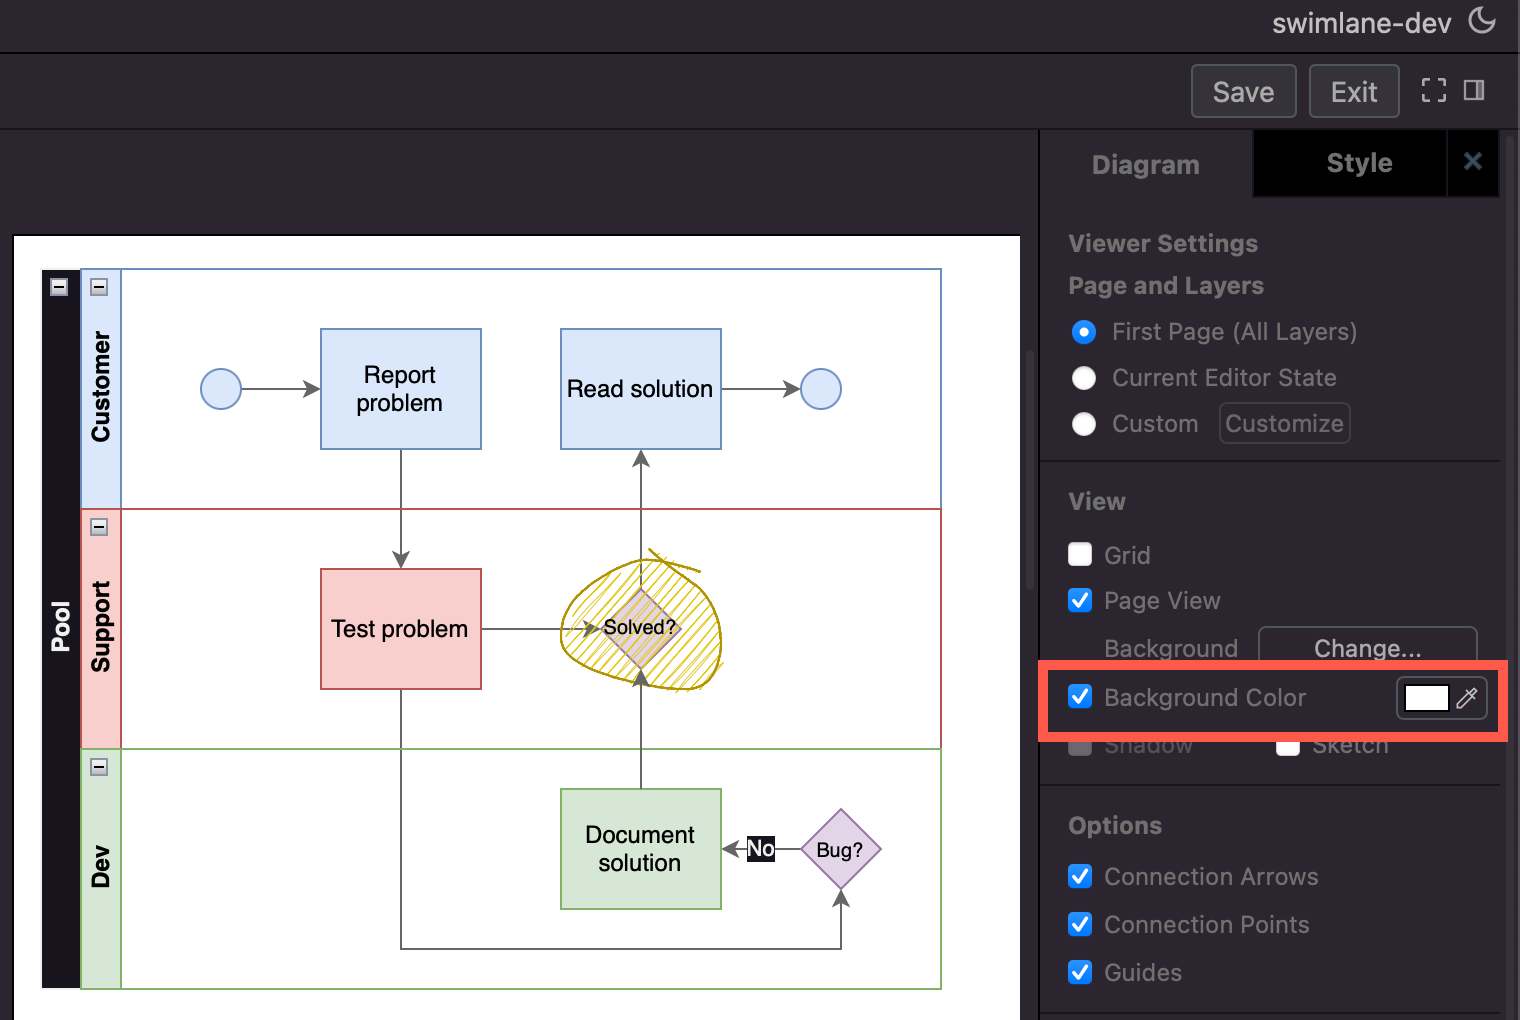
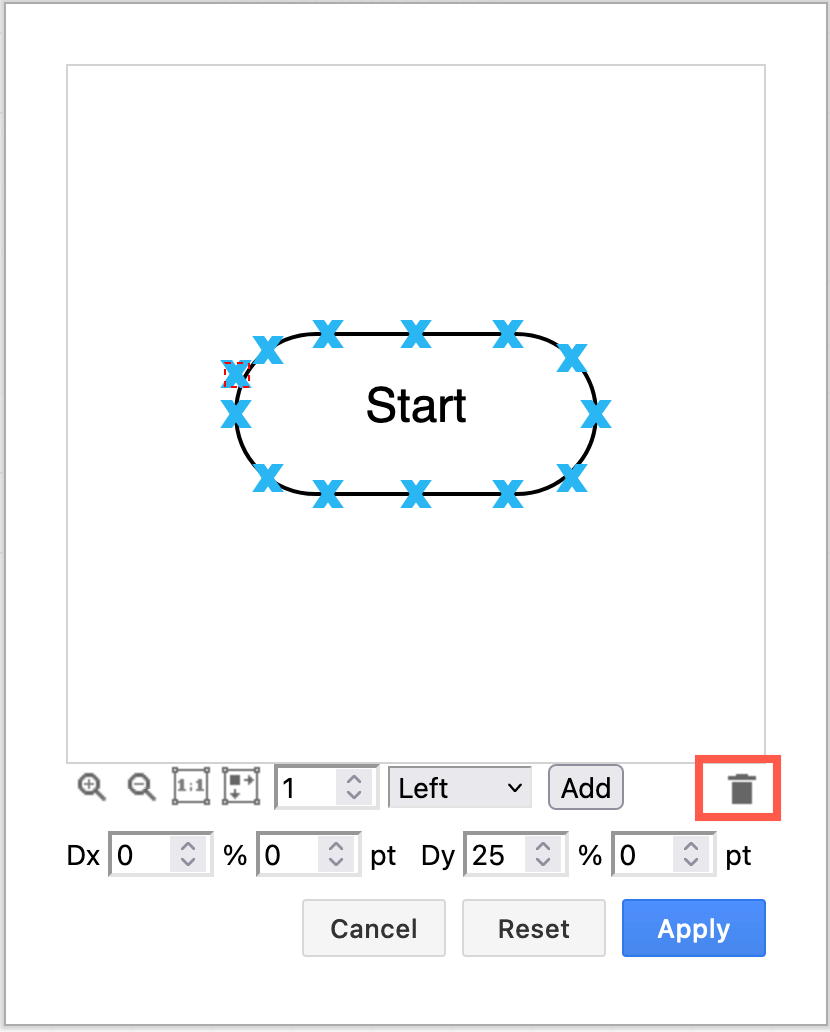
You can still make gestures on the diagram with the freehand brush to discuss a draw.io diagram in online meetings with your team - the freehand shape will appear in the other users' draw.io editor shortly after you draw it.
Changes are merged from multiple users
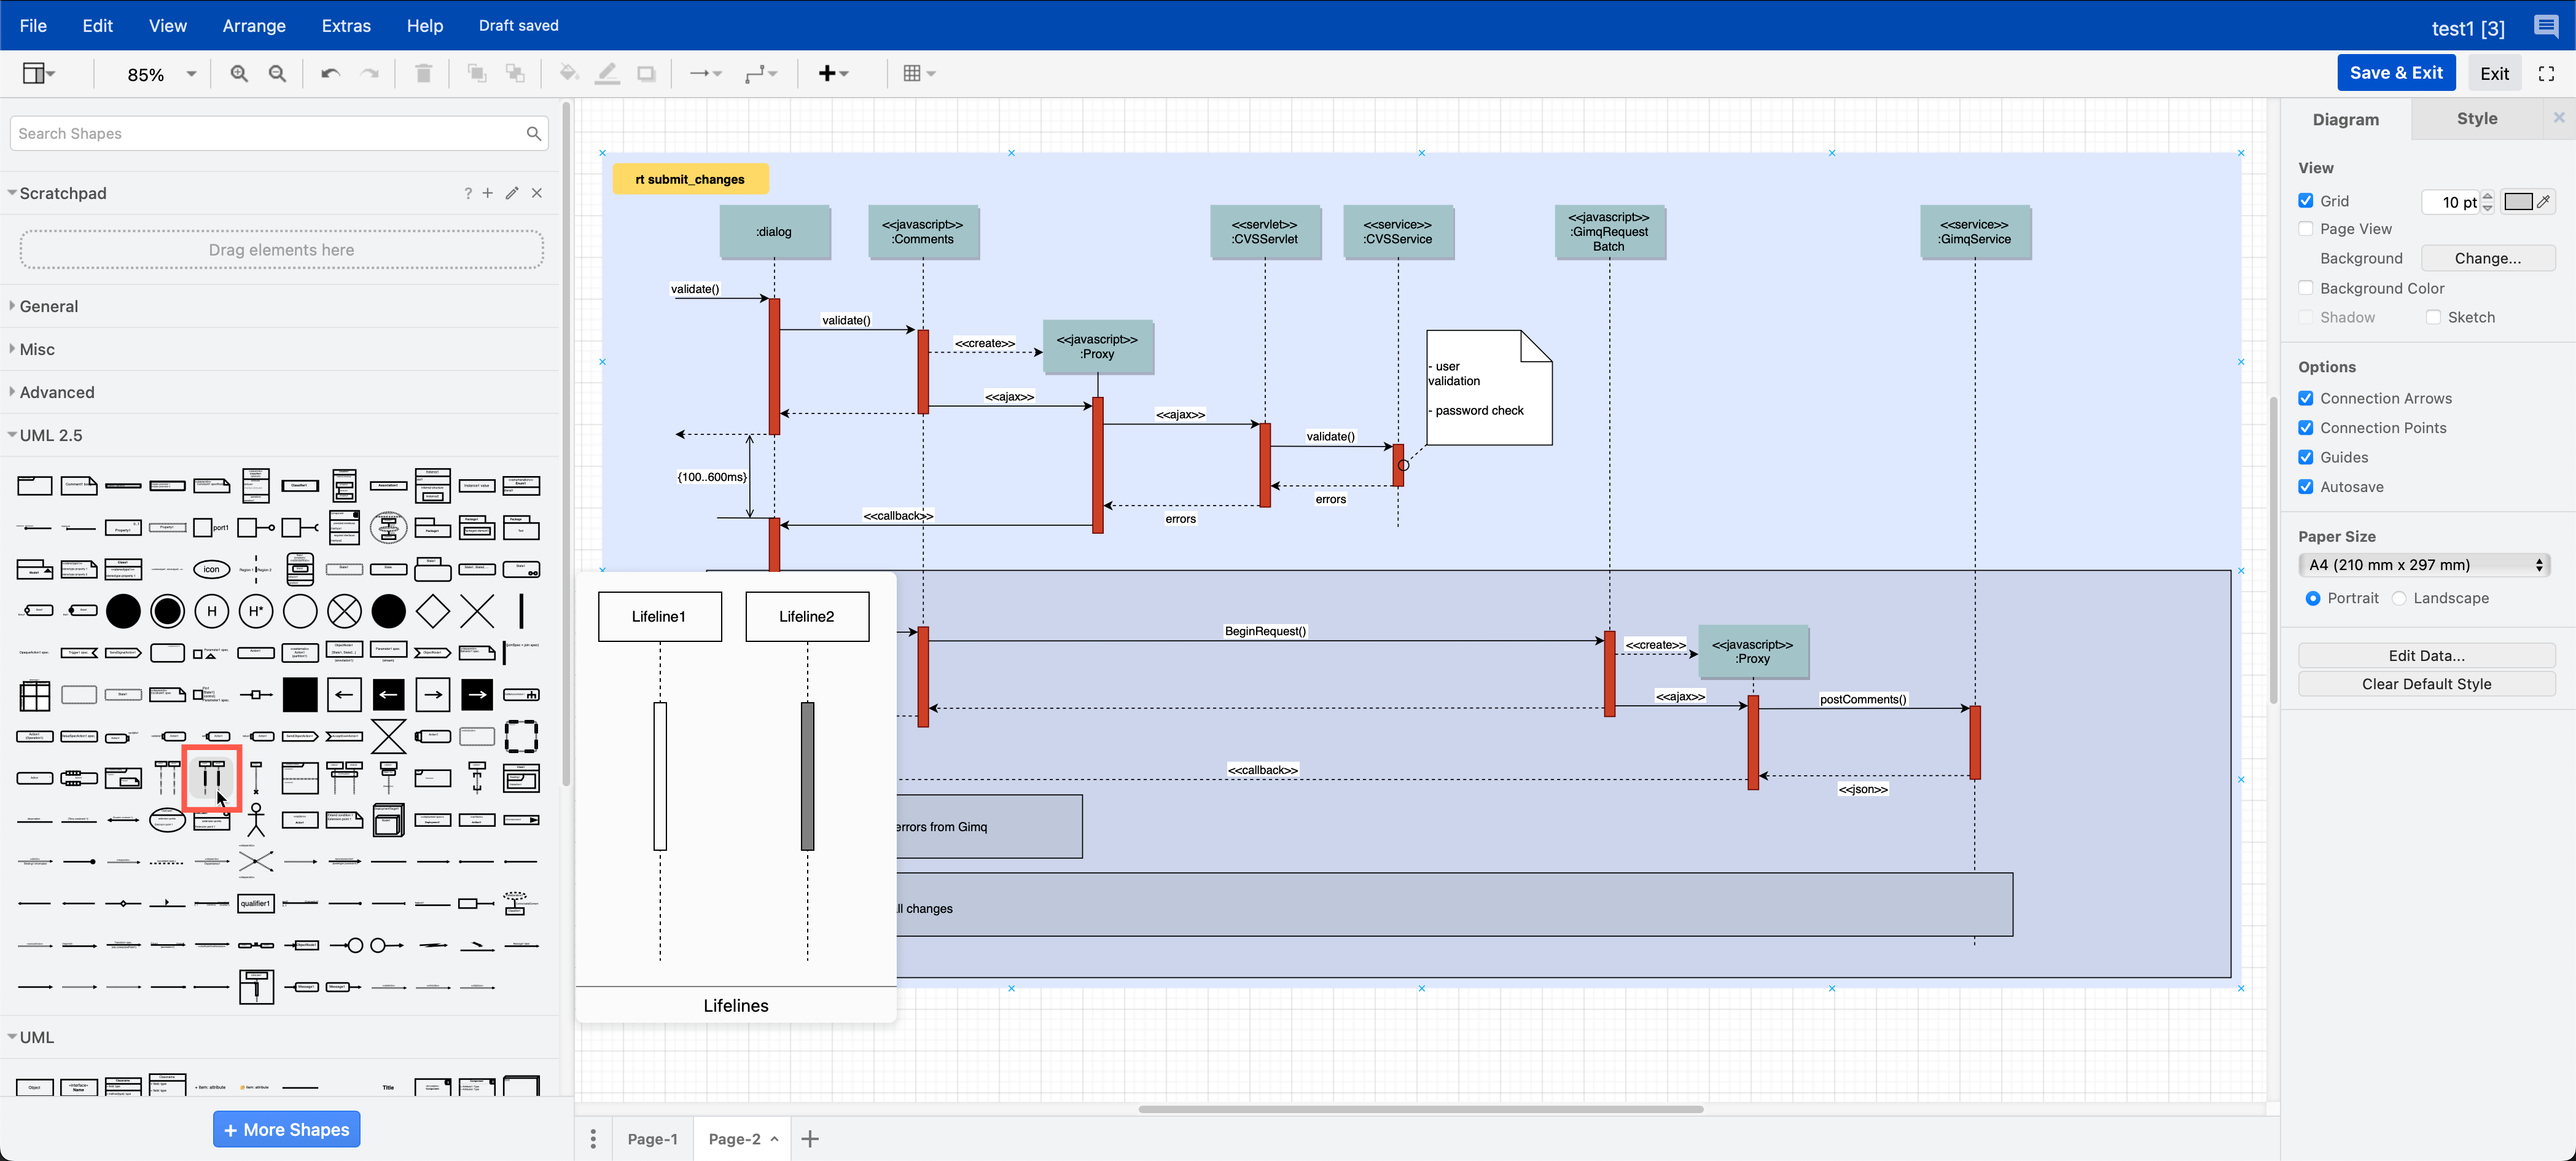
If several users add shapes to the same location on a diagram, draw.io will take all those shapes and simply overlap them.
If one user adds and connects a new shape to an existing shape, but another user deletes the existing shape, both user's changes are saved:
- The child shape will appear to stand alone as its parent was deleted.
- The existing parent shape and any connectors from it to new shapes added by other users will be deleted.
This is the same process followed by the collaborative editing function in draw.io for Confluence Cloud.
Because draw.io merges all the changes made to a diagram, and does not overwrite the attachment with the most recent saved state from one user, you won't lose any data when you are editing a diagram as a team.
Change the synchronisation speed and auto-save interval
If your Confluence DC users find that changes appear in diagrams they are editing together too slowly, an administrator can increase the polling speed in the draw.io app configuration, by specifying the number of seconds between each poll in the Add-on Configuration field.
Also, you can shorten the time between auto-saving the diagram. A shorter interval will mean more attachment versions of diagrams will be created and added to a Confluence page.
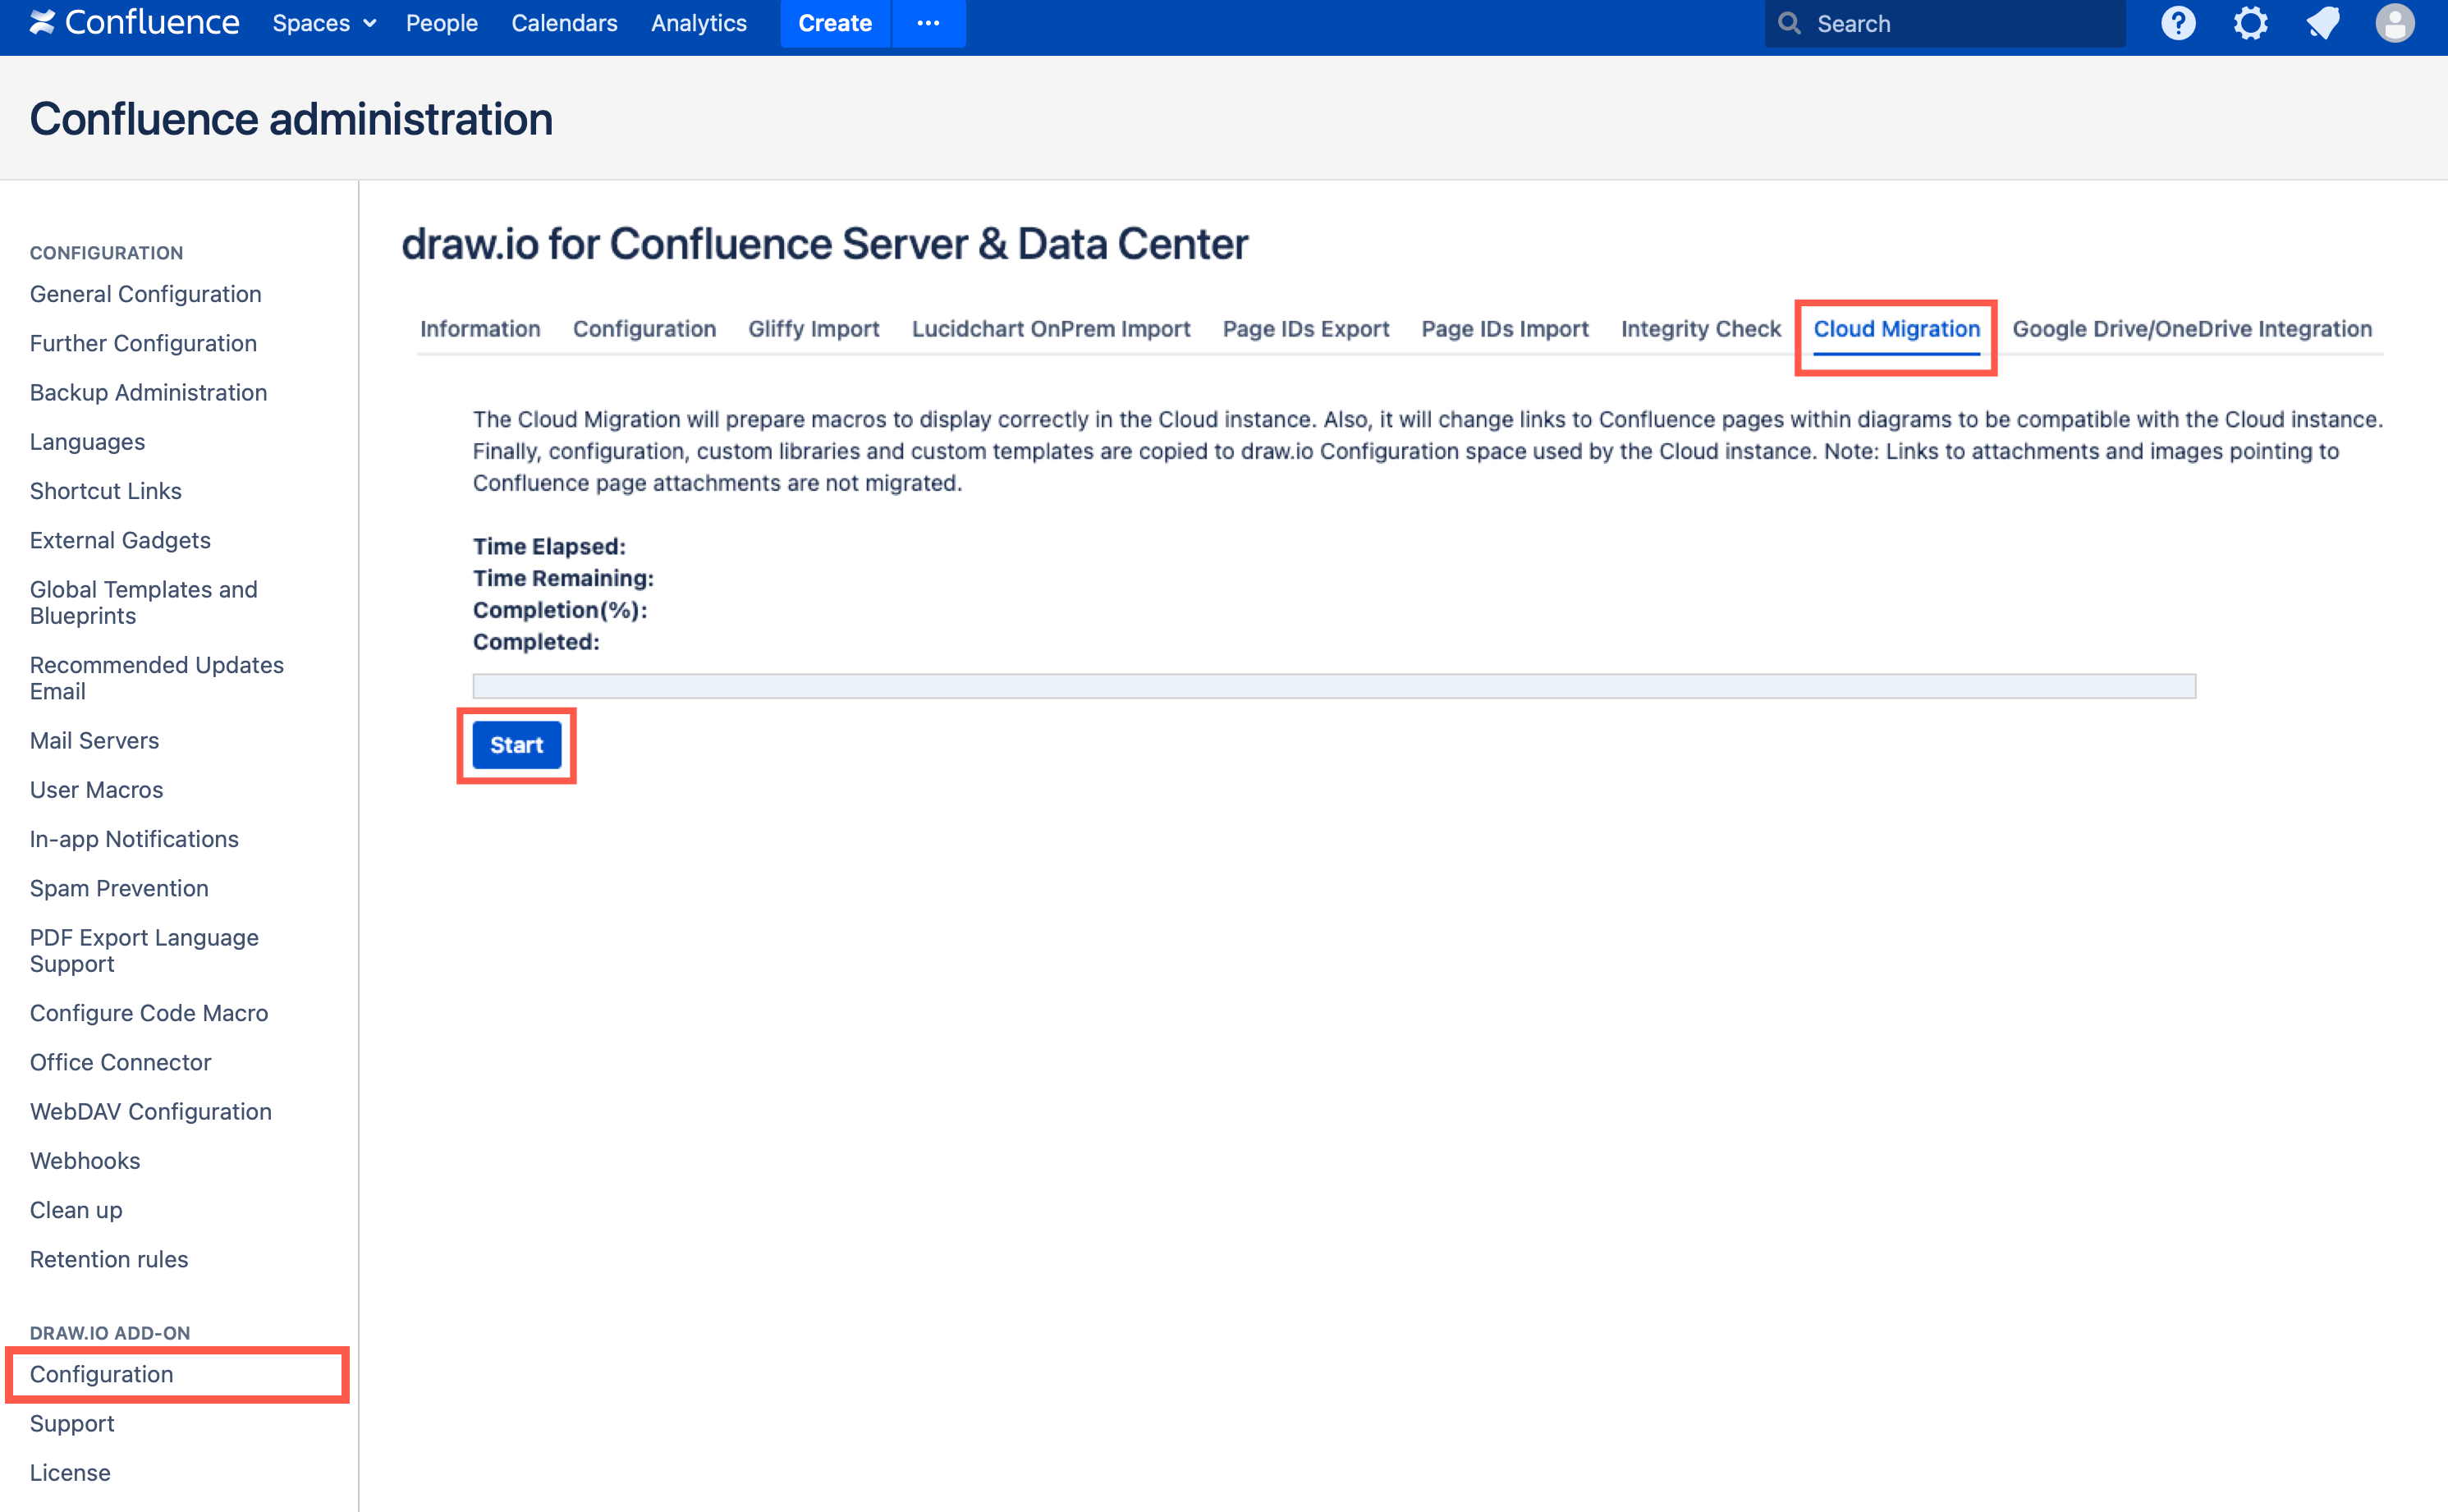
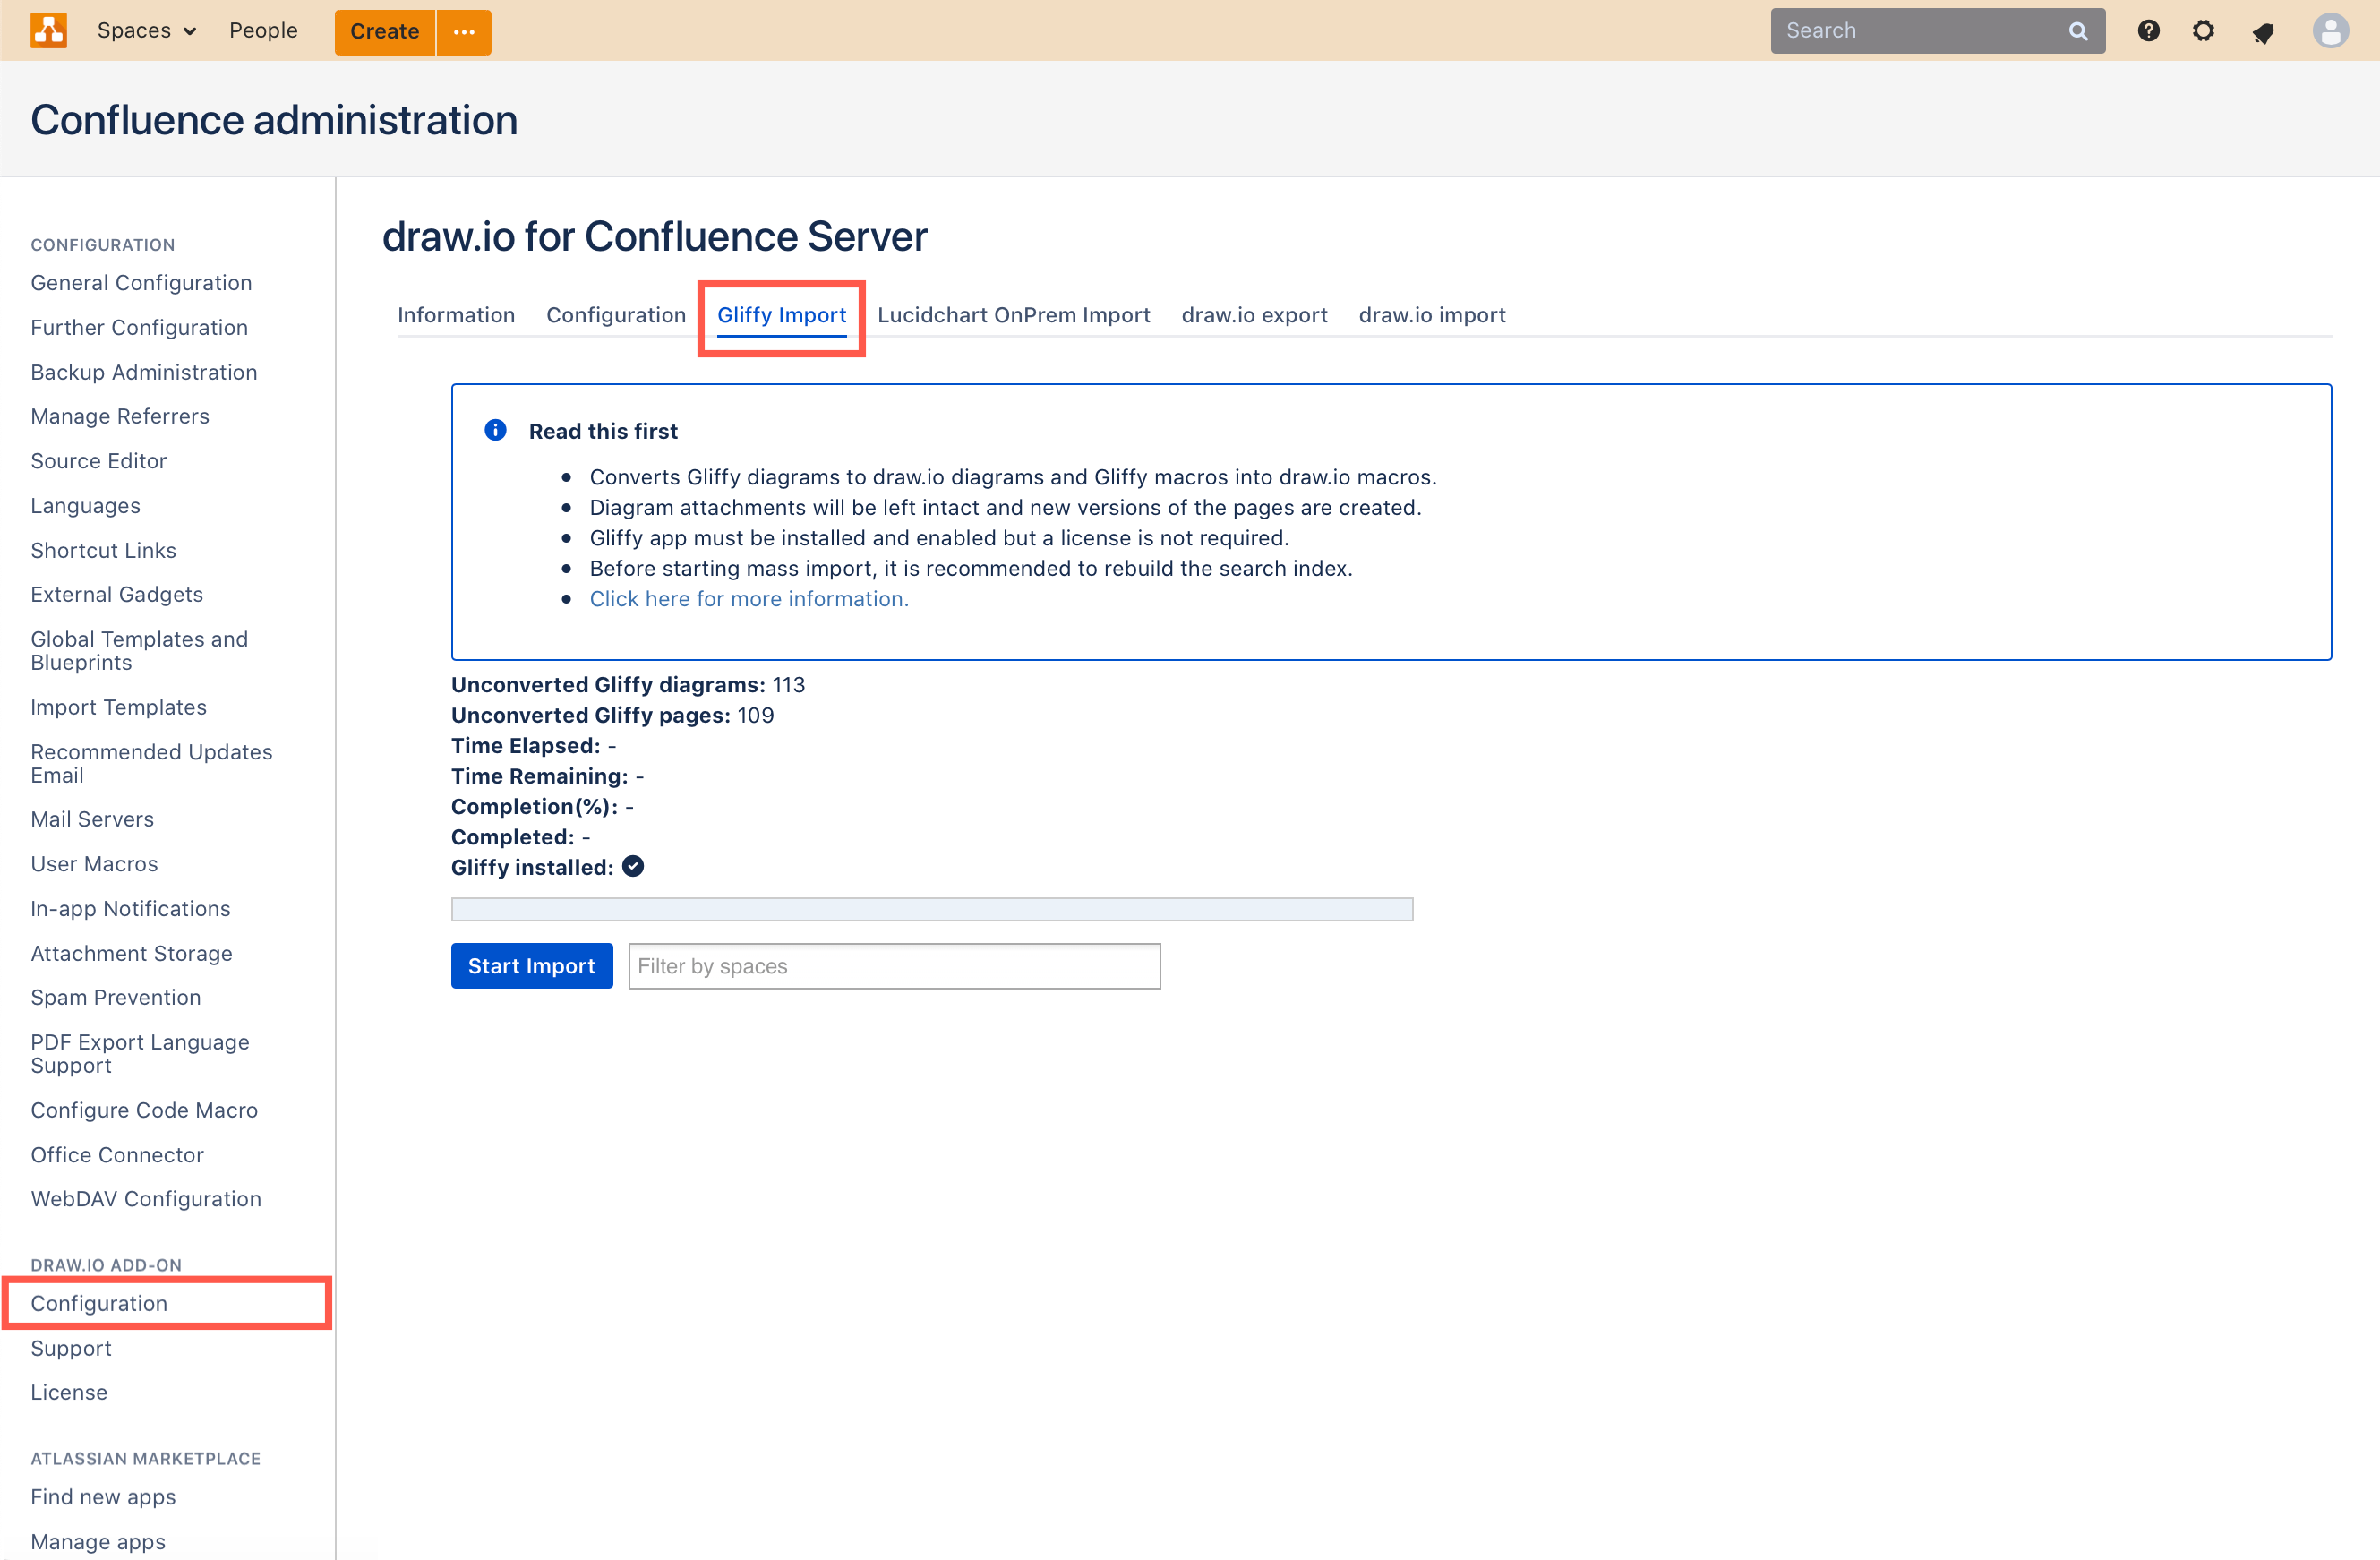
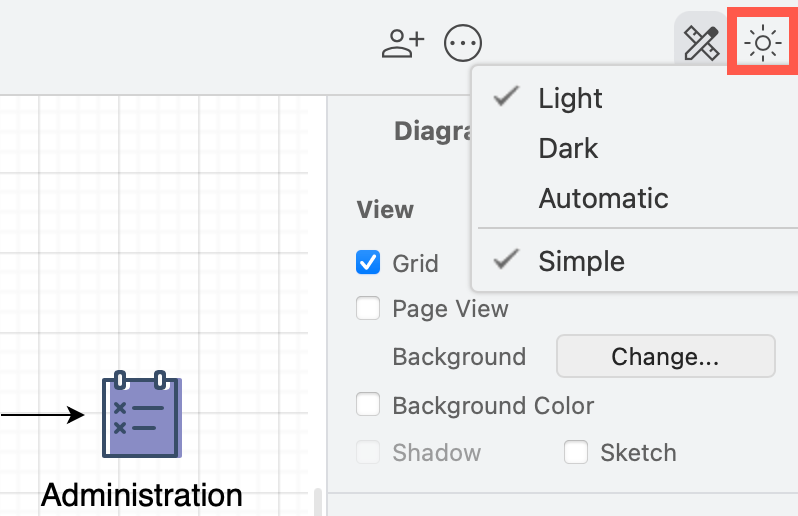
- Go to the administration area of your Confluence DC instance.
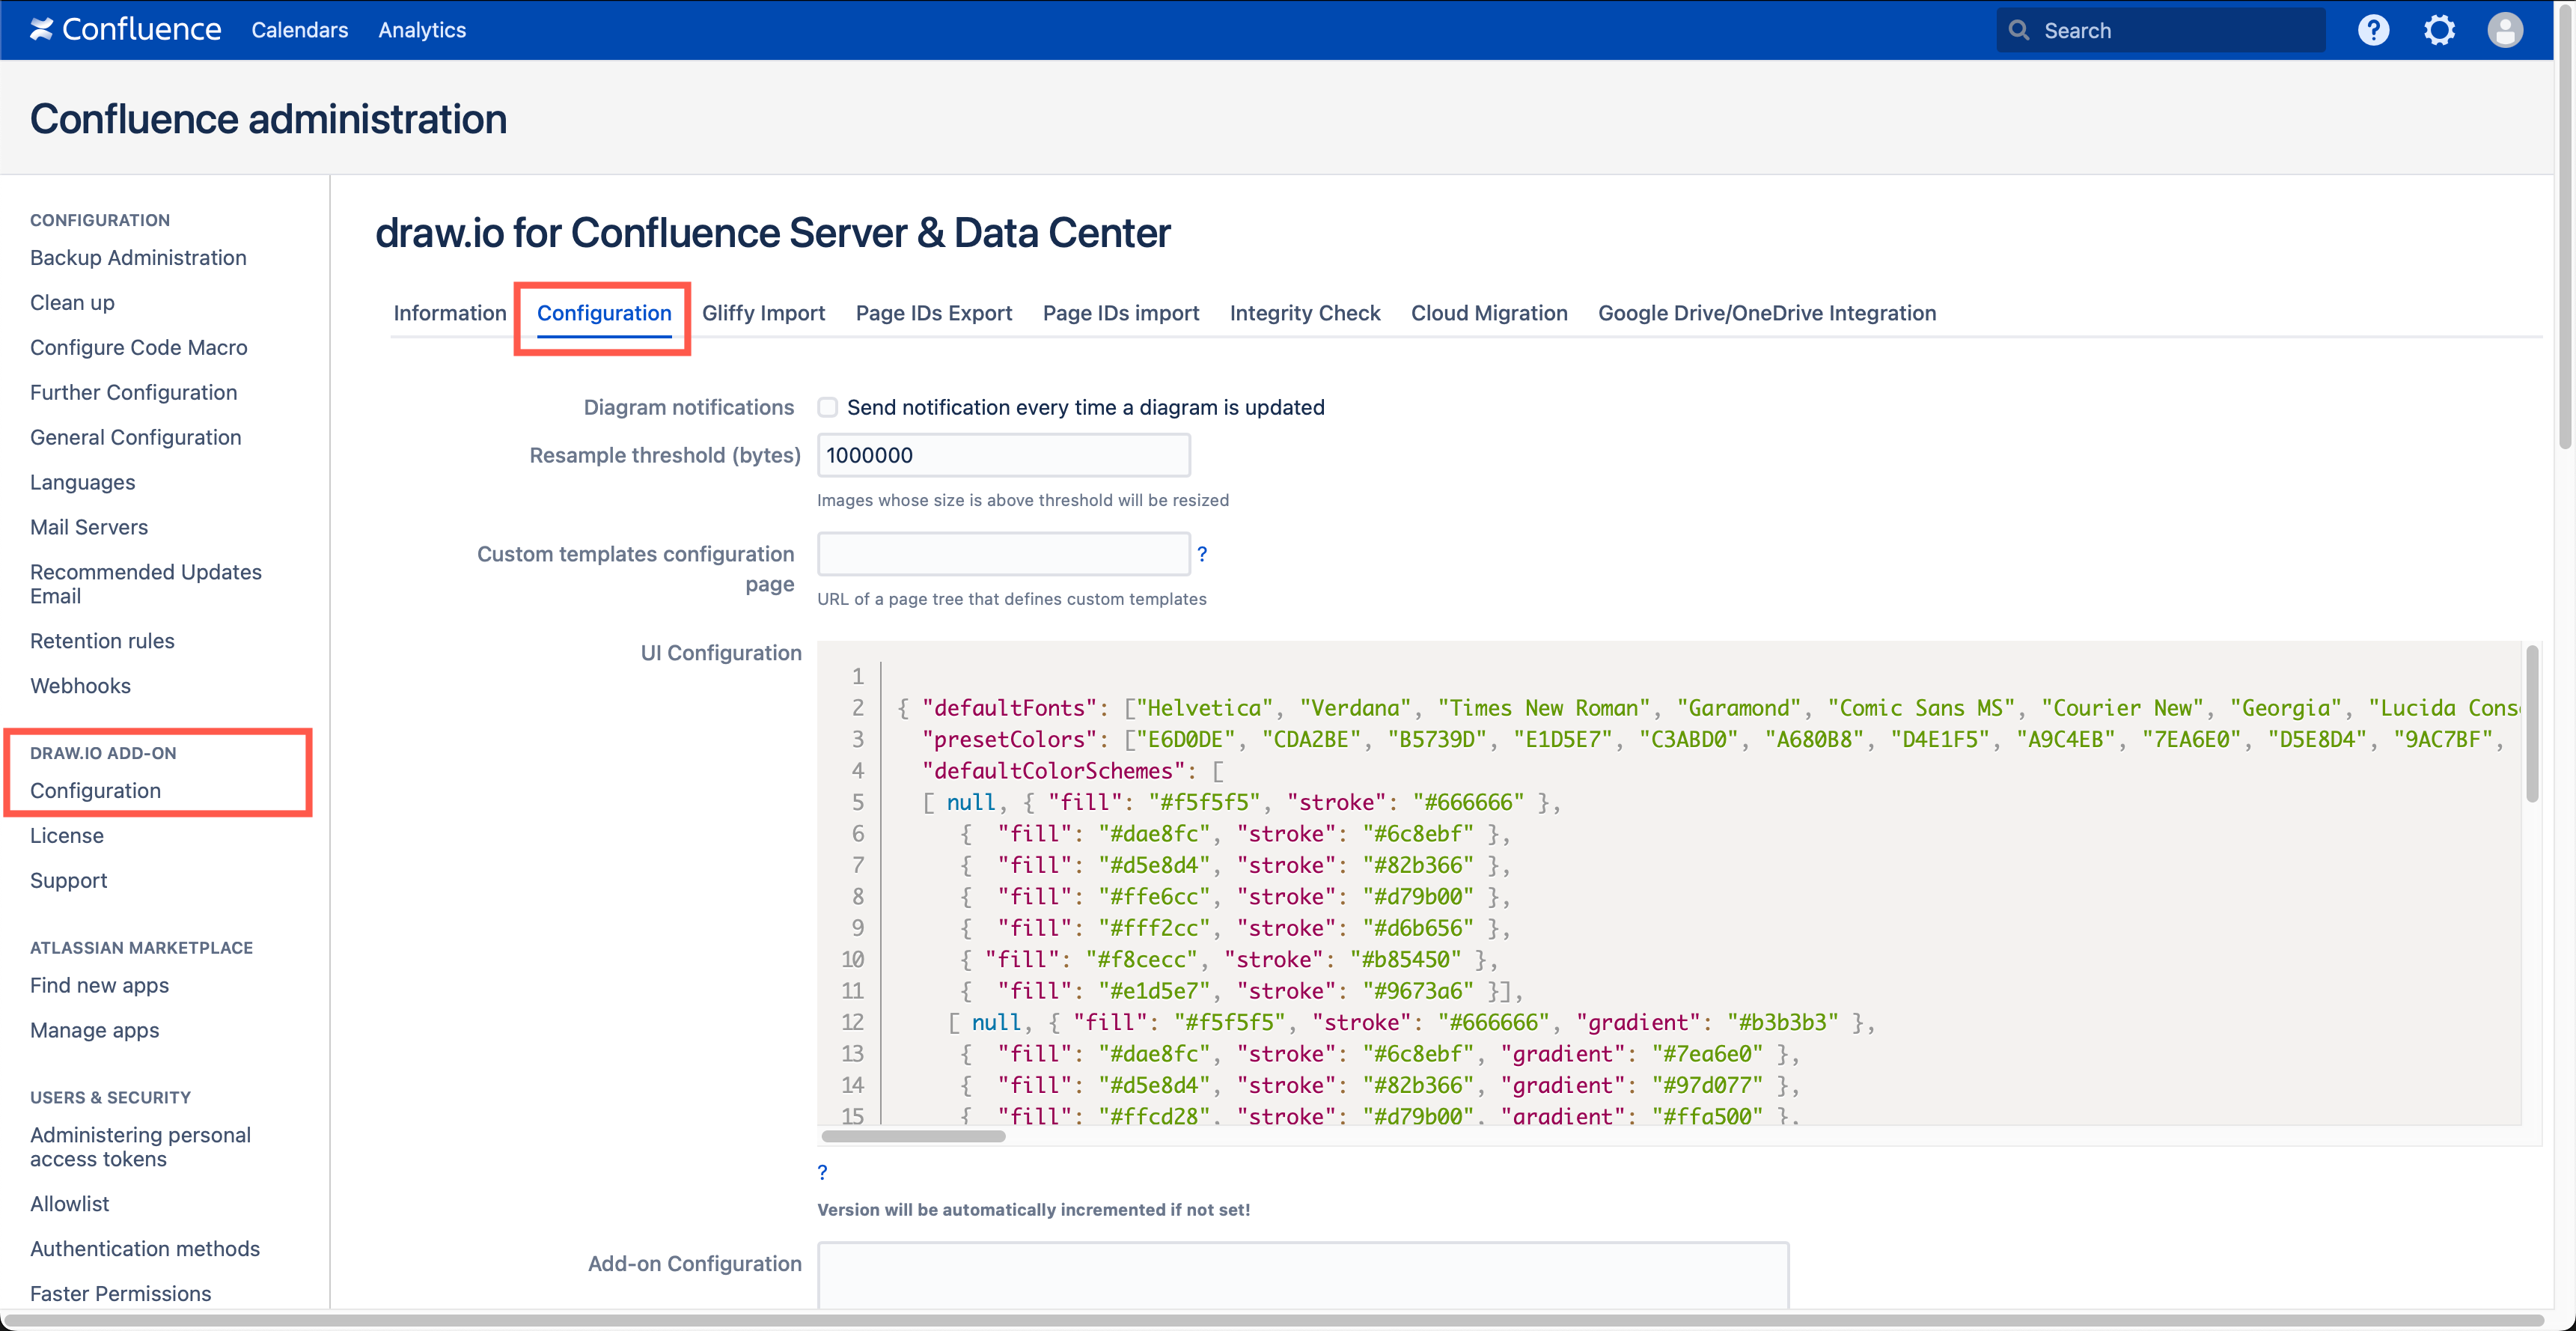
- Go to the Configuration tab in the draw.io Add-on Configuration section.
- Add the following lines to the Add-on Configuration text field:
pollingInterval=10000andmaxAutosaveDelay=5000 - Click Save changes to update the draw.io configuration.
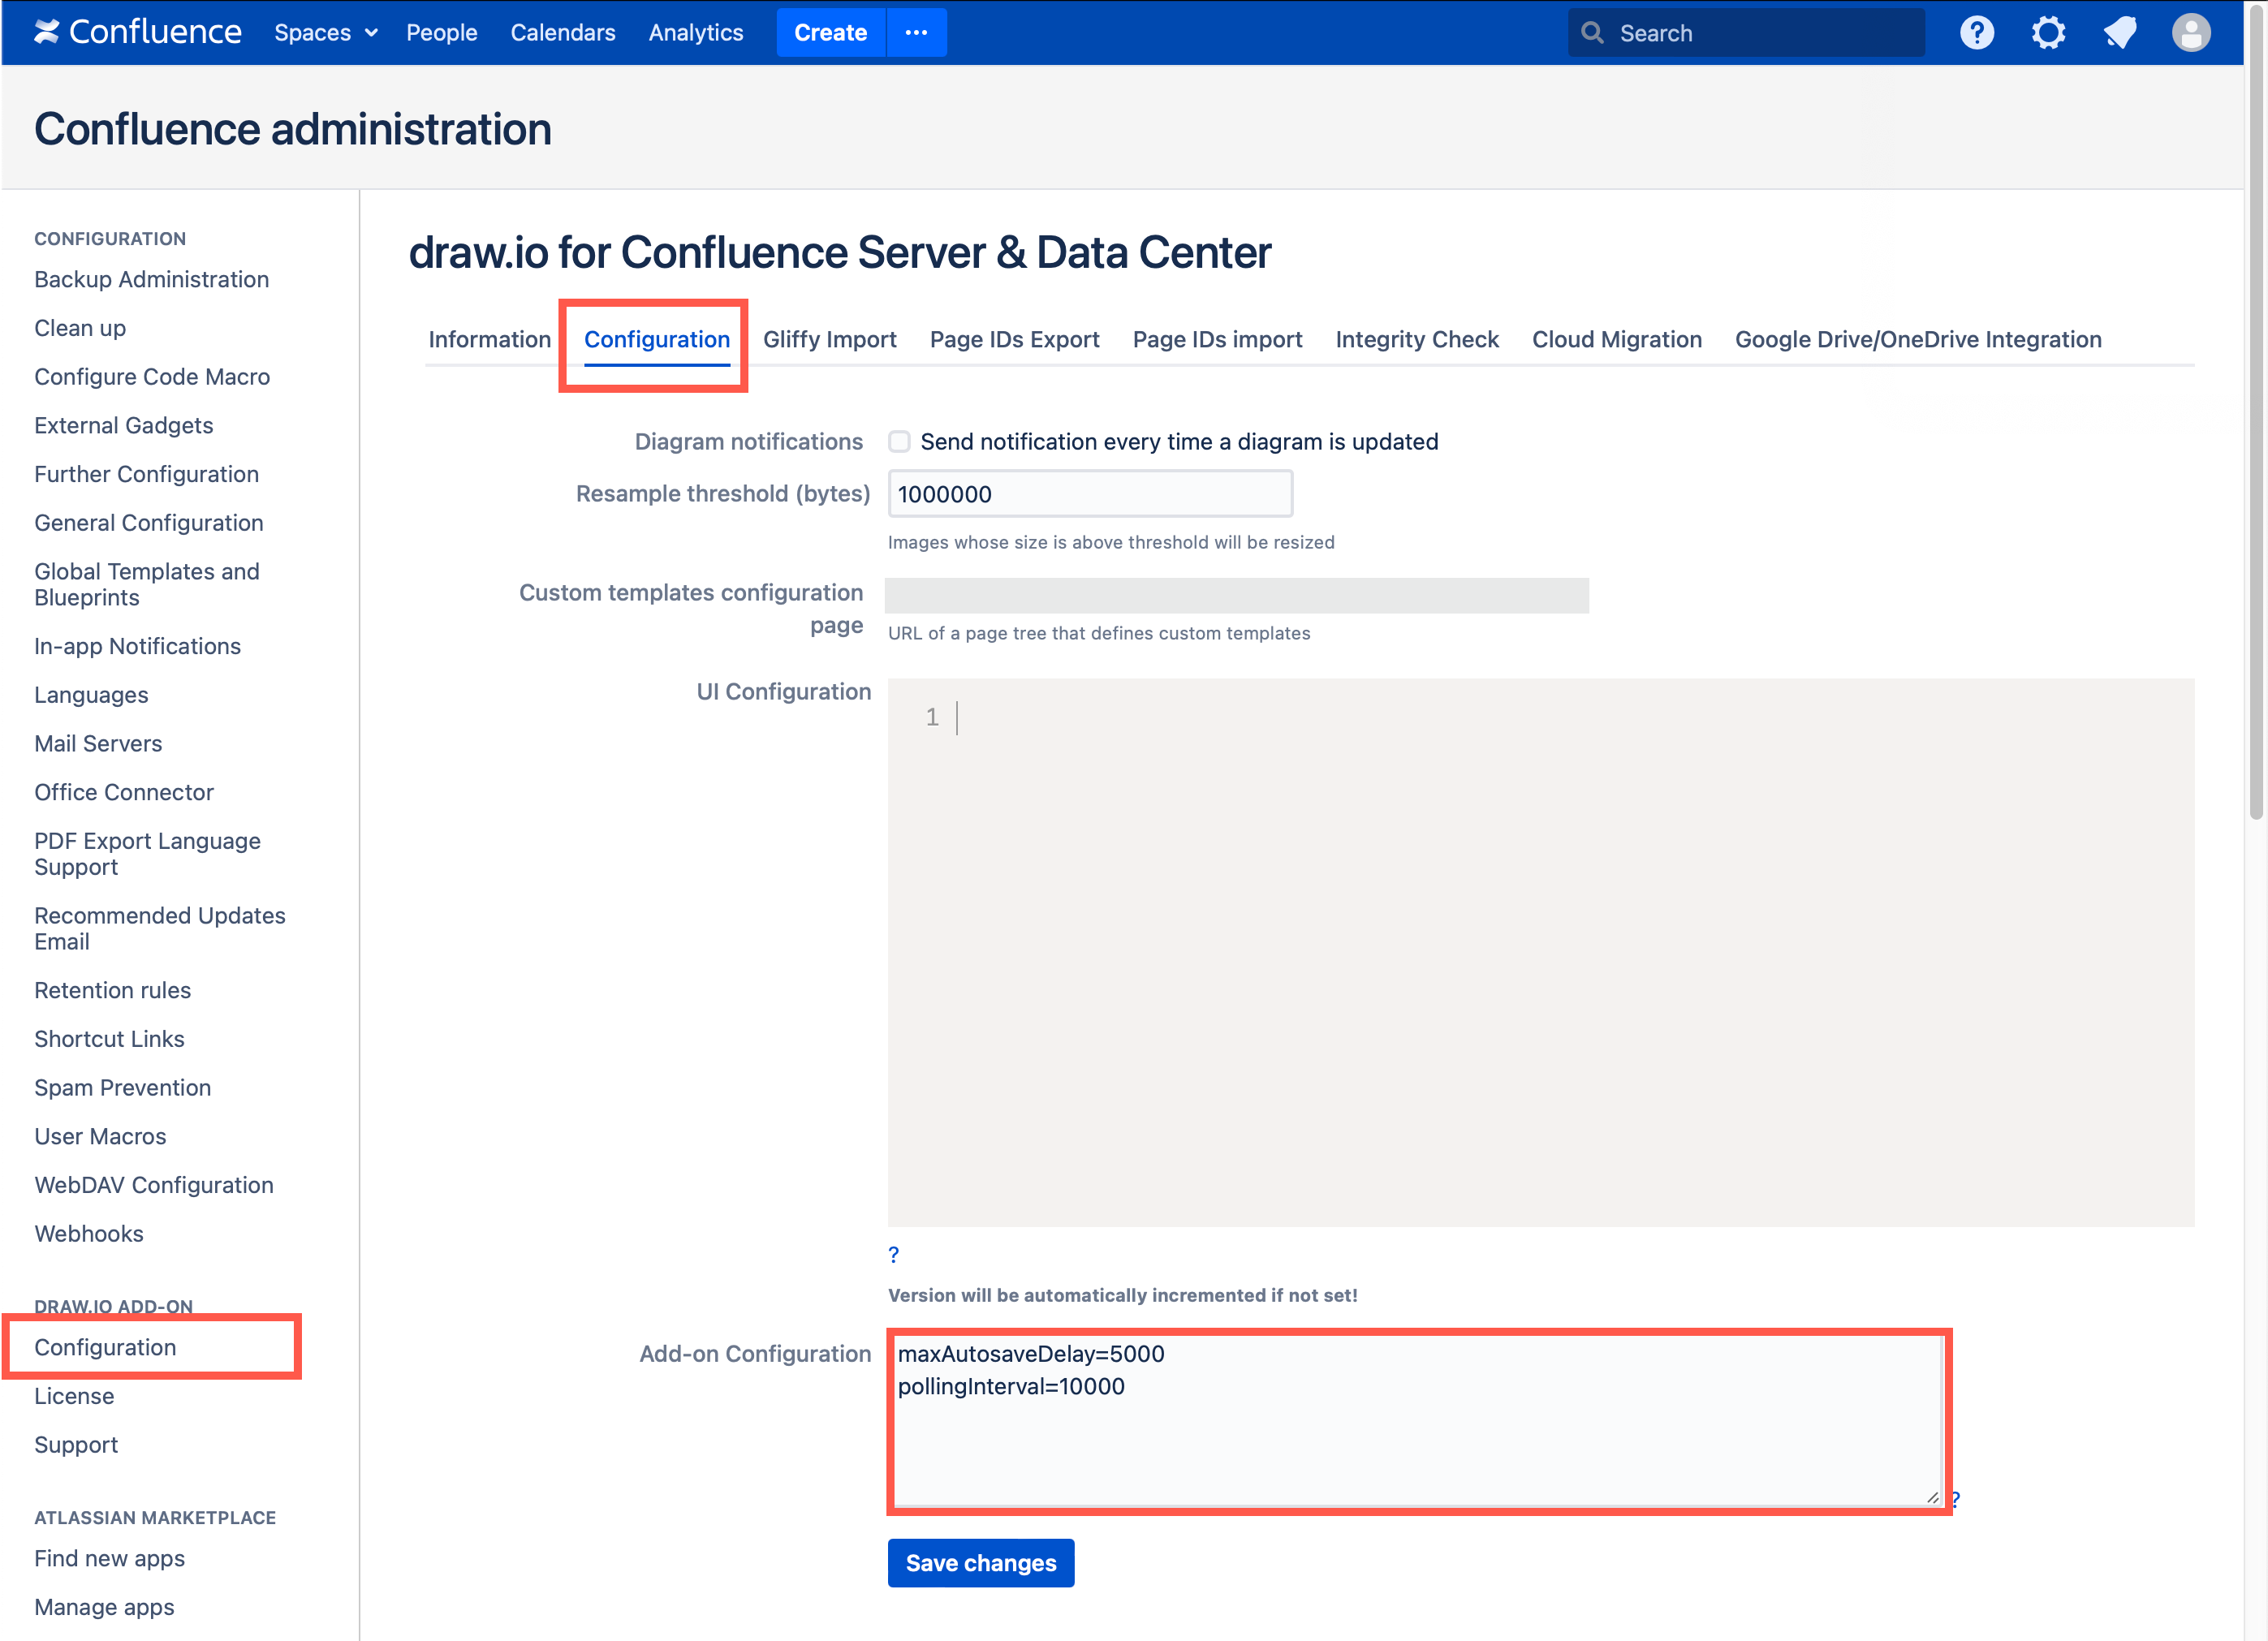
In the example above, we have set the polling interval to 10 seconds (which is 10,000 milliseconds).
Note: If you collaborate on extremely large and complex diagrams, you may need to set a longer polling interval.