
Double click and select a shape to add it

· 2 min read
draw.io
draw.io Team

The double click behaviour in draw.io has been updated in version 13.4.2 to be more convenient. Now, when you double click on the blank drawing canvas, you can quickly add a shape or text from the selector to your diagram.

You can choose from a range of common shapes from the General shape library using this method.

Tip: These shapes will use the style you have set to be the default style.

Double click on the drawing canvas then select a shape to add from the selector

Set a new default style for shapes and connectors

The shapes will use the default style. You can easily set a new default style.

  1. Add a shape or a connector and style it as you wish.
  2. Select the shape, then in the Style tab of the format panel on the right, click on Set as Default Style.

Note: You need to set new default styles for shapes and connectors individually.

Set a new default style in draw.io for shapes, connectors and text

Keyboard shortcut: Ctrl+Shift+D on Windows, or Cmd+Shift+D on macOS

Clear the default style

If you no longer want to add shapes in your custom default style, you can reset draw.io to use the original default style.

  1. Make sure nothing is selected.
  2. In the Style tab of the format panel on the right, click on Clear Default Style.

Keyboard shortcut: Ctrl+Shift+R or Cmd+Shift+R

See more shortcuts for working quickly with styles in draw.io

Support for hand-drawn diagrams with rough.js

· 5 min read
draw.io
draw.io Team

A more relaxed and informal style for shapes, fills and lines is often used in infographics, teaching materials, maps and reports so that the diagrams are little less sterile and boring. The rough style adds a hand drawn shading options, rough outlines and connectors, and handwritten text labels.

We spent a couple of hours integrating rough.js to update our existing, and fairly limited, comic style, and the result is pretty useful.

Note: This rough style is available in version 13.3.1 onwards.

Apply the rough style

  1. Select one or more shapes and connectors that you want to roughen.
  2. In the format panel on the right, click Sketch to apply the rough style to your selected shapes, labels and connectors.
Select shapes, click Sketch in the format panel, and save your diagram to make it more informal

Use the comic style

The rough sketch style appears more like a handdrawn diagram. Use the comic style for a more subtle effect.

  1. Select the shapes and connectors you want to apply the comic style to.
  2. In the Style tab of the format panel, click on Properties.
  3. At the bottom, change the Sketch Style dropdown to Comic.
Change the sketch style to comic for a more suble handdrawn effect

Change properties to customise the sketch style

There are many other properties you can change to customise the sketch style. Note that not all of these properties are applicable to the style you have chosen, but may apply to a different style.

Click on a shape or connector, then expand the Properties section in the Style tab of the format panel on the right. The most common properties are as follows.

  • Jiggle - how roughly or randomly the borders, connectors and the fill colours are drawn.
  • Fill Weight - set the width of the 'pen' used to draw the fill colour in a shape.
  • Hachure Gap - set the distance between the sketched fill lines.
  • Hachure Angle - set the direction of the sketched fill lines. Alternatively, change the angle with the Direction shape property.
  • Disable Multi Stroke - use only one pass of the 'pen' in the sketched border of a shape or a connector.
  • Disable Multi Stroke Fill - use only one pass of the 'pen' in the sketched fill colour in a shape.
  • Sketch Style - choose between the rough and comic sketch styles.
You can change many style properties to customise the rough and comic sketch styles in draw.io

Change the style of the entire diagram

You can set a new global style using one of the presets instead of selecting shapes and connectors and applying styles individually.

  1. Make sure nothing in the diagram is selected, then click on the Style tab in the format panel on the right.
  2. Select the style settings you want to use. Use the preset styles to change the colours of the shapes, their borders and text, connectors and the drawing canvas. Use the checkboxes to quickly change other style settings:
    • Sketch applies the rough style.
    • Rounded rounds the corners of the shapes.
    • Curved changes the connector style to curved.

Note: You will only see the style options that are applicable to the selected shape(s).

Use the styles in the Style tab on the right to change colours and shape and connector styles

Use the rough=1 URL parameter

Alternatively, add rough=1 as a URL parameter so the whole diagram has that style. For example, when using the free draw.io online diagram editor:

https://app.diagrams.net/?lightbox=1&rough=1&highlight=0000ff&edit=_blank&layers=1&nav=1&title=#Uhttps%3A%2F%2Fraw.githubusercontent.com%2Fjgraph%2Fdrawio-diagrams%2Fmaster%2Fblog%2Fgitflow-examples.drawio

A sketchy gitflow using the rough style

See a description of all of the supported URL parameters.

The rough style can make flowcharts a little less intimidating in training and onboarding materials.


A flowchart styled by rough.js


A flowchart styled by rough.js

Improved table shapes

· 8 min read
draw.io
draw.io Team

Tables have been overhauled in draw.io to be much more flexible and robust than the old HTML tables you previously used. With the new tables, you can choose from various layouts, drag to resize rows and columns, move rows by dragging them, and build cross-functional flowcharts within a table and its cells.

Tip: The entity shape used in UML entity relationship diagrams has also been updated to take advantage of the updated table features.

Add a table to a diagram

Use the table tool in the toolbar to add a table to your diagram as you would in Microsoft Word or Google Docs.

  1. With nothing selected in your diagram, click on the Table tool in the toolbar.
    Insert a table via the draw.io toolbar
  2. Hover over the squares until the number of rows and columns you want are highlighted, then click to insert a table on the drawing canvas. You can add more rows and columns later.

Add a table title when you insert a table

  1. Click on the Table tool in the toolbar.
  2. Enable the Title checkbox, then .
  3. Hover over the squares until the number of rows and columns you want are highlighted, then click to insert a table on the drawing canvas.
    You can insert a table title easily by holding down shift and inserting a table as normal

This automatically adds a title row that spans all of the columns.

Shortcut: Hold down Shift as you drag to select the size of the table. This will add a title row even if you haven't enable the Title checkbox.

Add text to table cells

Click once to select the table, then click again on a cell to select it. Enter your text just like you would a shape label.

Add text to a selected table cell just like you would a shape label in draw.io

Add a cross-functional flowchart (table)

Cross-functional flowcharts use categories to group steps in a business process, for example, how steps are assigned to different functional groups (such as departments), or stages of approval. Each category is represented by a vertical or horizontal swimlane. As standard flow charts are unable to show this information, many businesses prefer to use cross-functional flowcharts.

Create a table with horizontal and vertical swimlanes, where you can add process steps into the cells of the table, and join them with connectors to show the process flow.

  1. With nothing selected in your diagram, click on the Table tool in the toolbar.
  2. Select the Container checkbox, or hold down the Ctrl/Cmd key while you select a table with the number of rows and columns you need. Click to add the table with cross-functional swimlanes to the drawing canvas.
    Add a cross-functional table by selecting the Container checkbox in the Table tool in draw.io
  3. Select the table, click on a title cell, then enter the title text. If you are entering one of the row titles, as you enter the text will be centred - it will move into position when you finish adding the text.

As the cells in a cross-functional table function as container shapes, you can add shapes to them. Build your flowchart by placing the steps in their cells and then joining them with connectors.

Add text to a selected table cell just like you would a shape label in draw.io

Add columns and rows

  1. Select a cell inside of a table.
  2. Select the Arrange tab in the format panel on the right.
  3. Use the table tools to add a column or row before or after your selected cell or row. If you have selected the entire table, this will add a row or column at before the beginning or at the end of the table.
Use the table tools in the Arrange tab in the format panel to insert and delete columns and rows

Use a keyboard shortcut to copy a table row

  1. Click on a cell in your table, then click on it again to select the row.
  2. Hold down either Ctrl or Cmd, grab and drag a copy of the row to a new position in the table, or press Enter.

Move rows in a table

You can drag rows to new positions in the updated tables, either by selecting and grabbing the row itself, or using the reposition icon that looks like two horizontal lines on the right border of each row.

  • Select the row - click to select a cell, then click again to select the row - then drag it to a new position.
  • Alternatively, select the table (not a cell or a row/column), then grab and drag the row's reposition icon.
    You can drag rows around to reorder them in tables in draw.io

Note: The reposition icons on the right double as connection points. If you try to drag the reposition icons without first selecting the table, you'll attach a fixed connector at that point.

Resize rows and columns in a table shape

  • Grab and drag the row or column borders to resize the row or column.

Make sure you don't grab the reposition icon on the right border of a row - this will move a row, rather than resize the column.

You can also resize the table keeping all of its cells relative to each other - this is behaviour is enabled by default.

  • Select the table, then drag the round handle at the side of the table instead of the final column or row border.
  • Drag the orange diamond in the middle of the table below the table title row.

If you don't want to resize the other cells, change the table properties.

  1. Select the table (not a cell or a row/column).
  2. In the format panel on the right, expand the Properties section.
  3. Ensure the checkboxes for Resize last row and Resize last column are selected.
    Drag the row/column borders to resize them

Resize all swimlane titles

When you resize a cell in a cross-functional table, you will resize only that particular column's or row's title cell. You can resize all row or column titles at once so they are consistent.

  • Hold down Shift as you resize one of the column or row titles.

Delete rows or columns

  1. Select a cell inside of a table.
  2. Select the Arrange tab in the format panel on the right.
  3. Use the table tools to delete the selected column or row.
Use the table tools in the Arrange tab in the format panel to insert and delete columns and rows

Use the keyboard to delete a row

  1. Click on a cell in the table, then click on it again to select the row.
  2. Press the Delete key, or right click and select Delete from the context menu.

Merge and unmerge cells

Merge adjacent cells and unmerge merged table cells via the Arrange tab in the format panel, or using the Table tool in the Sketch whiteboard-like editor theme.

  • Merge is only available when you have selected multiple adjacent table cells.
  • Unmerge is only available when you have selected a merged cell in a table.
    Unmerge table cells in the draw.io and draw.io editor via the Arrange tab in the format panel

HTML tables are still available

The HTML table shapes are still available in the Misc shape library (part of the General shape library). Hover over the shapes to see their names.

The older HTML tables are available as shapes in the Misc library in draw.io

Create diagrams directly in VS Code

· 3 min read
draw.io
draw.io Team

Diagrams make coding go a lot smoother, especially when you are programming in teams. Having diagrams version tracked and right with the code they reference, and version tracked similarly in your code editor saves you time. You don't have to exit your workspace to switch to an external tool, or have to export/import every time you want to update a diagram.

Henning Dieterichs has created a third party diagramming integration for the VS Code editor that lets you do exactly that. Now you can create .drawio diagrams using the draw.io editor without leaving your code editor.

At the moment, you can create and edit .drawio, .dio, or .drawio.svg files, with .drawio.png file support under development. The diagram editor extension is bundled with the VS Code editor so you can code and diagram offline.

This is possible because draw.io is both open source, and supports being embedded in other applications.

See the full list of third-party integrations

Install the VS Code integration

  1. In the VS Code editor, click on the Extensions section in the left panel.
  2. Search for draw.io.
  3. Click Install on the Draw.io Integration created by Henning Dieterichs.
    Install the diagramming extension in the VS Code editor to create .drawio diagrams

Create a new diagram in VS Code

Create a new file as usual in the VS Code editor, and make sure the file extension is .drawio. A new blank diagram will be shown in the embedded diagram editor.

Edit a diagram within VS Code

  1. Open the folder in which you have stored your diagram, then select the diagram file.
  2. The diagram will open in right-hand pane. Resize the panes to get a larger diagramming area if required.
    Open and edit a diagram in the VS Code editor

Change the diagram editor to use a different theme

The diagram editor automatically uses the dark theme in the VS Code editor to match its default dark theme. You can change this easily.

  1. Select Preferences > Settings in the VS Code menu.
  2. Search for theme on the Settings page.
  3. Under Extensions, click on Draw.io integration, then select a new theme from the drop-down list. Learn more about the draw.io.
    Change the diagram editor theme via the VS Code Settings
    You can use a different diagram editor theme within the VS Code editor

Go to diagram.new to create a new diagram

· 2 min read
draw.io
draw.io Team

You can now create a new diagram even faster by going to diagram.new or diagrams.new instead of having to remember the full app.diagrams.net address for the online version of draw.io.

.new is the first and only domain that is devoted to helping you get things done fast. Each and every address that ends with .new is an action that lets you create or share content online.

The .new domain helps you create content quickly

Google has set up the .new domain exclusively to help you create and work with content quickly and easily. Several different types of content and actions are available already:

For example:

Instead of remembering the full URL of the websites and services, just enter the type of content you want to create or action you want to do and add .new to the end.

Only trusted apps

As there is a rigorous application process with a well-defined registration and security policy, Google only grants trusted and reliable applications or shortcuts a .new address.

Try it out

Go to diagram.new and create a new diagram.

If you have any questions, please post them to https://groups.google.com/forum/#!forum/drawio. If it's technical, you can open an issue at GitHub.

Simple draw.io embedding walk-through

· 5 min read
draw.io
draw.io Team

You can embed draw.io as an application within another app, where you store the diagram data in the host app. It takes around 15 minutes to get a basic example running.

Taking an example Stack Overflow page as a template, we've created our own, slightly altered version of the question. Double click on the diagram to open the online draw.io editor in a new window, make some diagram edits then click Save to save the changed diagram back to the page.

You can repeat the process to continue editing the diagram at a later time. Let's take a look at both the flow of this process and the code in the page that allows this to happen. If you view the page source you'll see on line 1695:

<img class="drawio" style="cursor:default;" src="data:image/png;base64,iVBORw0KGgoAAAANSUhE....

The image itself is placed in the page as a base64 encoded dataURI. We're doing this because there's no actual back-end in this example (refresh and you will lose your changes), we've nowhere to write an image to persist it.

The diagram data itself is embedded within the compressed text section of the PNG. When you double click on the image we open a new window and load draw.io in embedded mode in that window:

<script />
// Edits an image with drawio class on double click
document.addEventListener('dblclick', function(evt)
{
var url = 'https://embed.diagrams.net/?embed=1&ui=atlas&spin=1&modified=unsavedChanges&proto=json';
var source = evt.srcElement || evt.target;

if (source.nodeName == 'IMG' && source.className == 'drawio')
{
if (source.drawIoWindow == null || source.drawIoWindow.closed)
{
// Implements protocol for loading and exporting with embedded XML
var receive = function(evt)
{
if (evt.data.length > 0 && evt.source == source.drawIoWindow)
{
var msg = JSON.parse(evt.data);

// Received if the editor is ready
if (msg.event == 'init')
{
// Sends the data URI with embedded XML to editor
source.drawIoWindow.postMessage(JSON.stringify
{action: 'load', xmlpng: source.getAttribute('src')}), '*');
}
// Received if the user clicks save
else if (msg.event == 'save')
{
// Sends a request to export the diagram as XML with embedded PNG
source.drawIoWindow.postMessage(JSON.stringify(
{action: 'export', format: 'xmlpng', spinKey: 'saving'}), '*');
}
// Received if the export request was processed
else if (msg.event == 'export')
{
// Updates the data URI of the image
source.setAttribute('src', msg.data);
}

// Received if the user clicks exit or after export
if (msg.event == 'exit' || msg.event == 'export')
{
// Closes the editor
window.removeEventListener('message', receive);
source.drawIoWindow.close();
source.drawIoWindow = null;
}
}
};

// Opens the editor
window.addEventListener('message', receive);
source.drawIoWindow = window.open(url);
}
else
{
// Shows existing editor window
source.drawIoWindow.focus();
}
}
});
</script>
  • embed=1 URL parameter tells draw.io to operate in embedded mode.
  • protocol=json means we are using the JSON protocol for message passing. Always use this mode for now.
  • postMessage is then used to communicate the diagram data.

Note that you could open the diagram in an iFrame instead of a new window, and this might make the flow clearer for the user.

In this case, create an iFrame at the start of the function:

var iframe = document.createElement('iframe');
iframe.setAttribute('frameborder', '0');

var close = function()
{
window.removeEventListener('message', receive);
document.body.removeChild(iframe);
};

Append the iFrame to the window at the end of the function, after starting to listen for messages:

window.addEventListener('message', receive);
iframe.setAttribute('src', editor);
document.body.appendChild(iframe);

You might also want to make the iFrame completely cover the initial page via CSS:

iframe {
border:0;
position:fixed;
top:0;
left:0;
right:0;
bottom:0;
width:100%;
height:100%
}

When the draw.io editor is loaded in the new window/iFrame it's just the static application, there's no data. We use the message passing protocol to load in the data to draw.io, after receiving the "init" message from draw.io to tell us that it is ready.

Sequence diagram example

Edit the diagram in the editor and click Save when finished. The additional messages sent after saving is to provide granularity for requesting another format, in this case by asking for the PNG+XML format via an Export. In our case we also exit the editor when the export is complete, but you could leave it open and wait for the user to explicitly Exit the editor before closing it.

The XML embedded PNG as a base64 dataURI is saved back on top of the src attribute of the image and this results in the page being updated with the new image.

Lastly, it's important to distinguish between the static draw.io application and the data flow in embedded mode. Our online editor is loaded as a static application in the draw.io window, but the diagram data is passed entirely client-side between windows, it's never sent back to, or sourced from, the draw.io application server. This means you control and store your data, and you only use the diagramming functionality provided by draw.io to edit and change that data.

Diagrams attached to Jira Server issues are now versioned

· 4 min read
draw.io
draw.io Team

Versioning is built into Confluence, and diagrams attached to pages using the draw.io app for Confluence takes advantage of this. When you edit a diagram, the draw.io app creates a new page version so you can easily restore an older version of your diagram.

If you are using draw.io for Jira Cloud, we recommend that you embed diagrams stored in your Confluence instance to take advantage of its versioning and real-time-collaboration tools.

If you are using diagrams attached to issues in Jira Server, these are now also versioned, but in a different way.

The draw.io app now adds a compressed zip file to your Jira Server issues containing multiple diagram files. When you open the attached diagram file from the right panel, you can access the revision history of your diagram via the menu.

Add a diagram to an issue on Jira Server

Once you have installed the draw.io app into your Jira Server instance, you can create diagrams in your issues.

  1. Click on More in the issue toolbar, then select Add draw.io Diagram from the menu.
    Add a draw.io diagram to a Jira Server issue via the issue toolbar
  2. The draw.io diagram editor will open. Create your diagram. When you are finished, click on the Save & Exit button in the top right.
  3. Add a filename, then click Save.

Your diagram will be displayed in the right panel of the issue in the draw.io Diagrams section, and the file will appear in the Attachments section. You can immediately see which version the diagram is by the number in square brackets after the name of the file above the preview on the right.

The draw.io diagram is displayed on the right of your Jira Server issue

Restore a diagram revision in draw.io

  1. Hover over the diagram preview on the right, and click on the pencil icon to edit your diagram.
    Edit an existing draw.io diagram attached to a Jira Server issue
  2. In the editor, select File > Revision History from the menu to open dialog with a list of diagram versions.
    Edit an existing draw.io diagram attached to a Jira Server issue
  3. Each revision shows you who modified it, and when it was modified. Click on a version to see a preview of the diagram. If you want to restore a particular version, click on it, then click Open.
    Restoring an older version of your draw.io diagram in Jira Server creates a new version - no information is lost

This creates a new version of the diagram and adds it to the attached file - no changes are lost.

Tip: To delete a draw.io diagram from your Jira Server issue, hover over the diagram on the right panel of your issue and click on the trash can icon (delete).

See diagram revisions inside the attached file

As the attached diagram is a compressed zip file containing multiple diagram files and some metadata, you can open it on your computer and look at each diagram individually. You can also open the attachment file or any of the included XML diagram files in our online draw.io editor.

  1. Download the attachment to your computer and unzip it using your favourite decompression tool.
  2. The most recent diagram version can be seen in the diagram folder, and older versions under the history folder.
    The file structure within a versioned draw.io attachment from Jira Server

How to use diagrams in Google Docs

· 4 min read
draw.io
draw.io Team

Export your draw.io diagrams to PNG image files and them import them into your Google Docs, Slides and Sheets - drag and drop the image file into your document.
Export a draw.io diagram to a PNG image, then import it into your Google document

Note: Google has applied new security limitations that limit how apps access files from Google Drive. If you have old, installed versions of these apps, you may be able to continue to embed and work with diagram files in your documents.

Learn more about the changes to the draw.io apps for Google documents

The now deprecated draw.io add-on for Google Docs (and Slides and Sheets) allowed you to embed draw.io diagrams stored in Google Drive into your documents. When the diagram files were updated on your Google Drive, you could update them inside your document to show those changes.

Currently, when you update a draw.io diagram stored on Google Drive or elsewhere, you will need to export an updated PNG image file, and then re-import that image into your Google document.

It's easy to import images of diagrams in Google Docs

Add an image of a diagram to a Google document

  1. Open your .drawio diagram file in the draw.io editor (either our online editor or drawio Desktop)
  2. In the draw.io menu, select File > Export As > PNG, then click Export to save your diagram as an image.
  3. In your Google Document, Slide, or Sheet select Insert Image from the menu, or drag and drop your image into your document.

You can embed images of diagrams in the same way in Google Docs, Sheets and Slides.

Export a draw.io diagram to a PNG image, then import it into your Google presentation slide

Change how your diagram is displayed

Change the text wrap around the diagram: Select the image of a diagram, then select one of the text-wrap symbols in the toolbar.

Change the whitespace around the diagram: Select the image then select a new value from the Margin dropdown.
Select a new margin or text-wrap style around your diagram in your Google Document

Crop your diagram: Select the image of a diagram, click the Crop Image tool in the toolbar, then drag the black borders that appear on your selected diagram to crop it.
Use the crop image tool to crop your diagram in your Google Document

Reposition your diagram: Drag the image to the right or the left to reposition it within your document.

Recolour the diagram: Select the image of your diagram, then click Image options in the toolbar. Click the Re-color dropdown and apply a colour filter.
Apply a new colour filter to your diagram in your Google document

Resize the diagram: Select the image, then drag any of the square handles around the edge of the diagram to resize it.

Rotate your diagram: Select the image of your diagram, then drag the circular handle at the top of the diagram to rotate it.
Apply a new colour filter to your diagram in your Google document

We are sponsoring FOSDEM 2020

· 2 min read
draw.io
draw.io Team

FOSDEM is a free two-day event held each year, organised by volunteers, to promote the use and development of free and open source software. Open source software developers and users can meet, share ideas, and collaborate.

FOSDEM’20 will be held at the Université Libre de Bruxelles Solbosch Campus in Brussels, Belgium on 1-2 February 2020.

There is no registration and the event is free to attend!

We are a sponsor of FOSDEM’20

As an open source technology stack and one of the world’s most widely used browser-based diagramming applications, we are proud to be sponsoring FOSDEM’20 and supporting open source developers around the world.

Open source has a huge number of advantages for customers. With draw.io you get the following benefits.

  • Increased trust – anyone can scrutinise the source code.
  • Extendable – open source encourages third-parties to develop integrations with various platforms.
  • No lock-in SaaS – you’ll always have access to the desktop app even if the website goes away.

Our goal is to provide free, high quality diagramming software for everyone and disrupt the world of diagramming tools.

draw.io is sponsoring the FOSDEM'20 conference for open source developers

FOSDEM: hundreds of open source speakers and events

With thousands of attendees from all over the world taking place, it’s one of the largest events for open source projects. The 400+ speakers and 500+ events are organised by a hard-working team of volunteers.

In this 20th instalment of the conference, it’s free to participate in more than 50 developer rooms where talks, hacking sessions and open discussions are held on a huge variety of topics, all related to open source development and projects.

In addition to the developer rooms, there are keynotes, main track talks, as well as stands you visit to chat in person with open source project developers. Certification organisations also run several exams during the conference that visitors can take.

Keep an eye on the FOSDEM website or follow @fosdem on Twitter as the schedule of speakers and events are confirmed.

Updates to the draw.io desktop app

· One min read
draw.io
draw.io Team

DESKTOP VERSIONS PRE 10.7.5 ARE STRONGLY RECOMMEND TO DOWNLOAD AND INSTALL A NEW DESKTOP BUILD {: .alert .alert-danger}

Desktop versions prior to 10.7.5 have a critical security flaw, so we’re disabling them all, sorry. To resolve, just go to the draw.io desktop project on GitHub, https://github.com/jgraph/drawio-desktop/releases, and download the latest version for your platform. Once that’s installed, you’re good to go again.

Versions of draw.io Desktop from 10.7.5 onwards run completely isolated from the internet, so the security hole can’t reappear.

Use Cloudcraft to export your AWS architecture to a .drawio diagram

· 4 min read
draw.io
draw.io Team

Using Cloudcraft, you can securely connect to cloud environments and infrastructure components via your architecture diagrams where statistics, resource information and more is updated in real time. The 3D isometric view that Cloudcraft uses is familiar to engineers and IT staff as it often matches the tools they learned on. The automatic updates driven from your company's live systems makes Cloudcraft a fantastic tool for monitoring your AWS cloud infrastructure. The statistics are also helpful to estimate costs when you want to make changes to your system.
Examples of Cloudcraft infrastructure diagrams exported to draw.io

Get started with your AWS infrastructure using the Amazon Architecture Center's training section and the reference architectures.

AWS architecture documentation also needs to be static

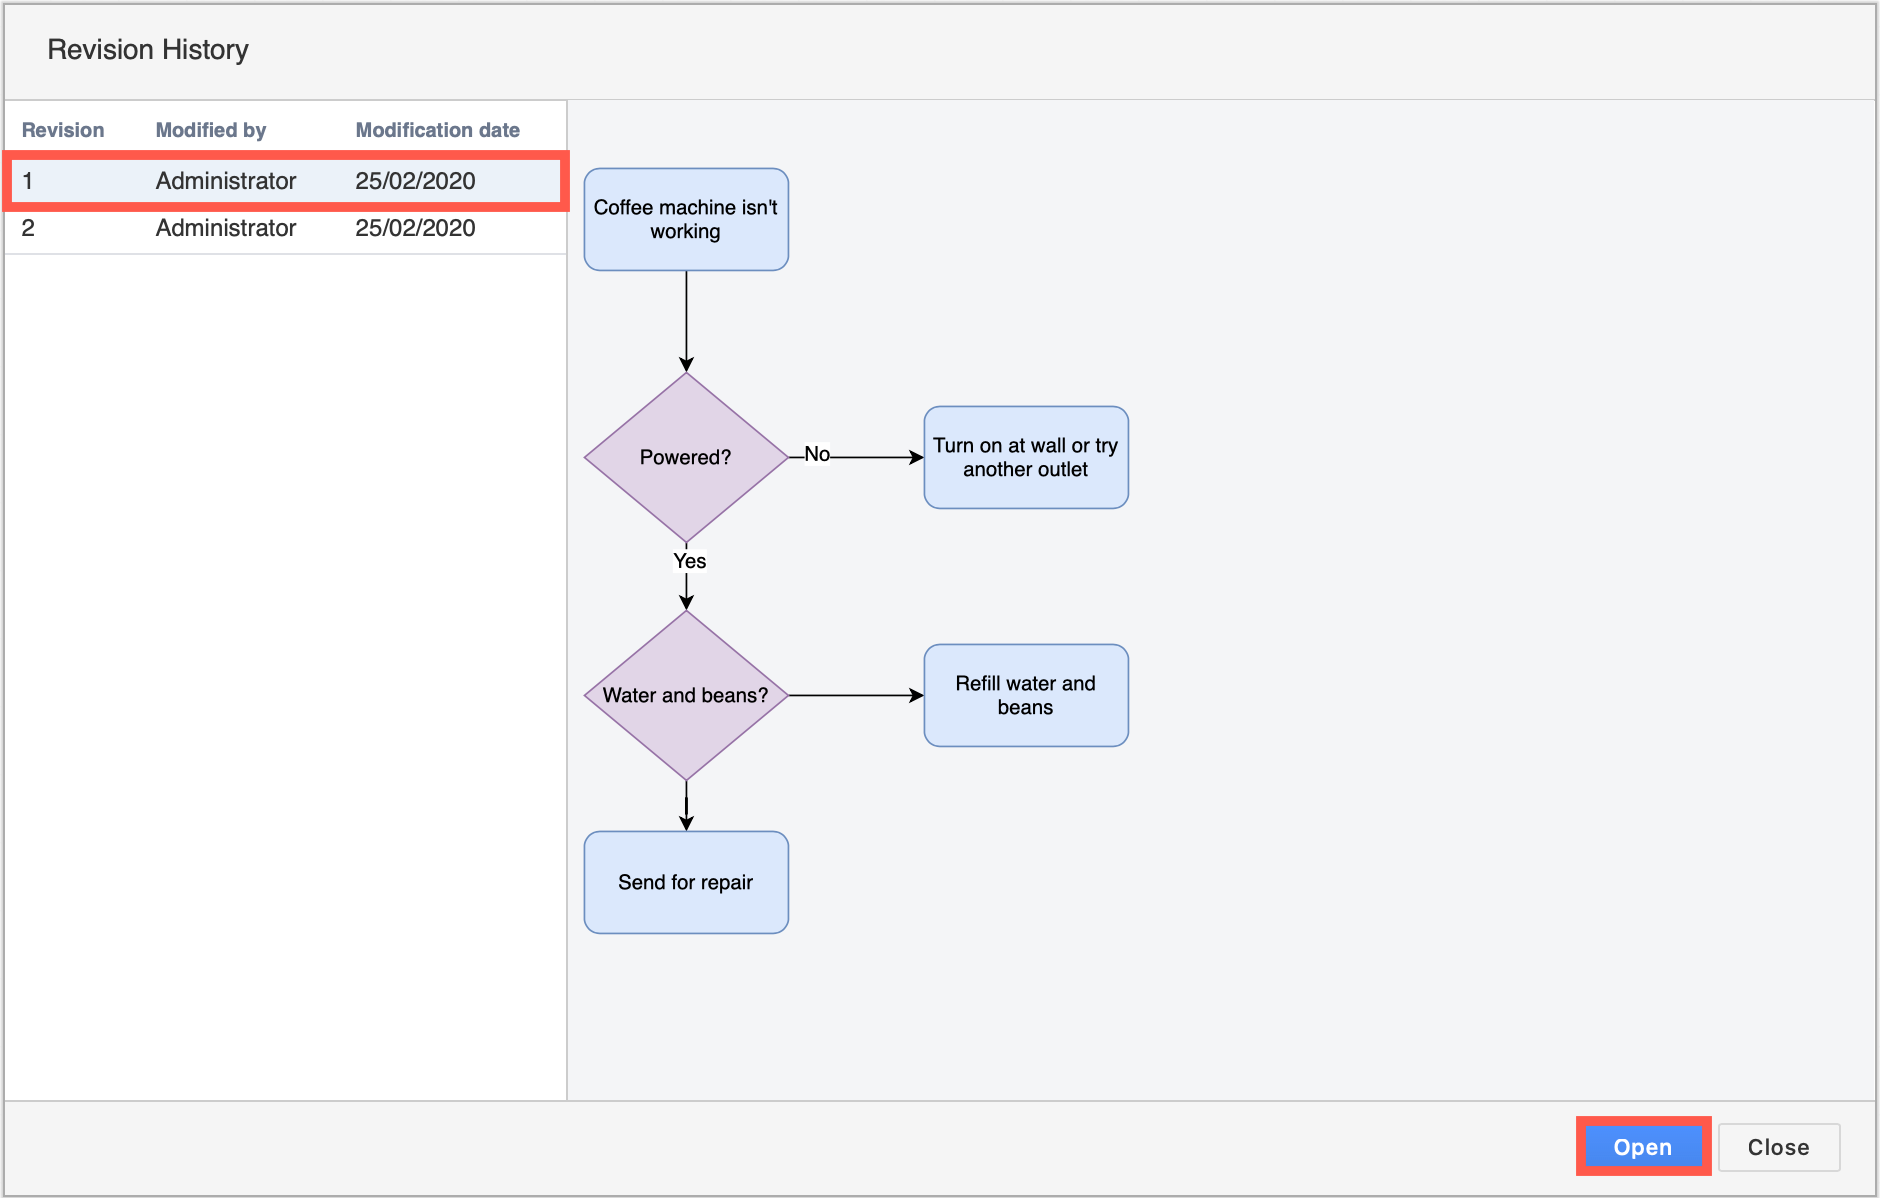
To document how your AWS infrastructure changes over time, you need snapshots - diagrams before and after you make changes. You can't use a live system to document what happened in the past. This is especially important to comply with audit and security standards, and to show progress on your IT infrastructure projects.

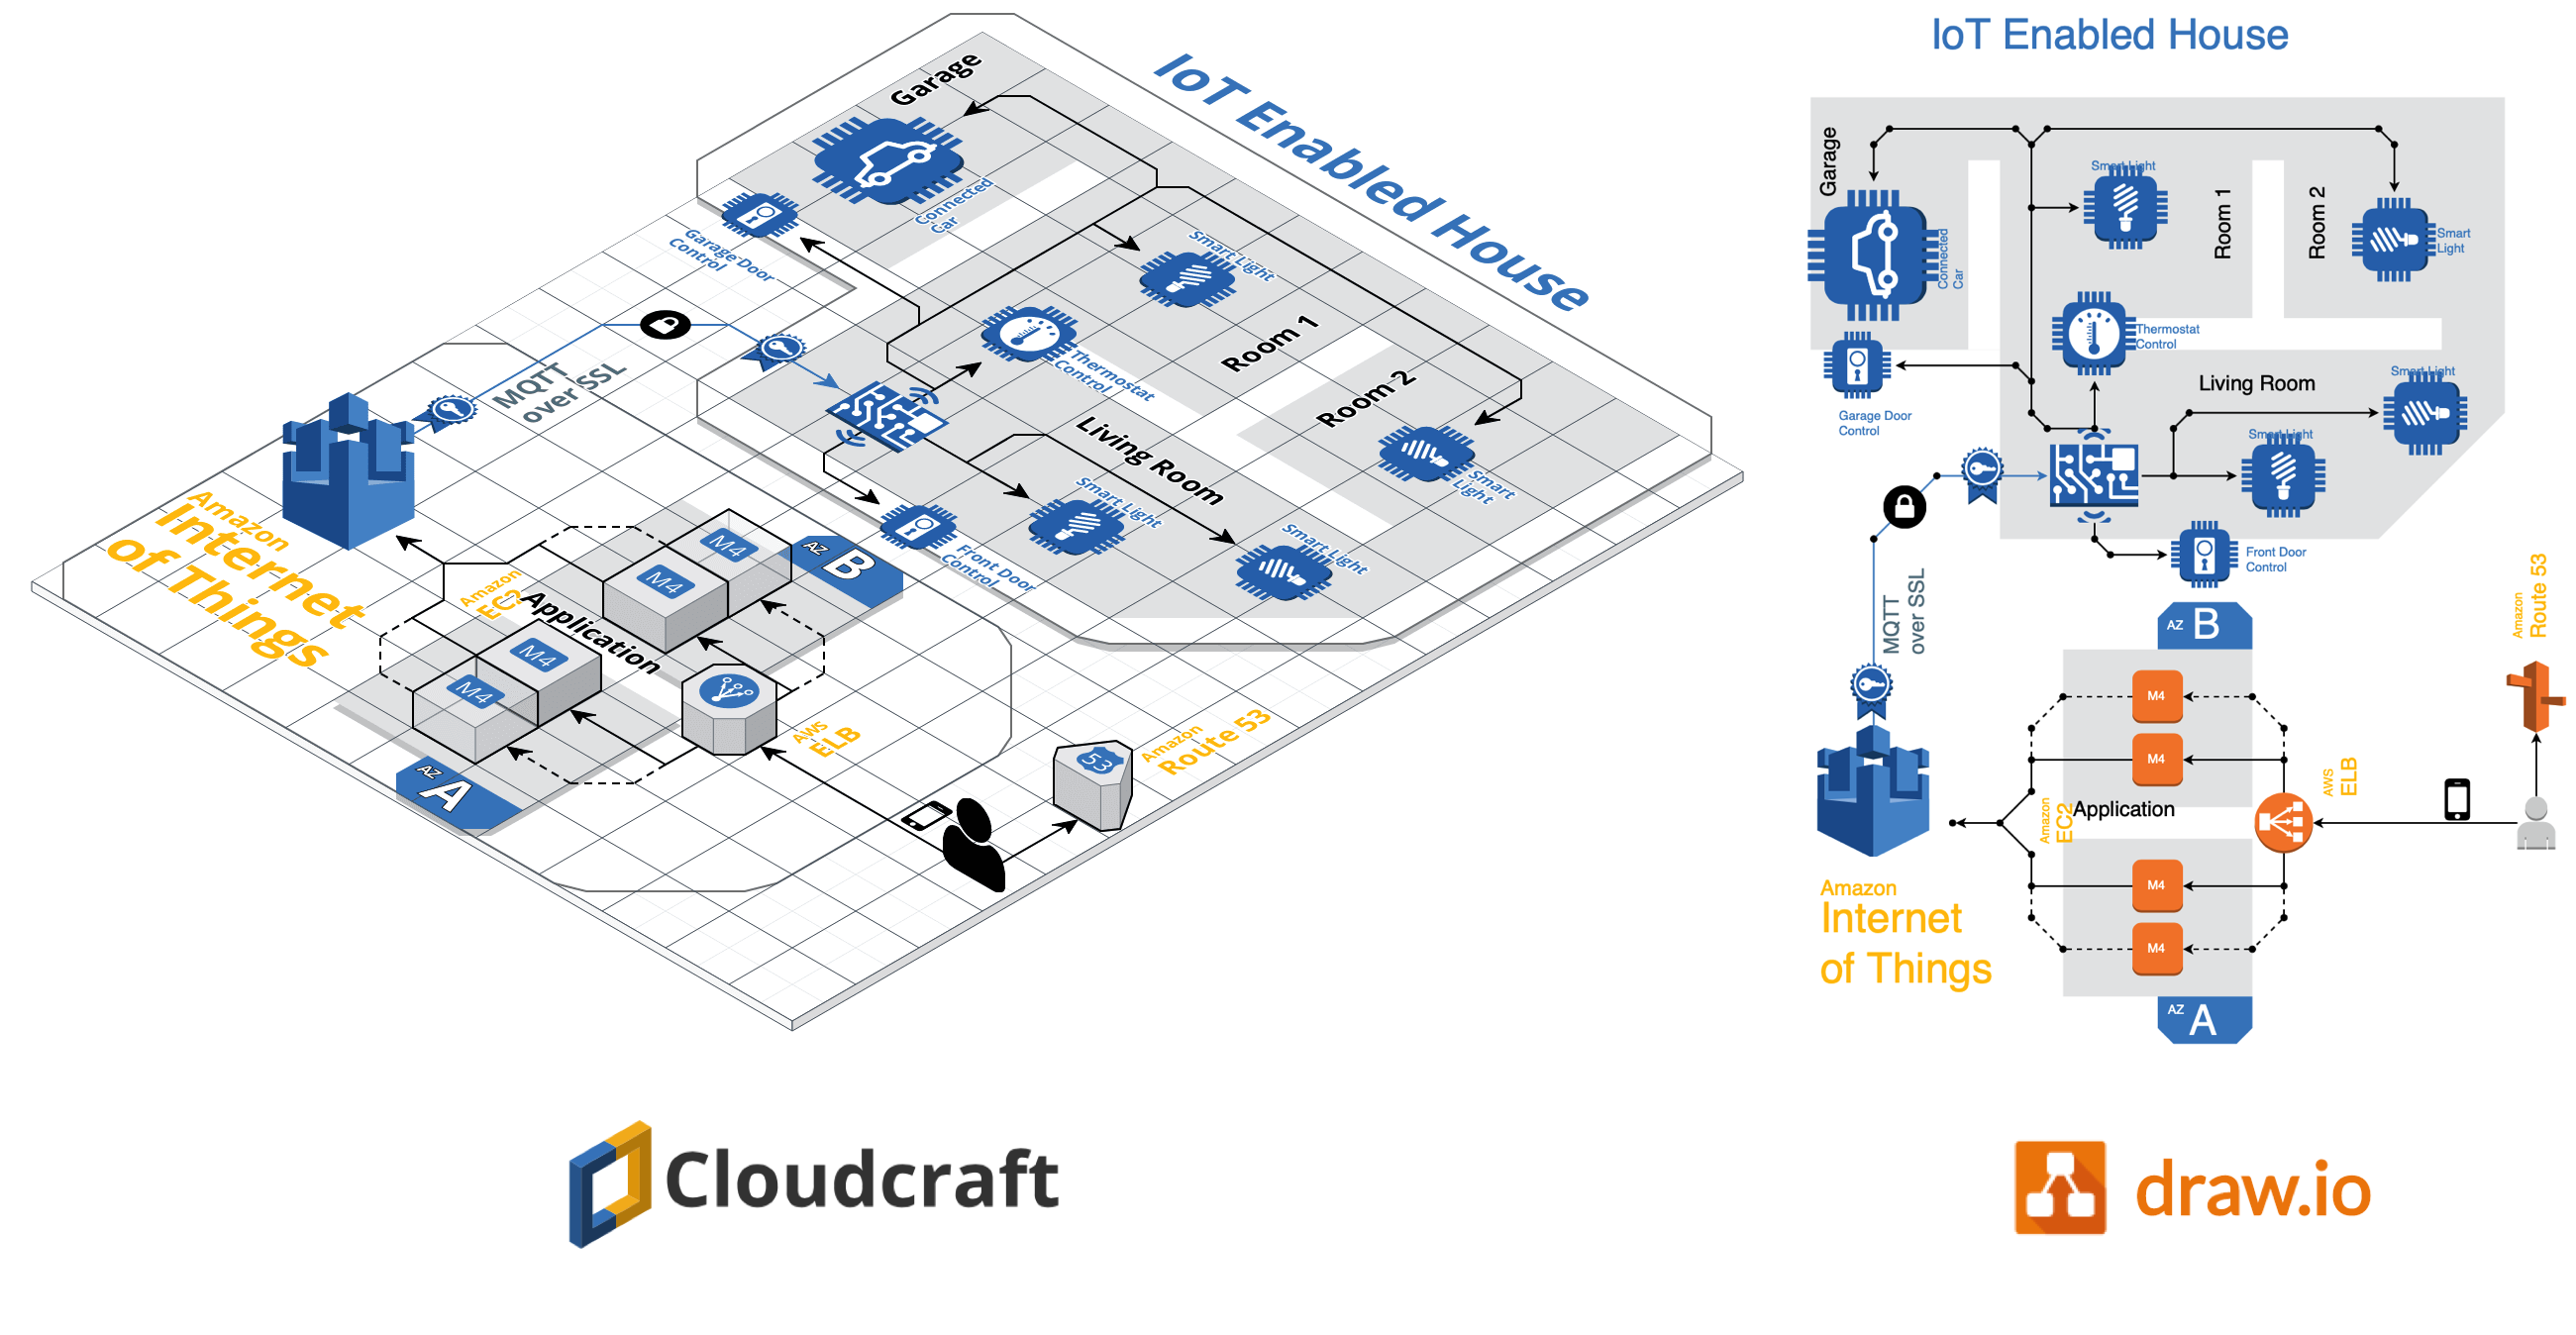
Export the various stages of your AWS infrastructure's development into static diagrams. You can easily share these diagrams, open and edit them in draw.io, incorporate them into official documentation and reports, and store them in your revision control system to ensure compliance and painless audits.

Cloudcraft makes it easy to export to draw.io.

How to export from Cloudcraft

Note: Please allow pop-ups in your browser.

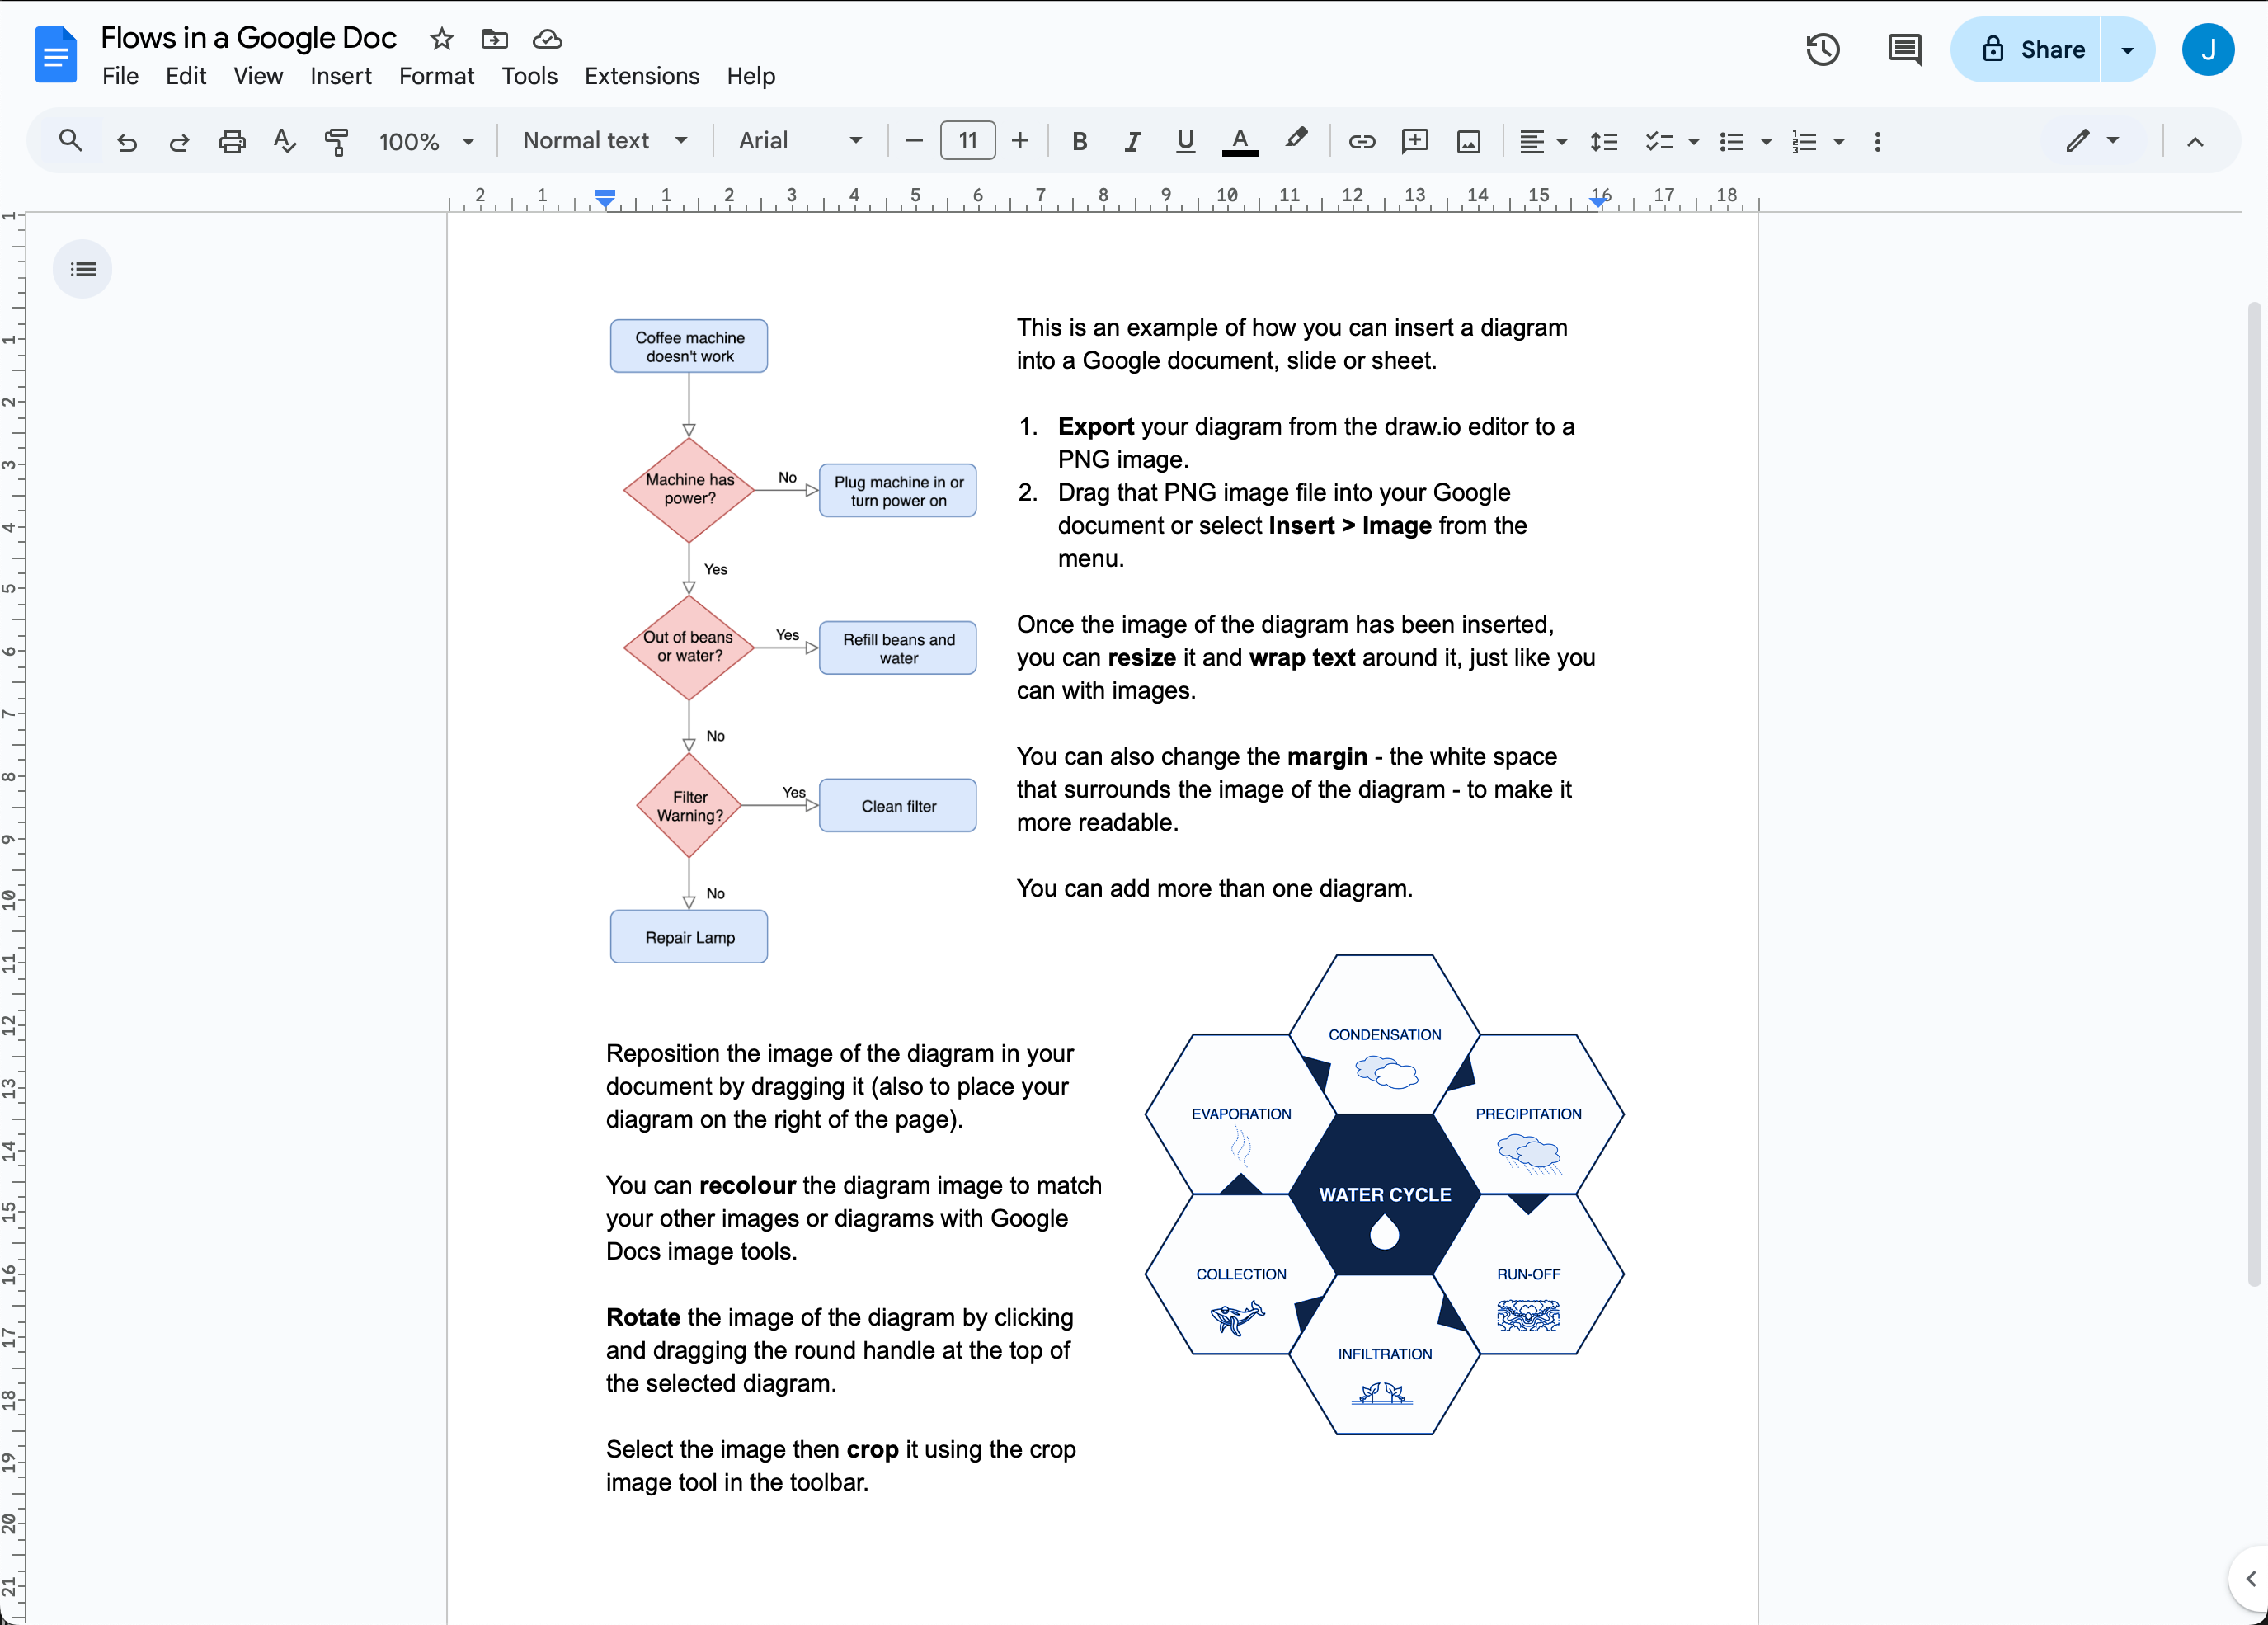
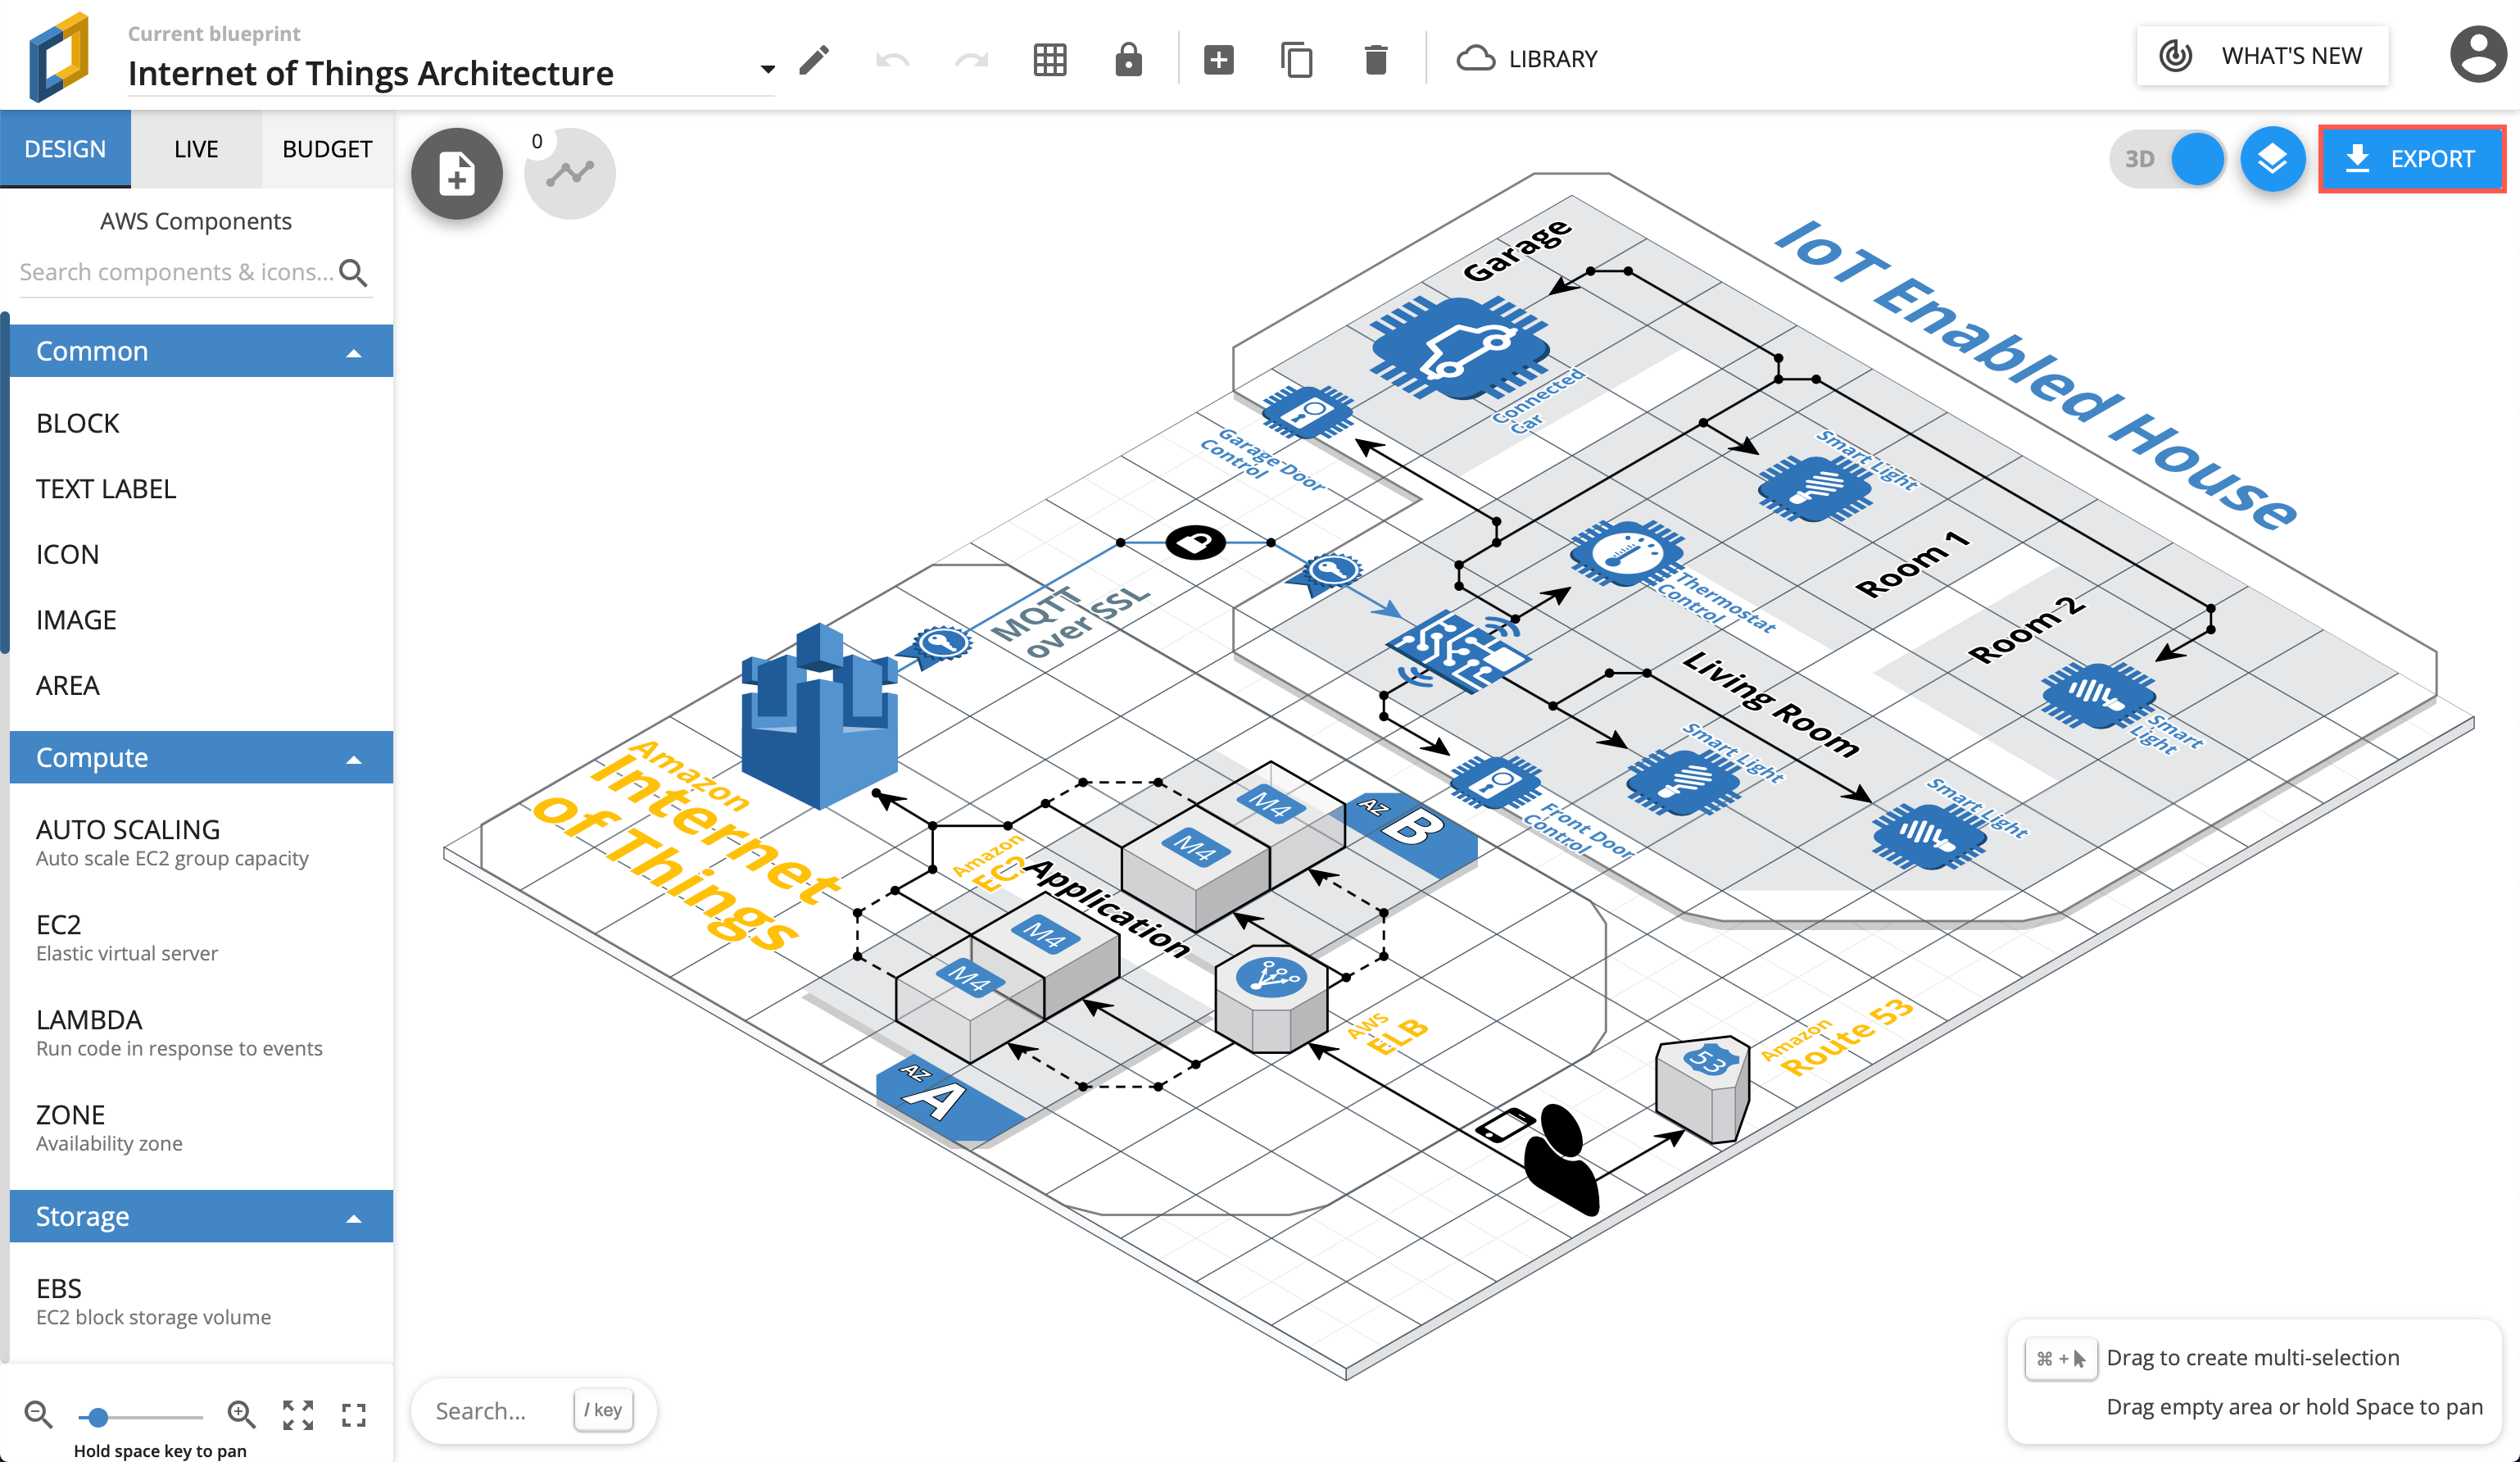
In your Cloudcraft account, in the top right of the drawing area, click Export > 2D export to draw.io

Export AWS infrastructure from Cloudcraft

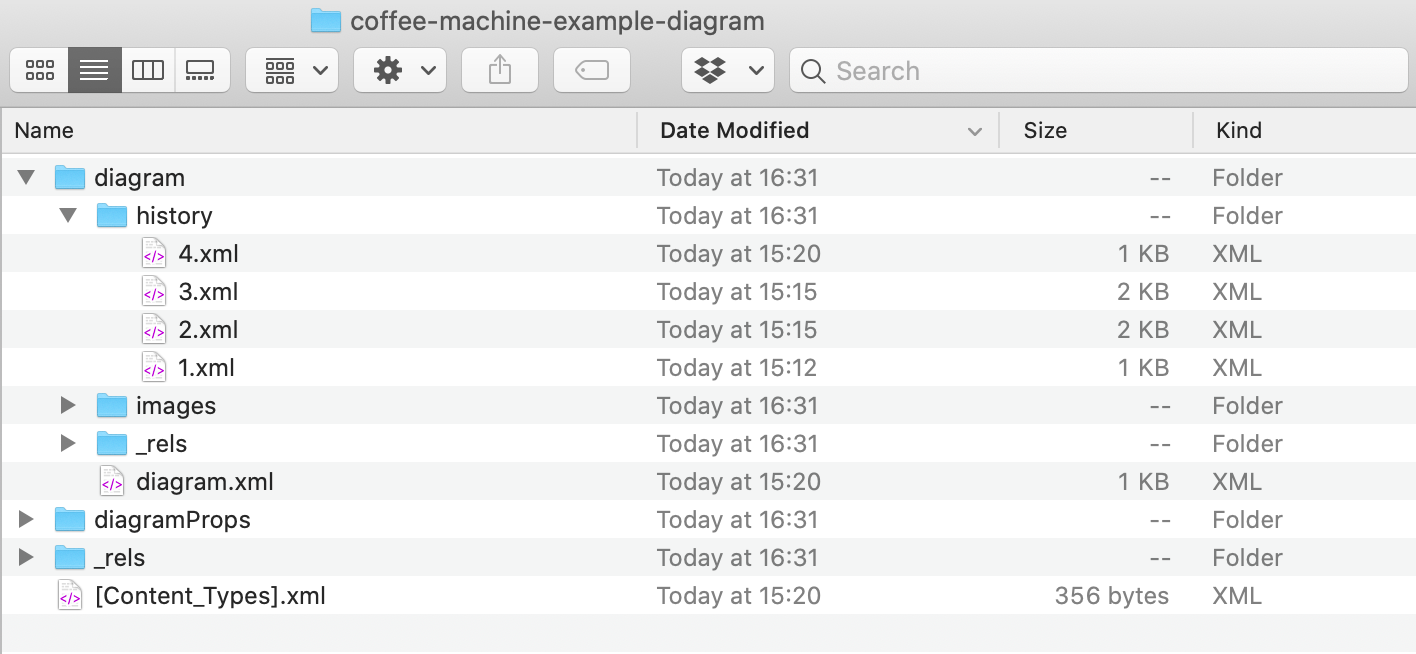
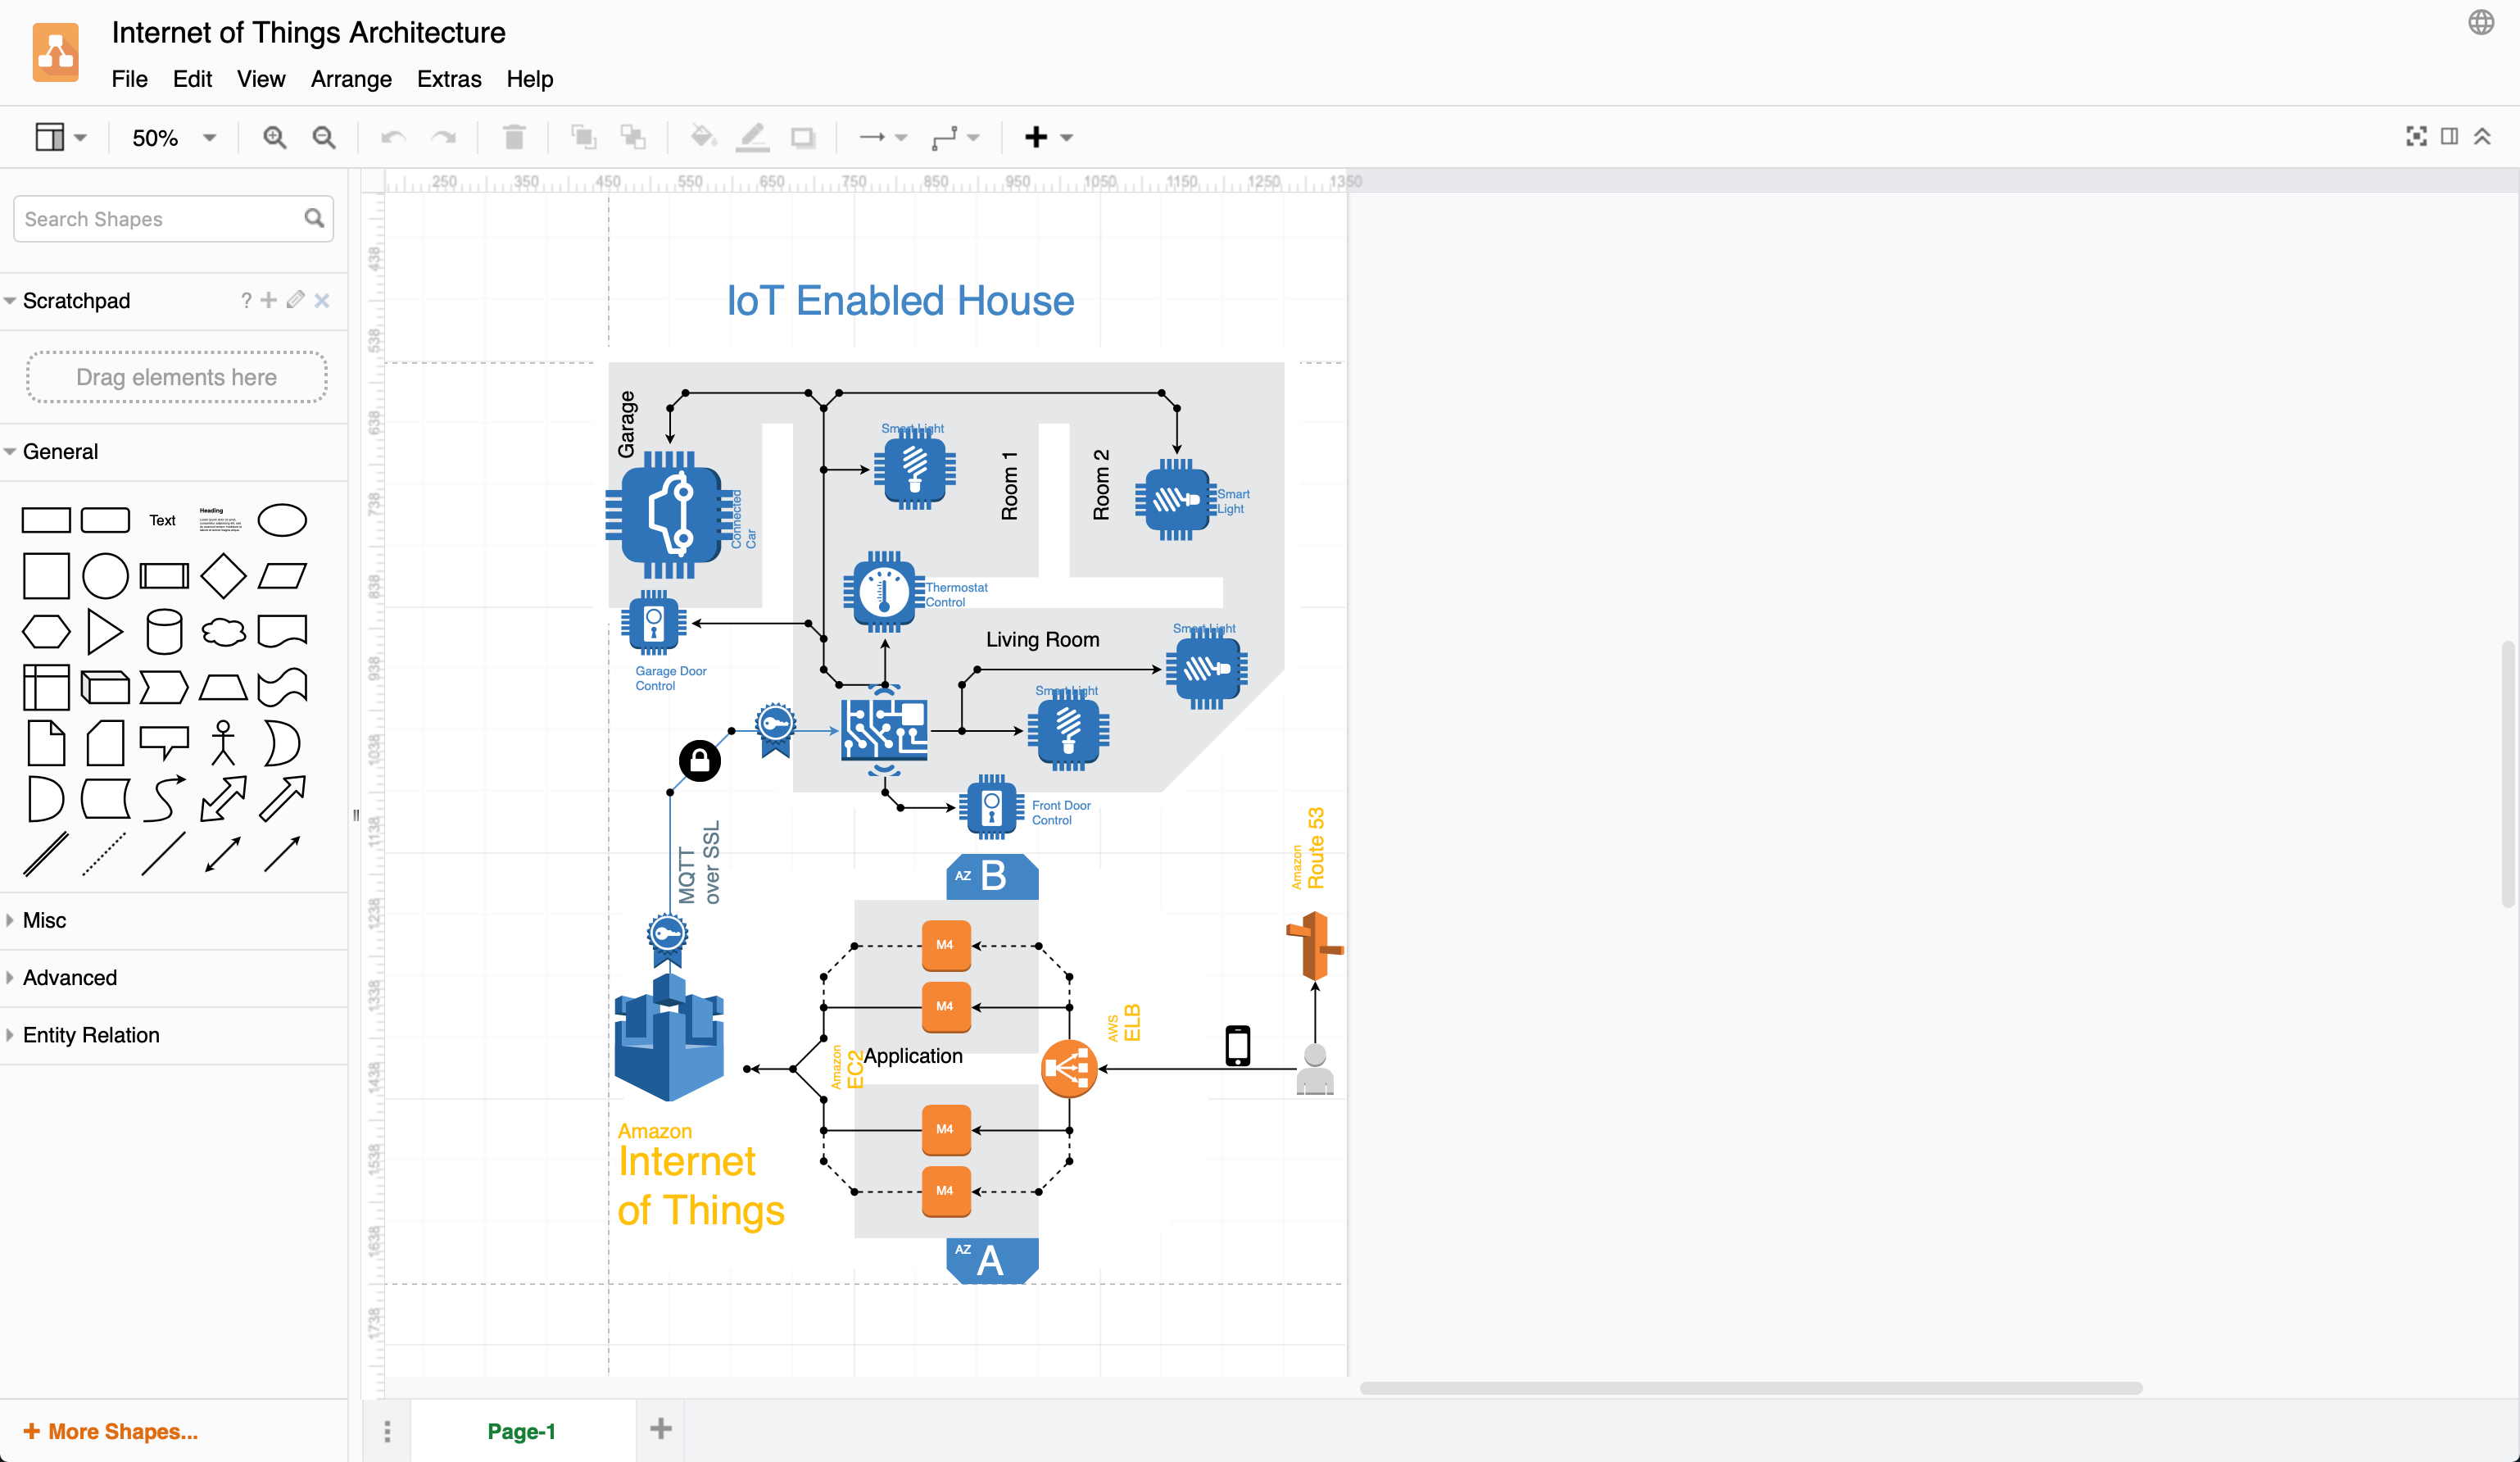
The draw.io version of your AWS architecture will open in a new tab in your browser. You can now save this diagram file to your version control system, cloud storage platform, or whichever location you have chosen to maintain a record of your infrastructure.

Exported 2D IoT AWS infrastructure from Cloudcraft into draw.io

When exporting to draw.io, Cloudcraft may not use the most recent AWS shapes in your diagram, but it's easy to update your diagram to the newest AWS shapes yourself.

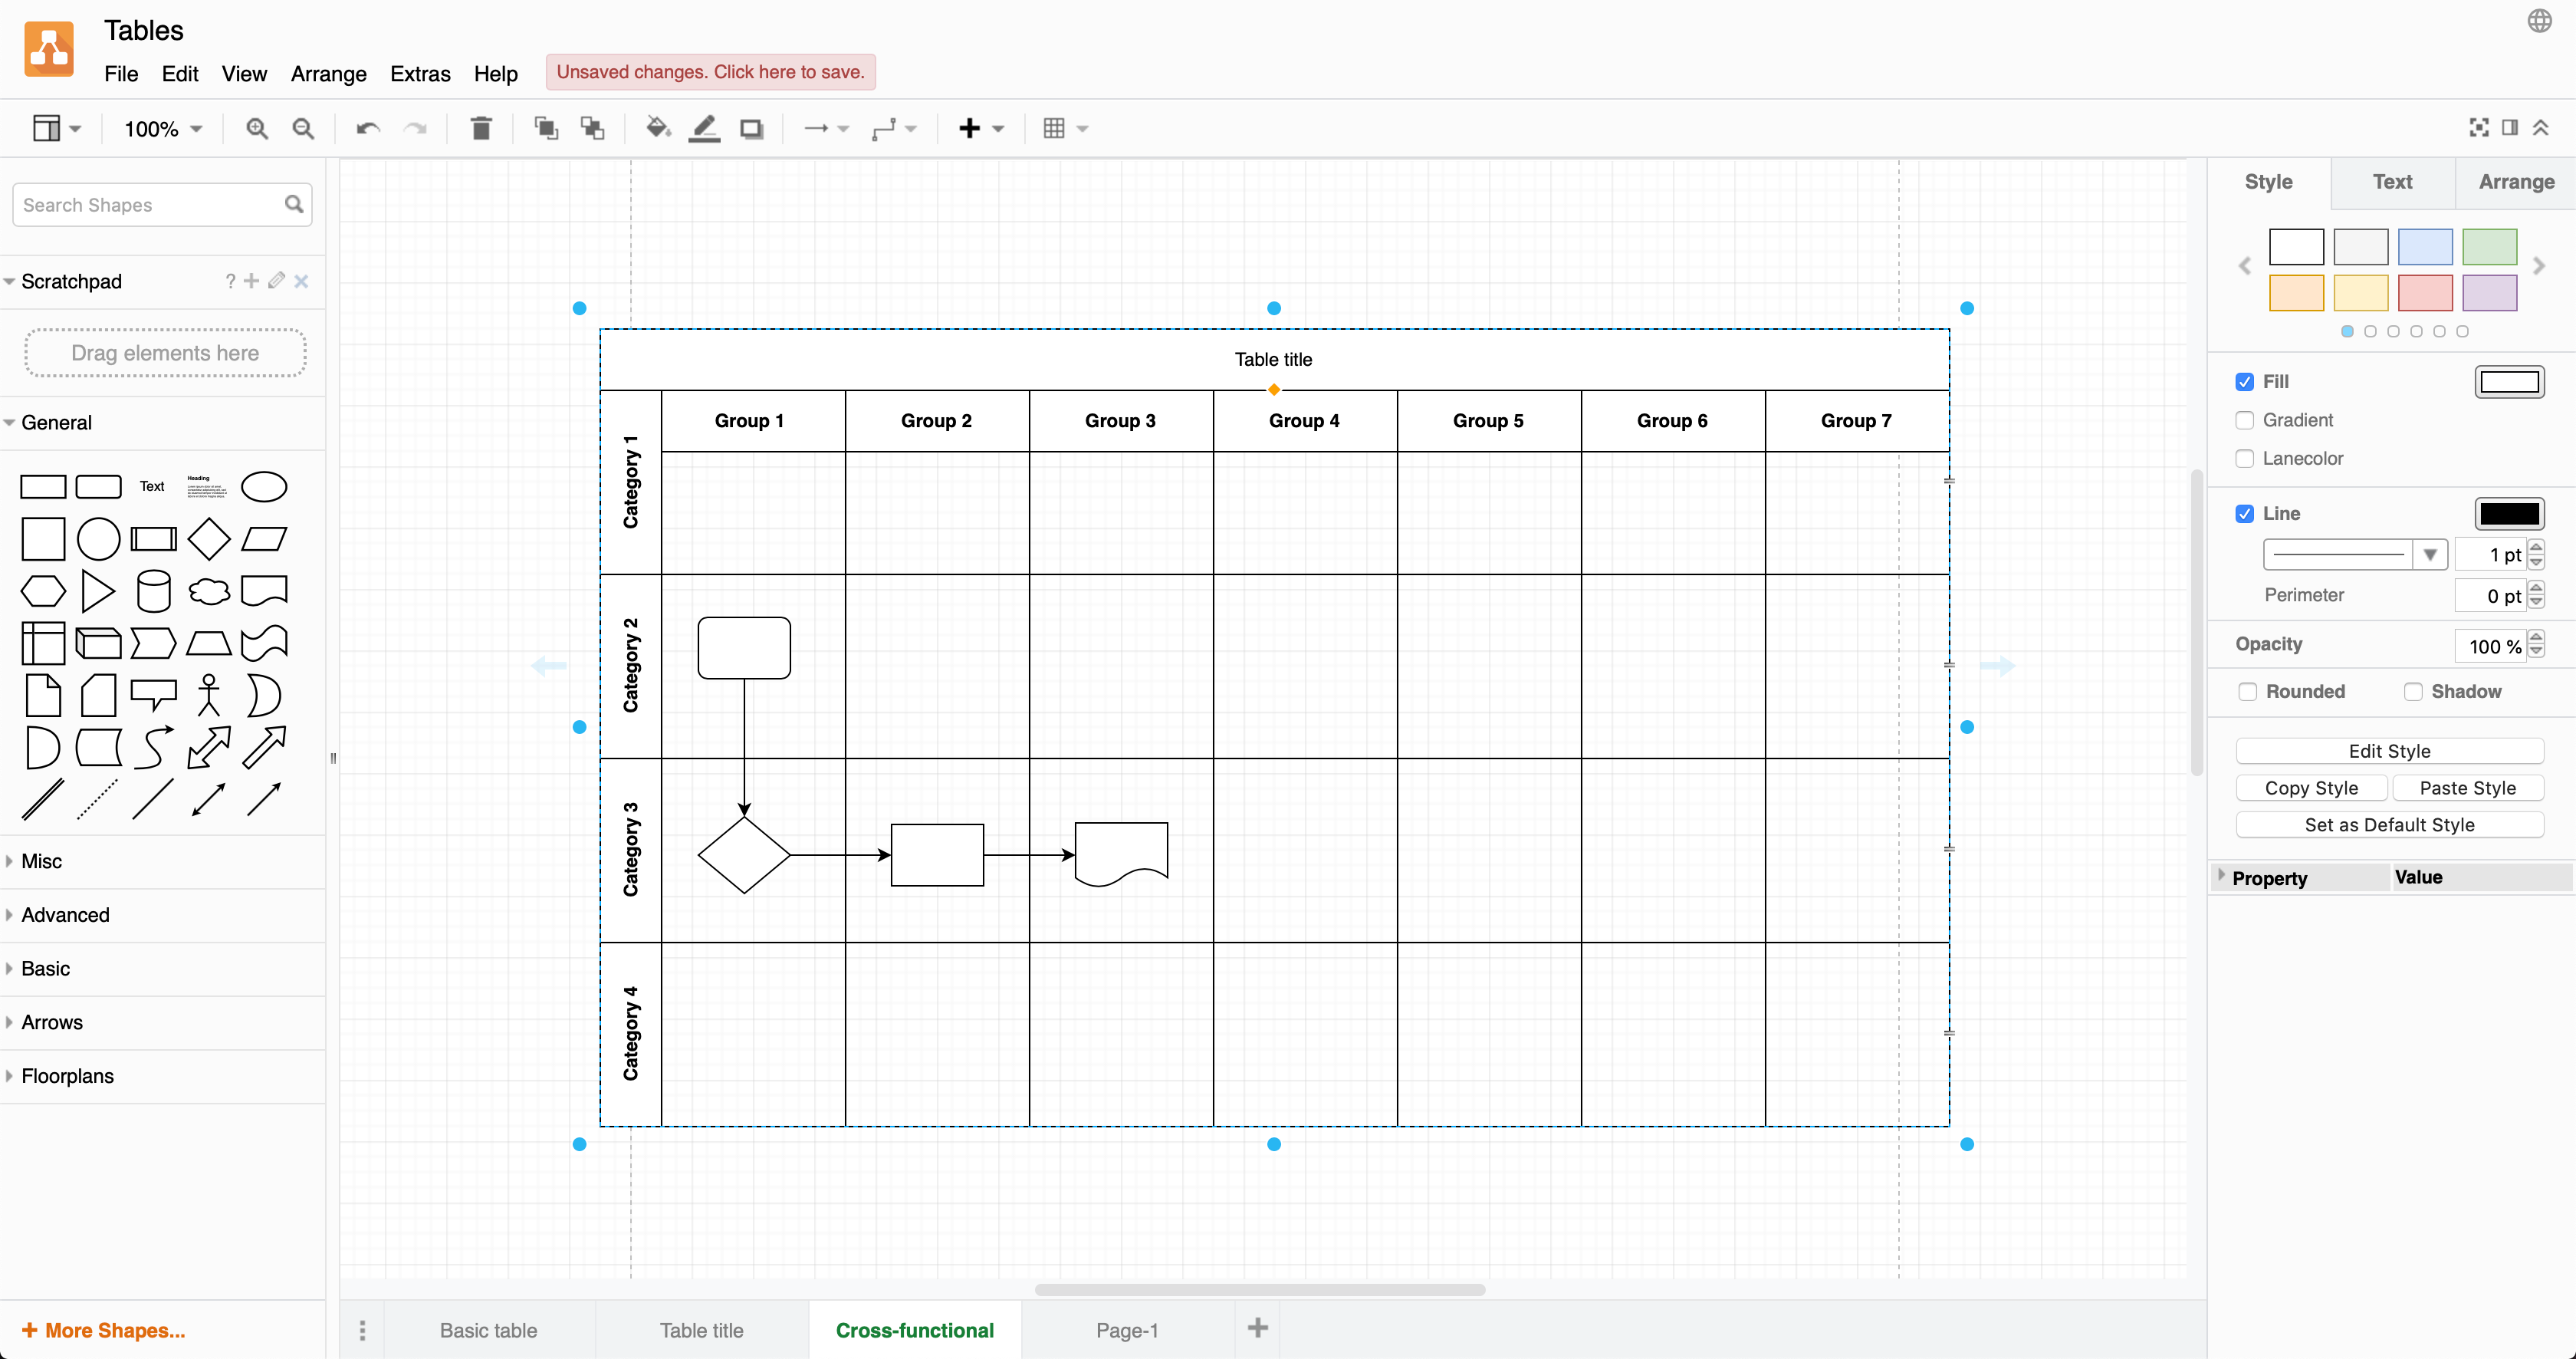
Editing AWS diagrams in draw.io

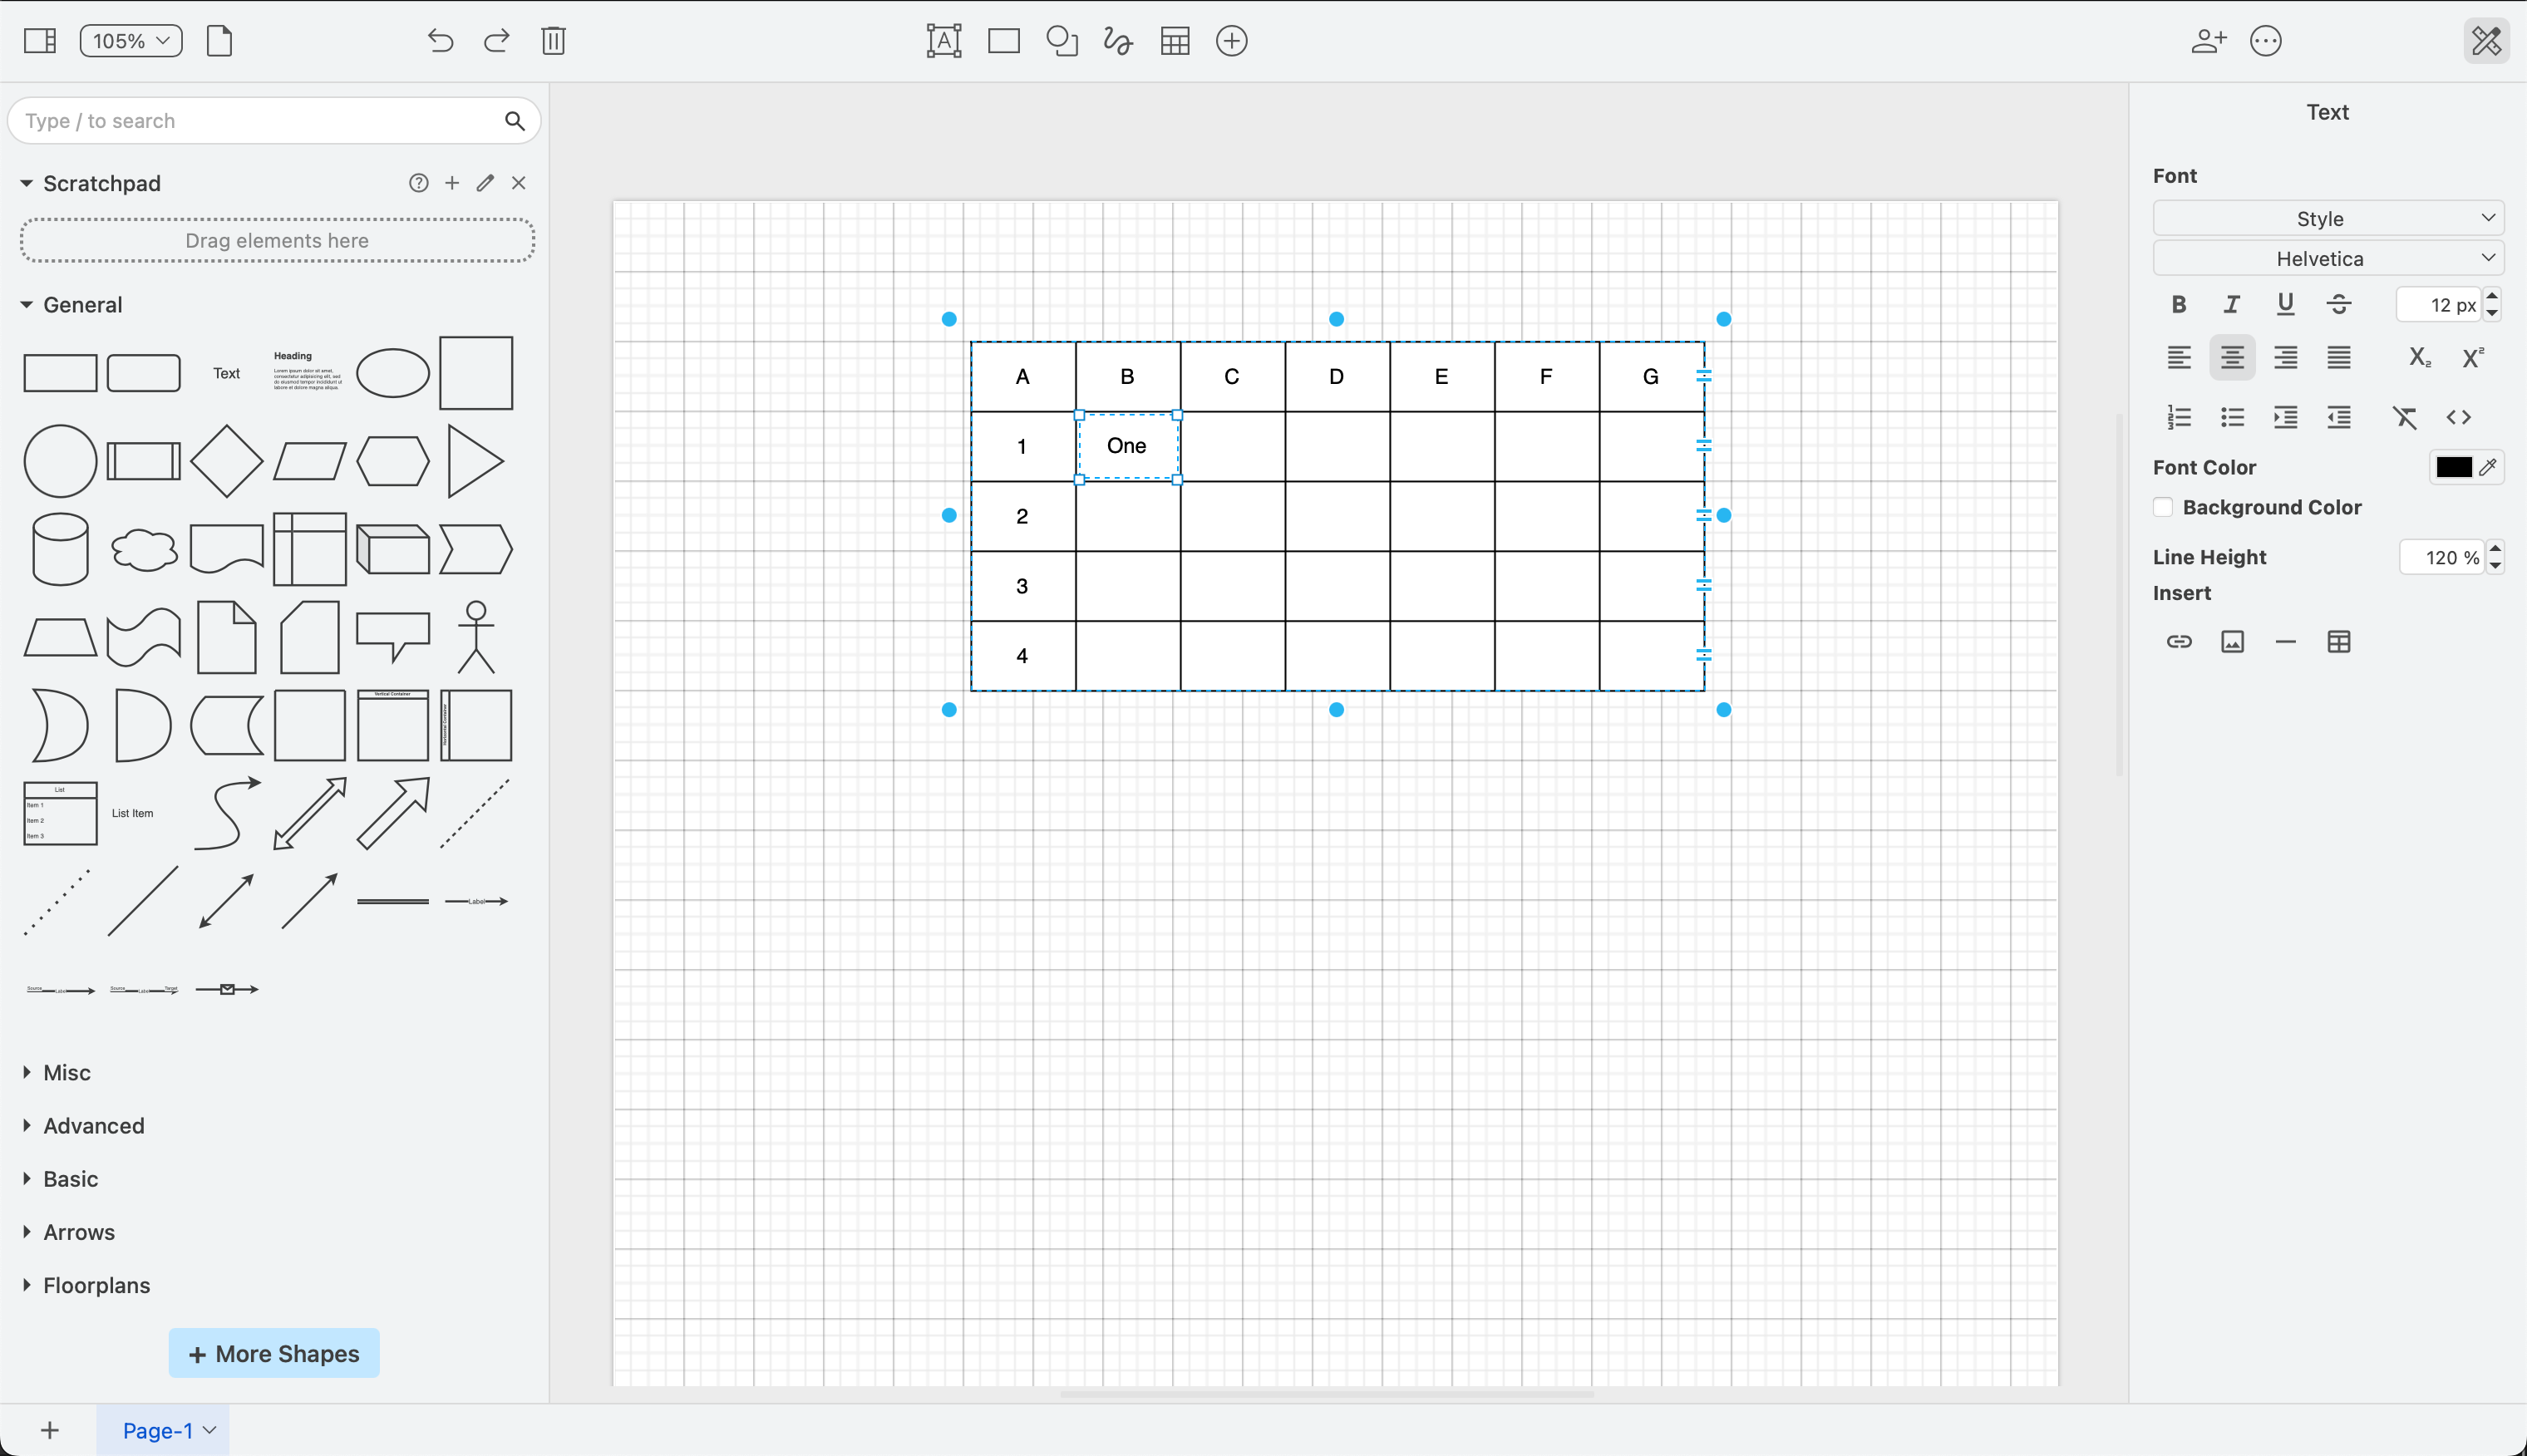
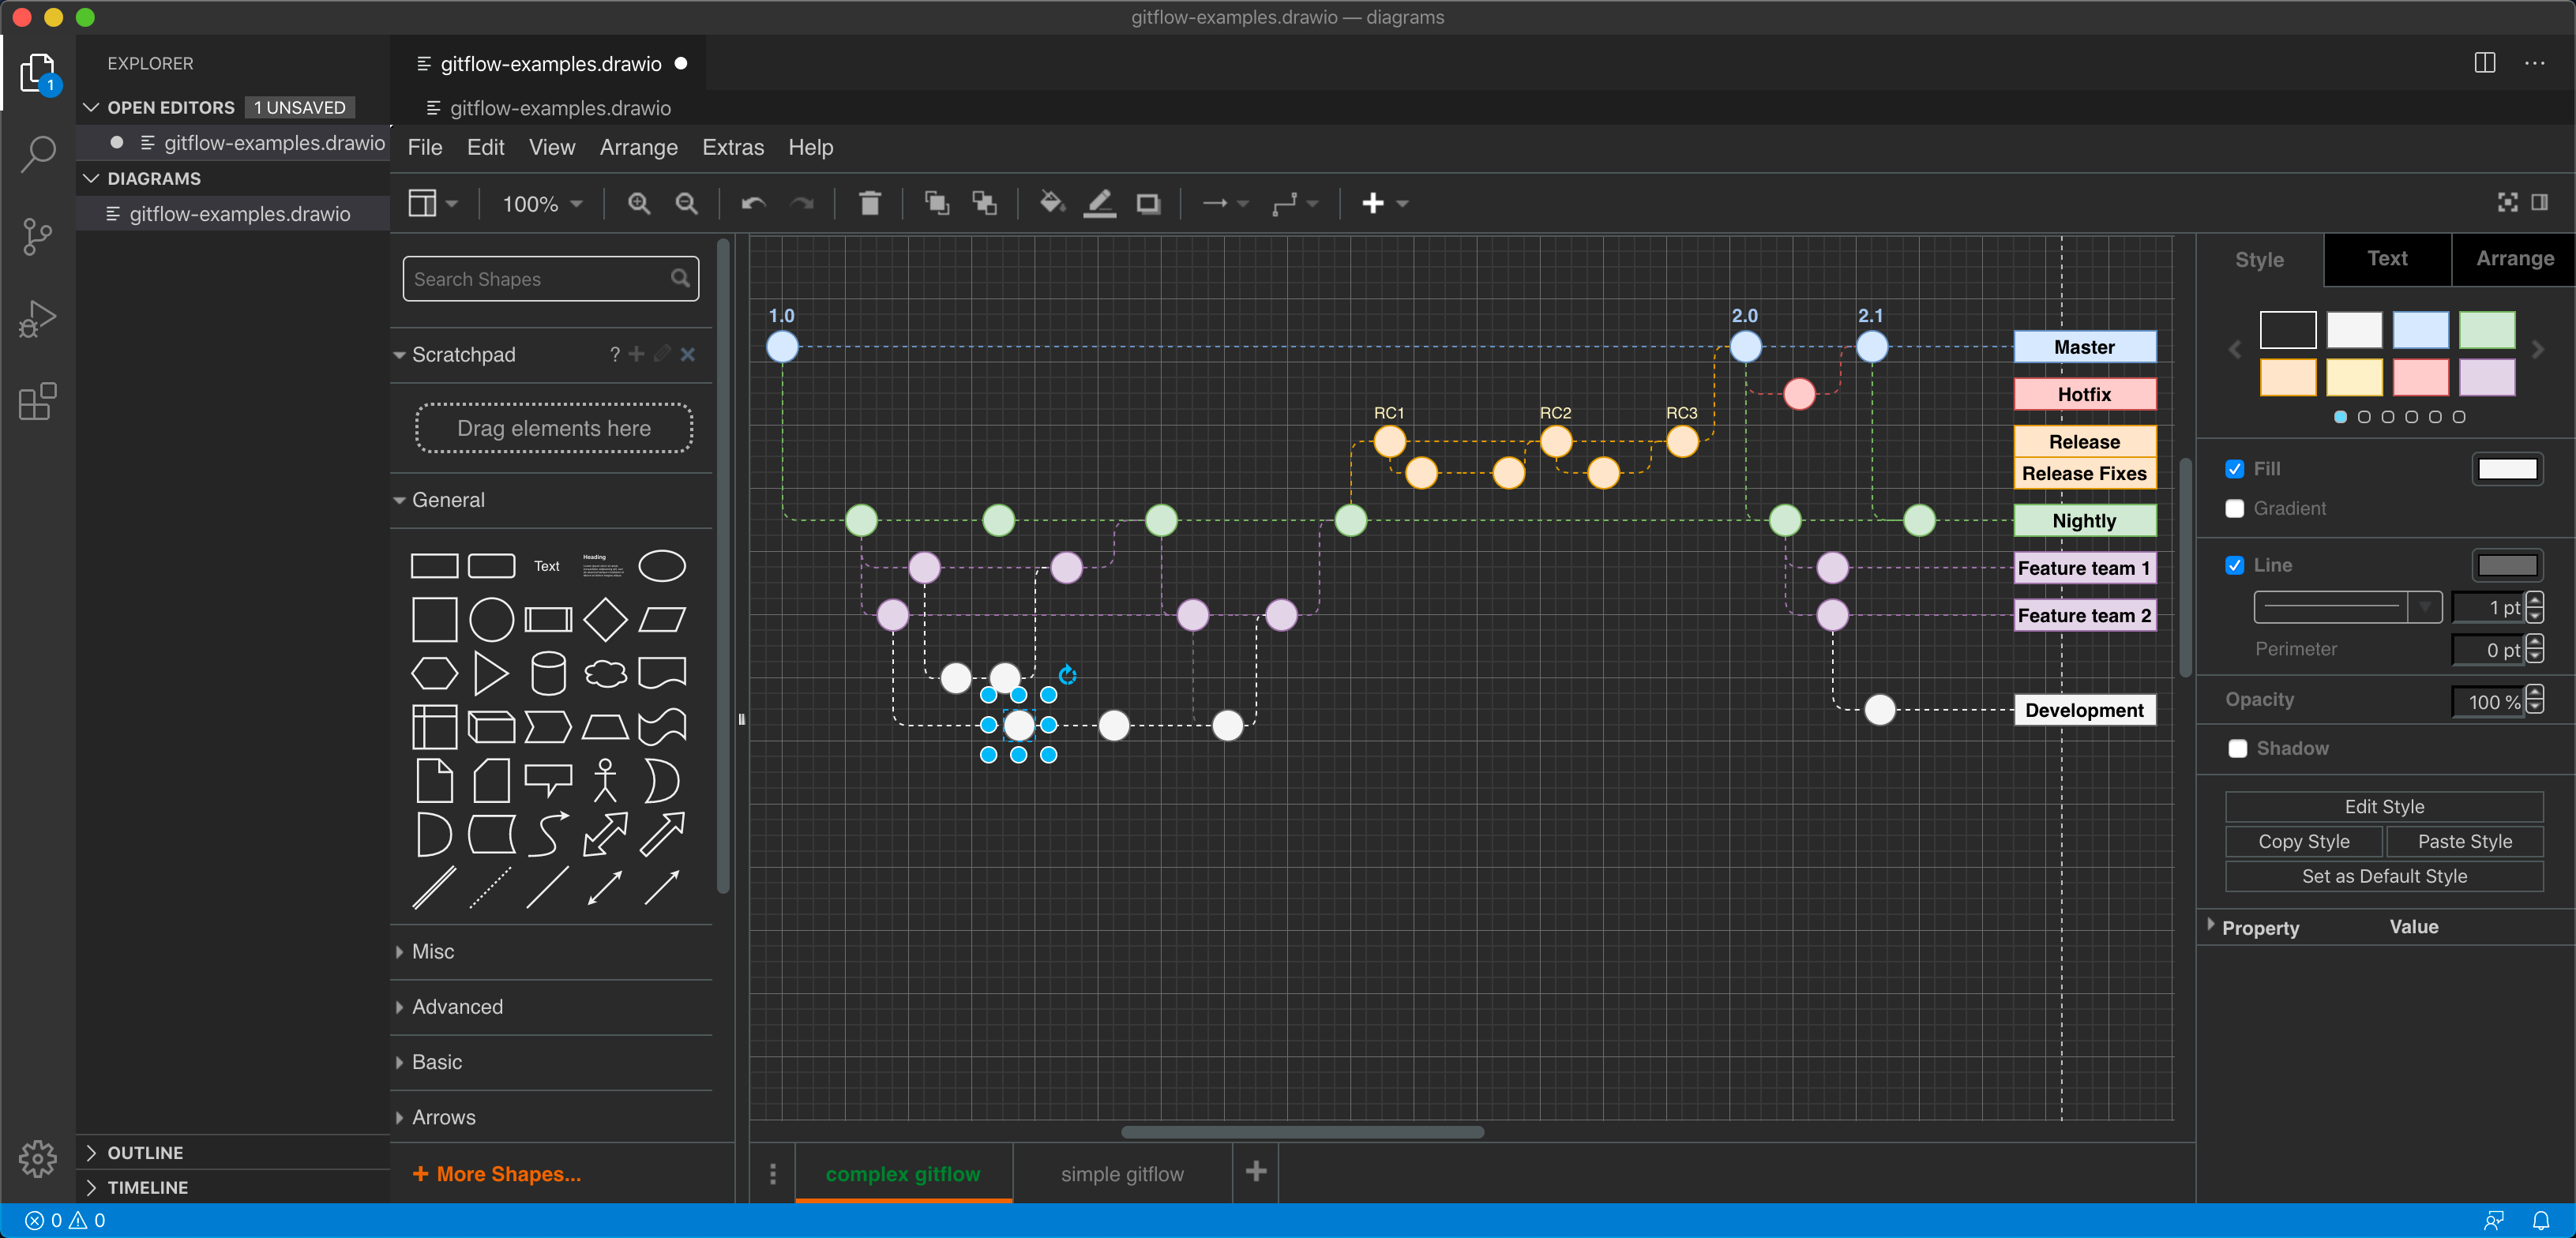
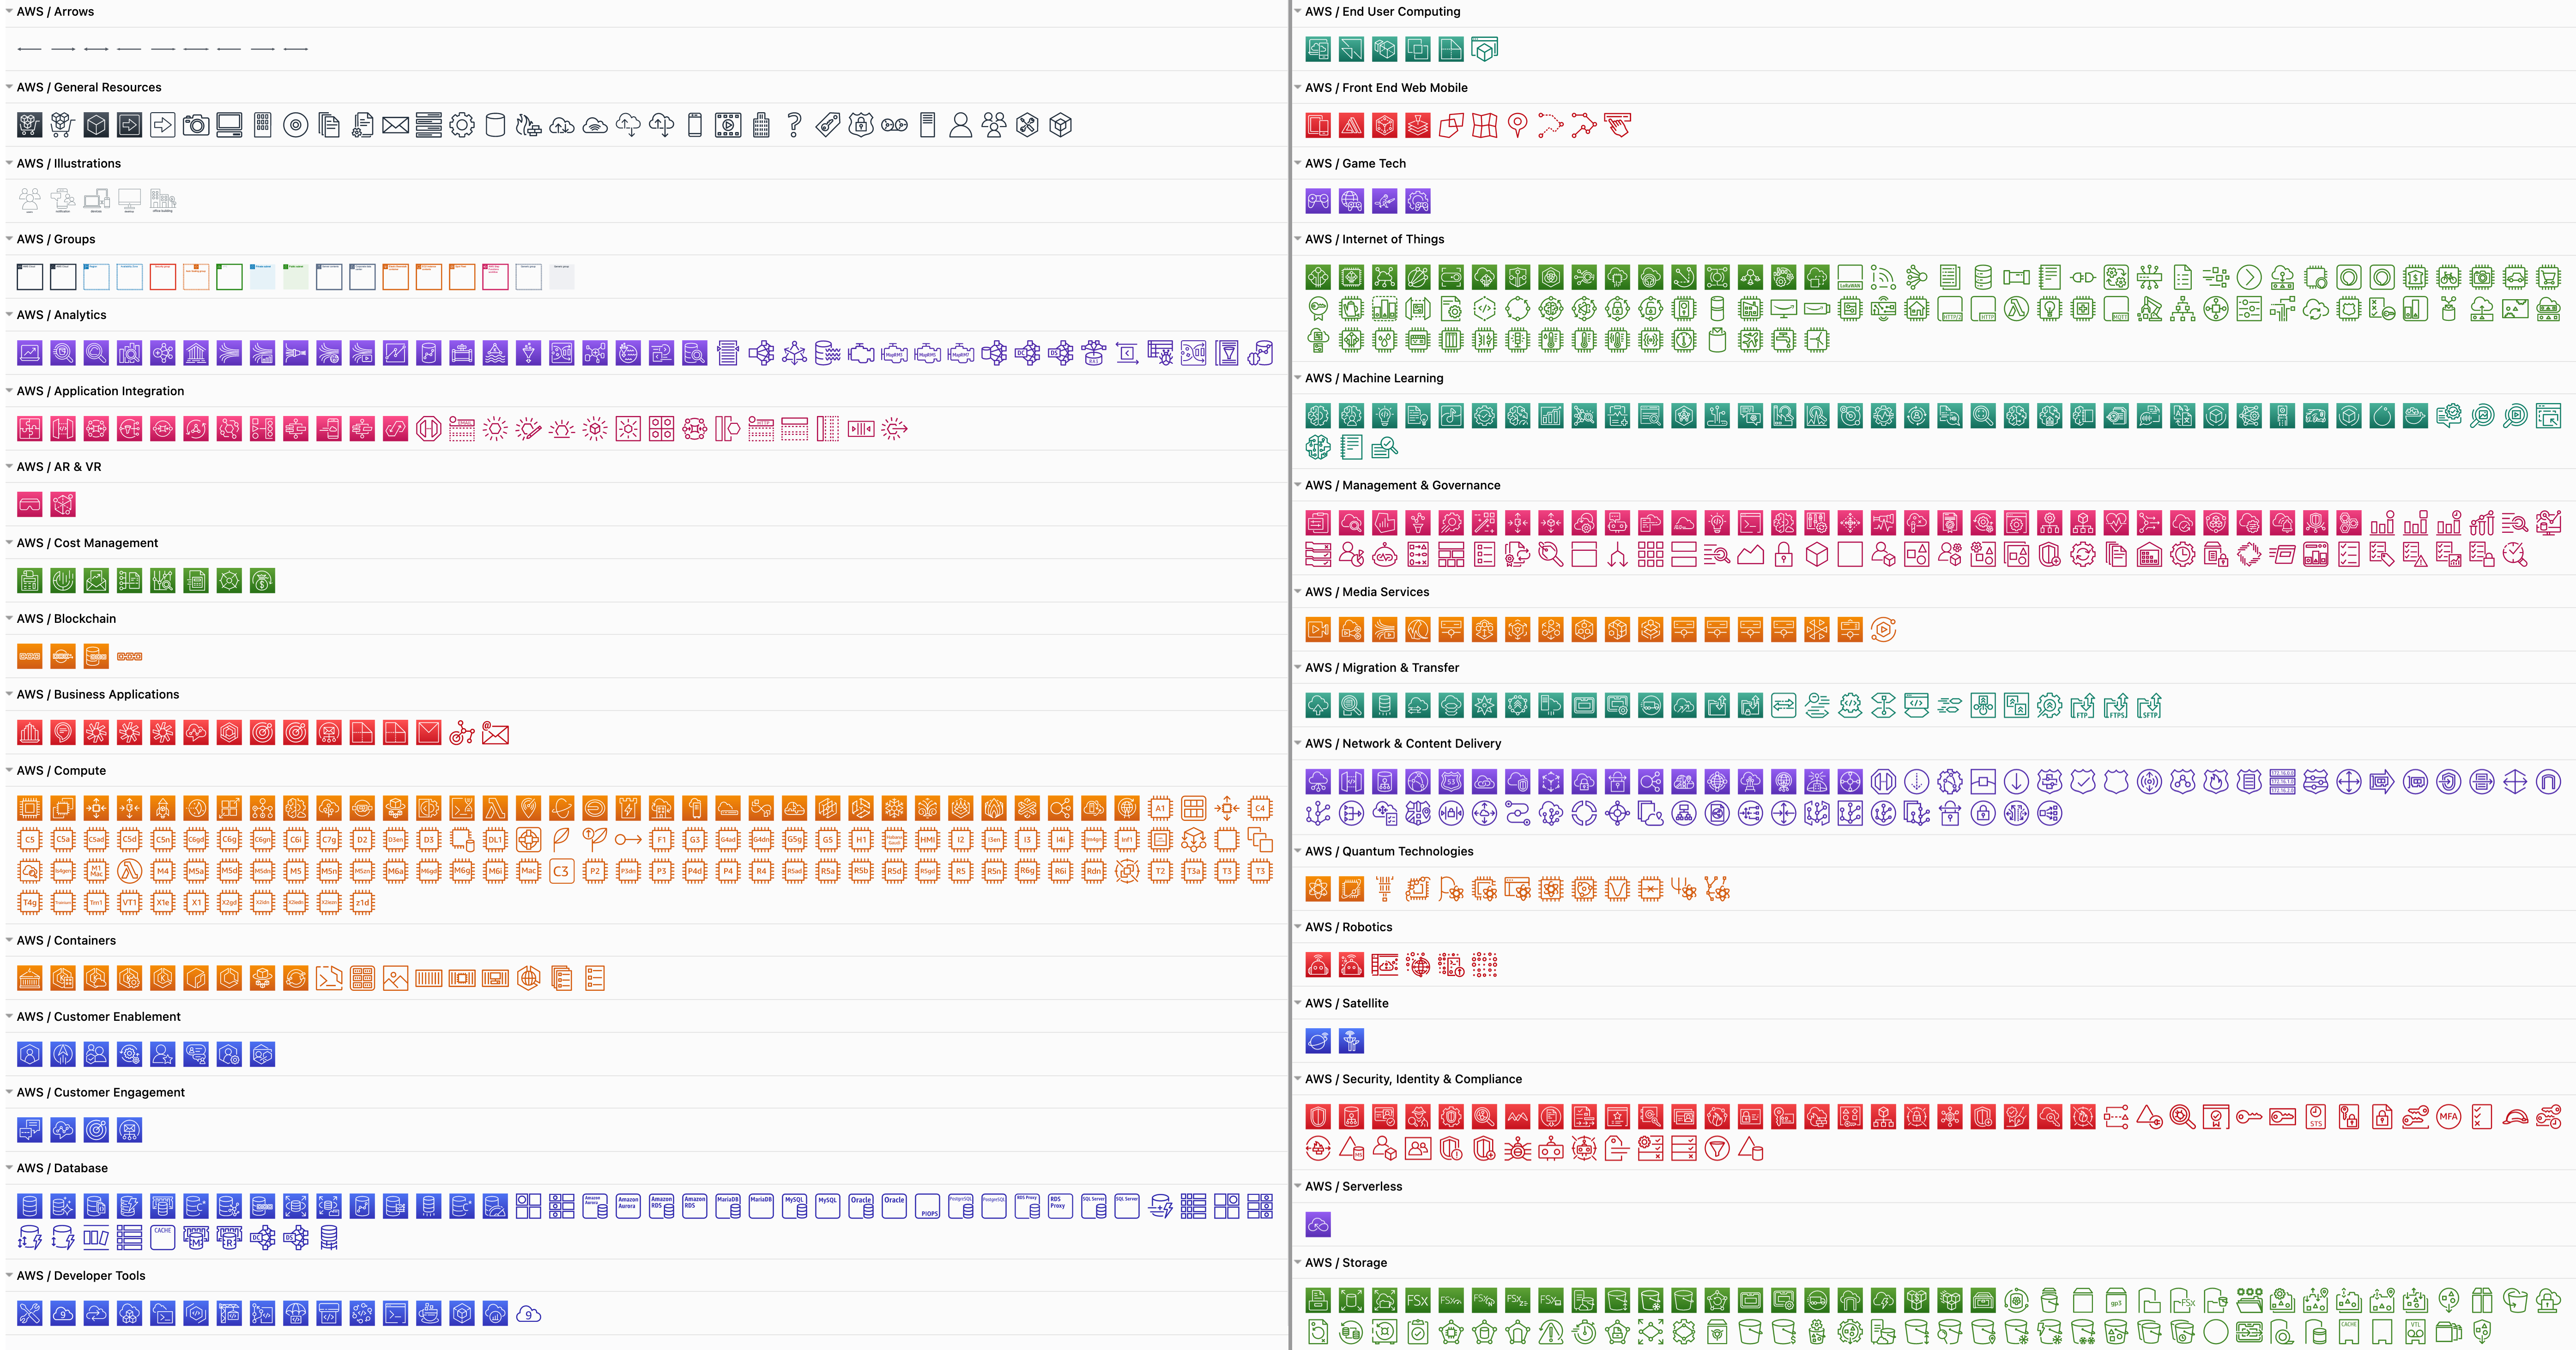
First, enable the AWS libraries. Click More Shapes at the bottom of the left panel, enable one or more AWS libraries under Networking, then click Apply.

Enable the AWS libraries

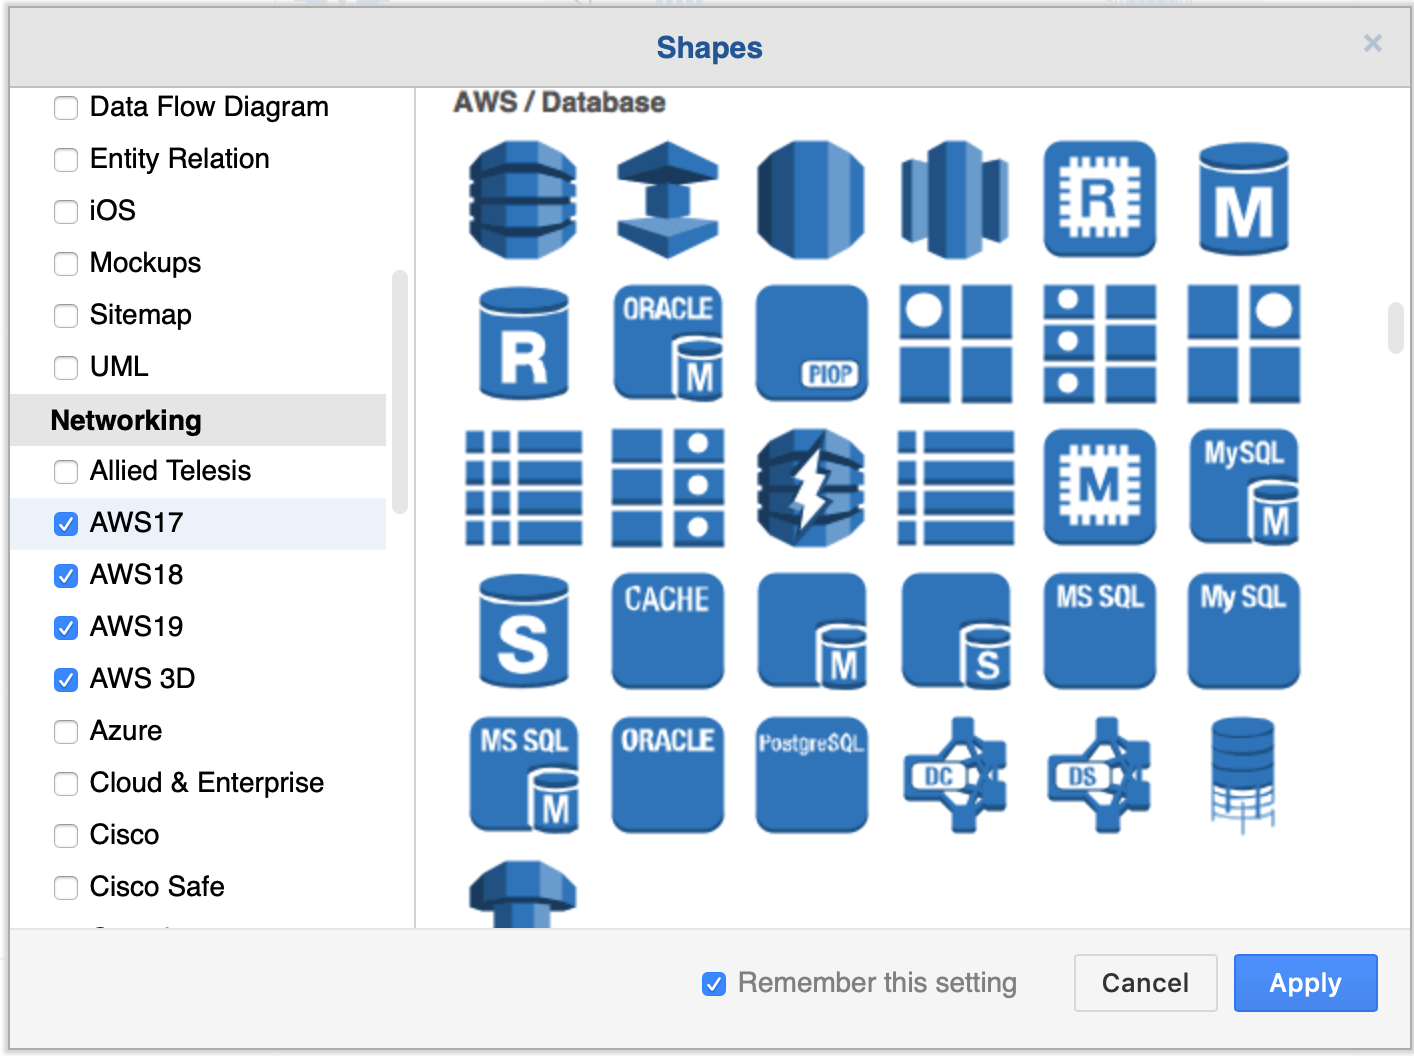
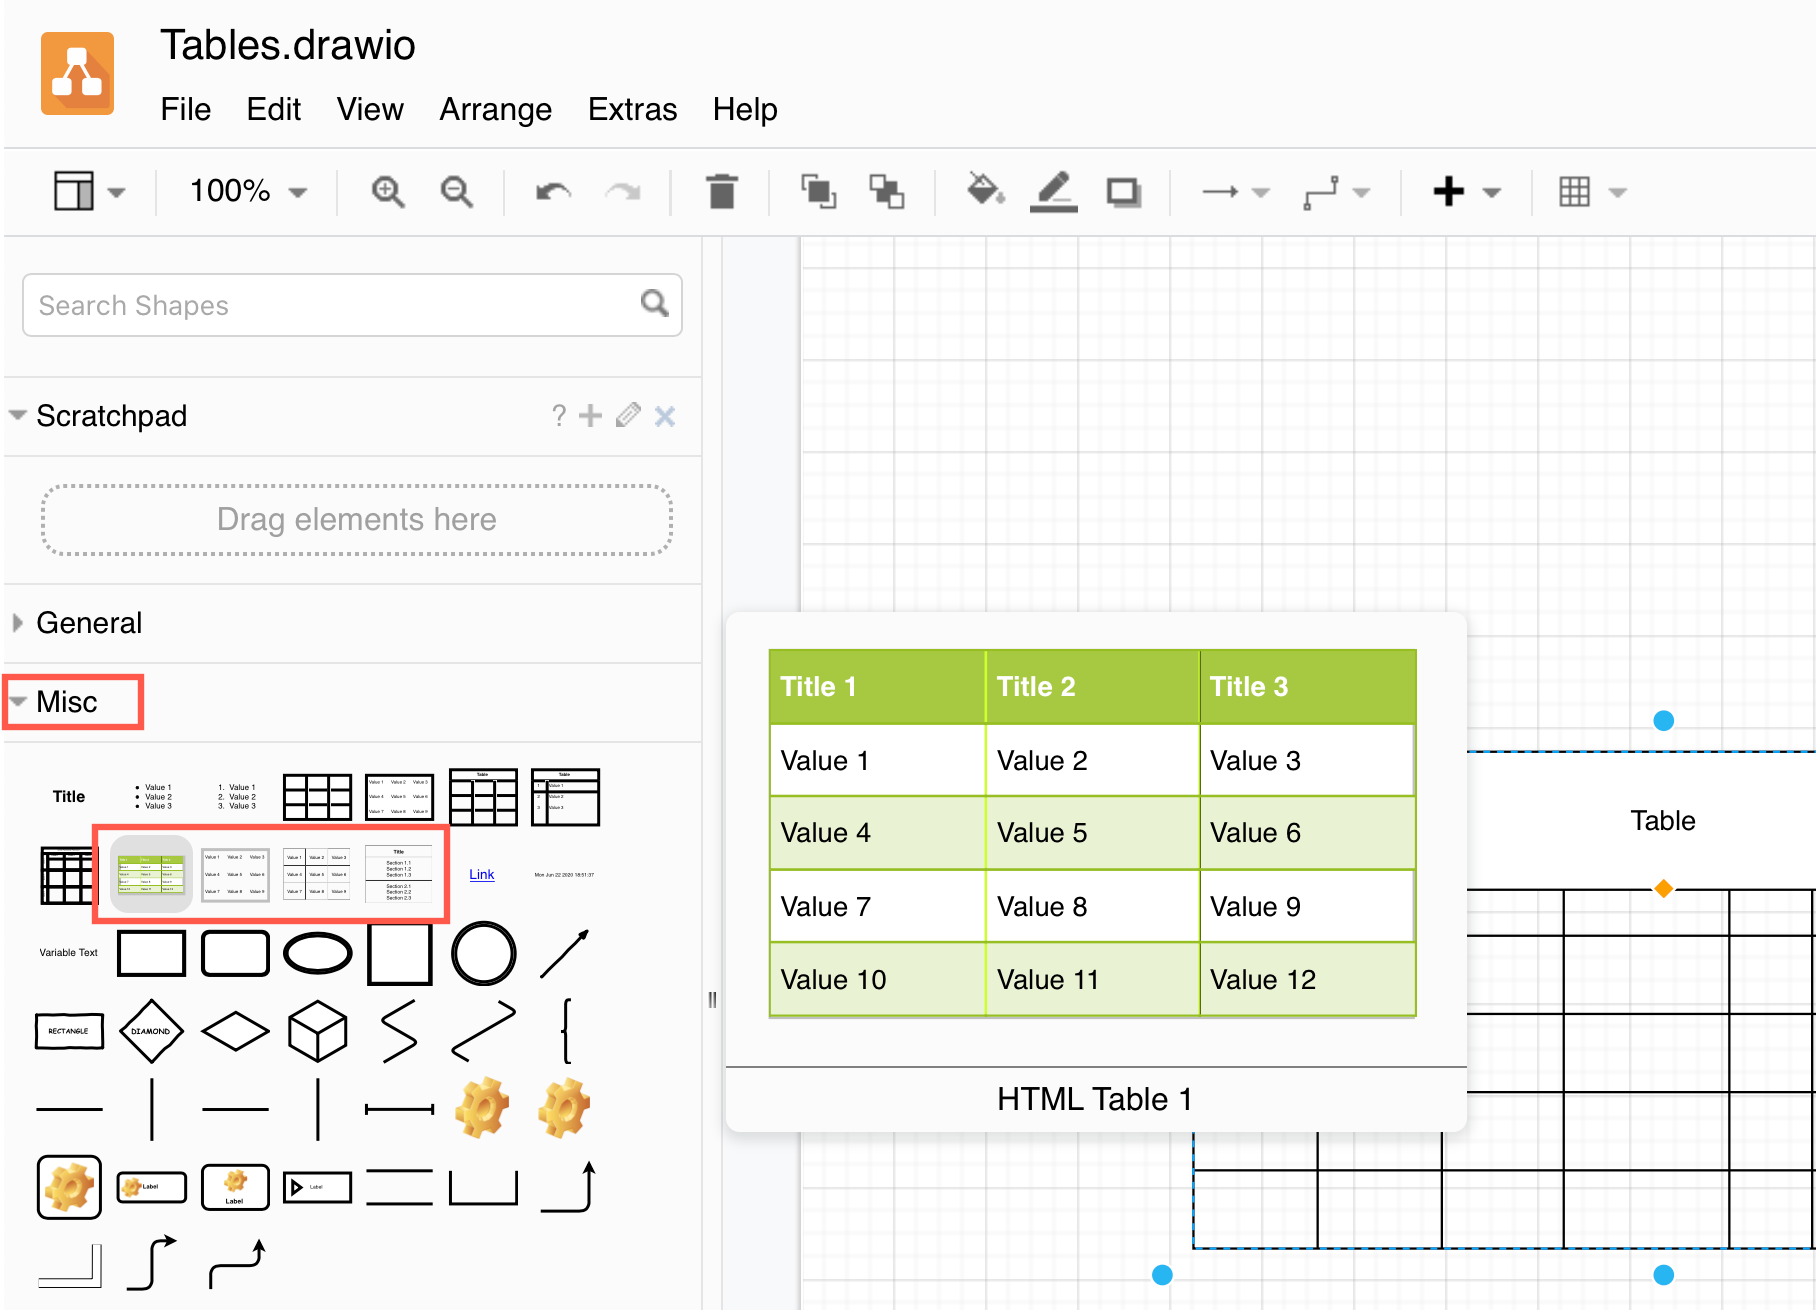
There are many AWS shapes available to visualise your AWS infrastructure. When you enable just one of the shape libraries above, you'll see a number of sub-categories of shapes appear in the left panel.
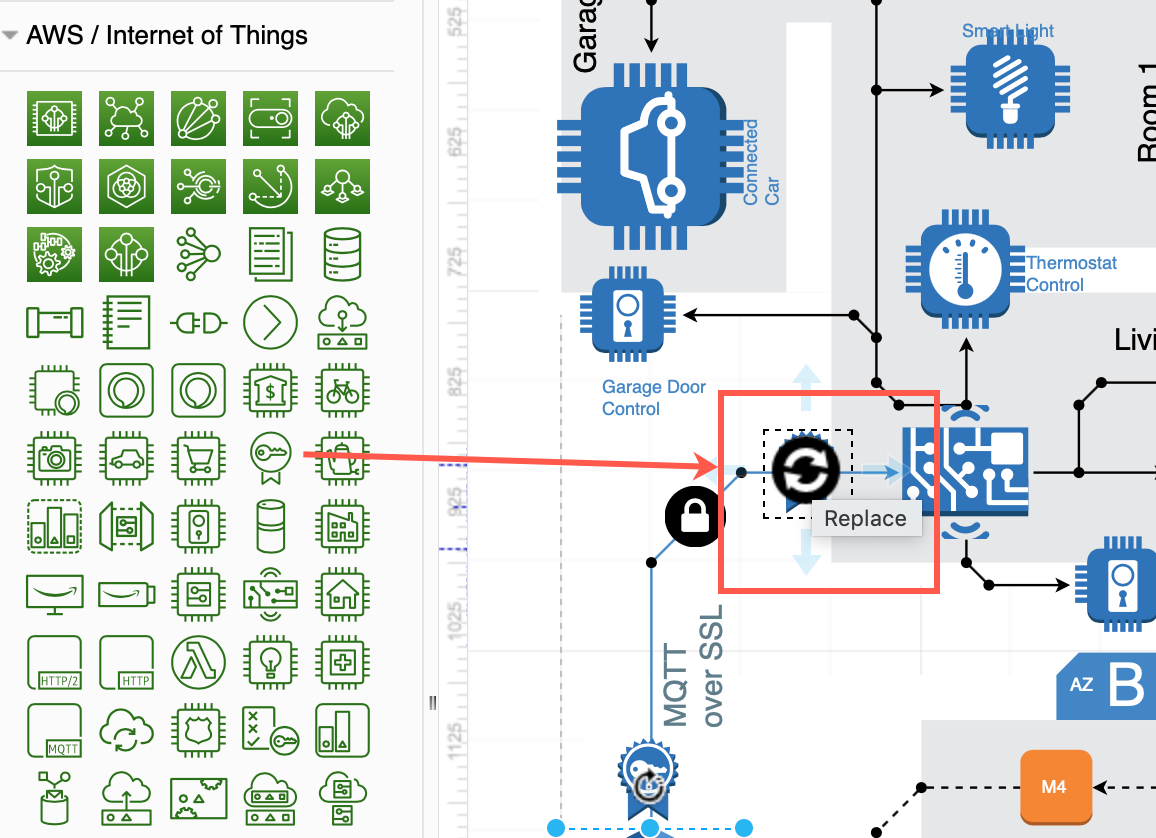
Some of the AWS shapes available in draw.io

Replace shapes

Drag a replacement shape from a shape library and hover over a shape in the diagram until you see the black replace shape arrow appear. Then release. The shape you just dropped will replace the old shape on the diagram. You may need to tweak the size and style afterwards. Once you have replaced all the shapes, change the sizes and styles to multiple shapes at once to save time.
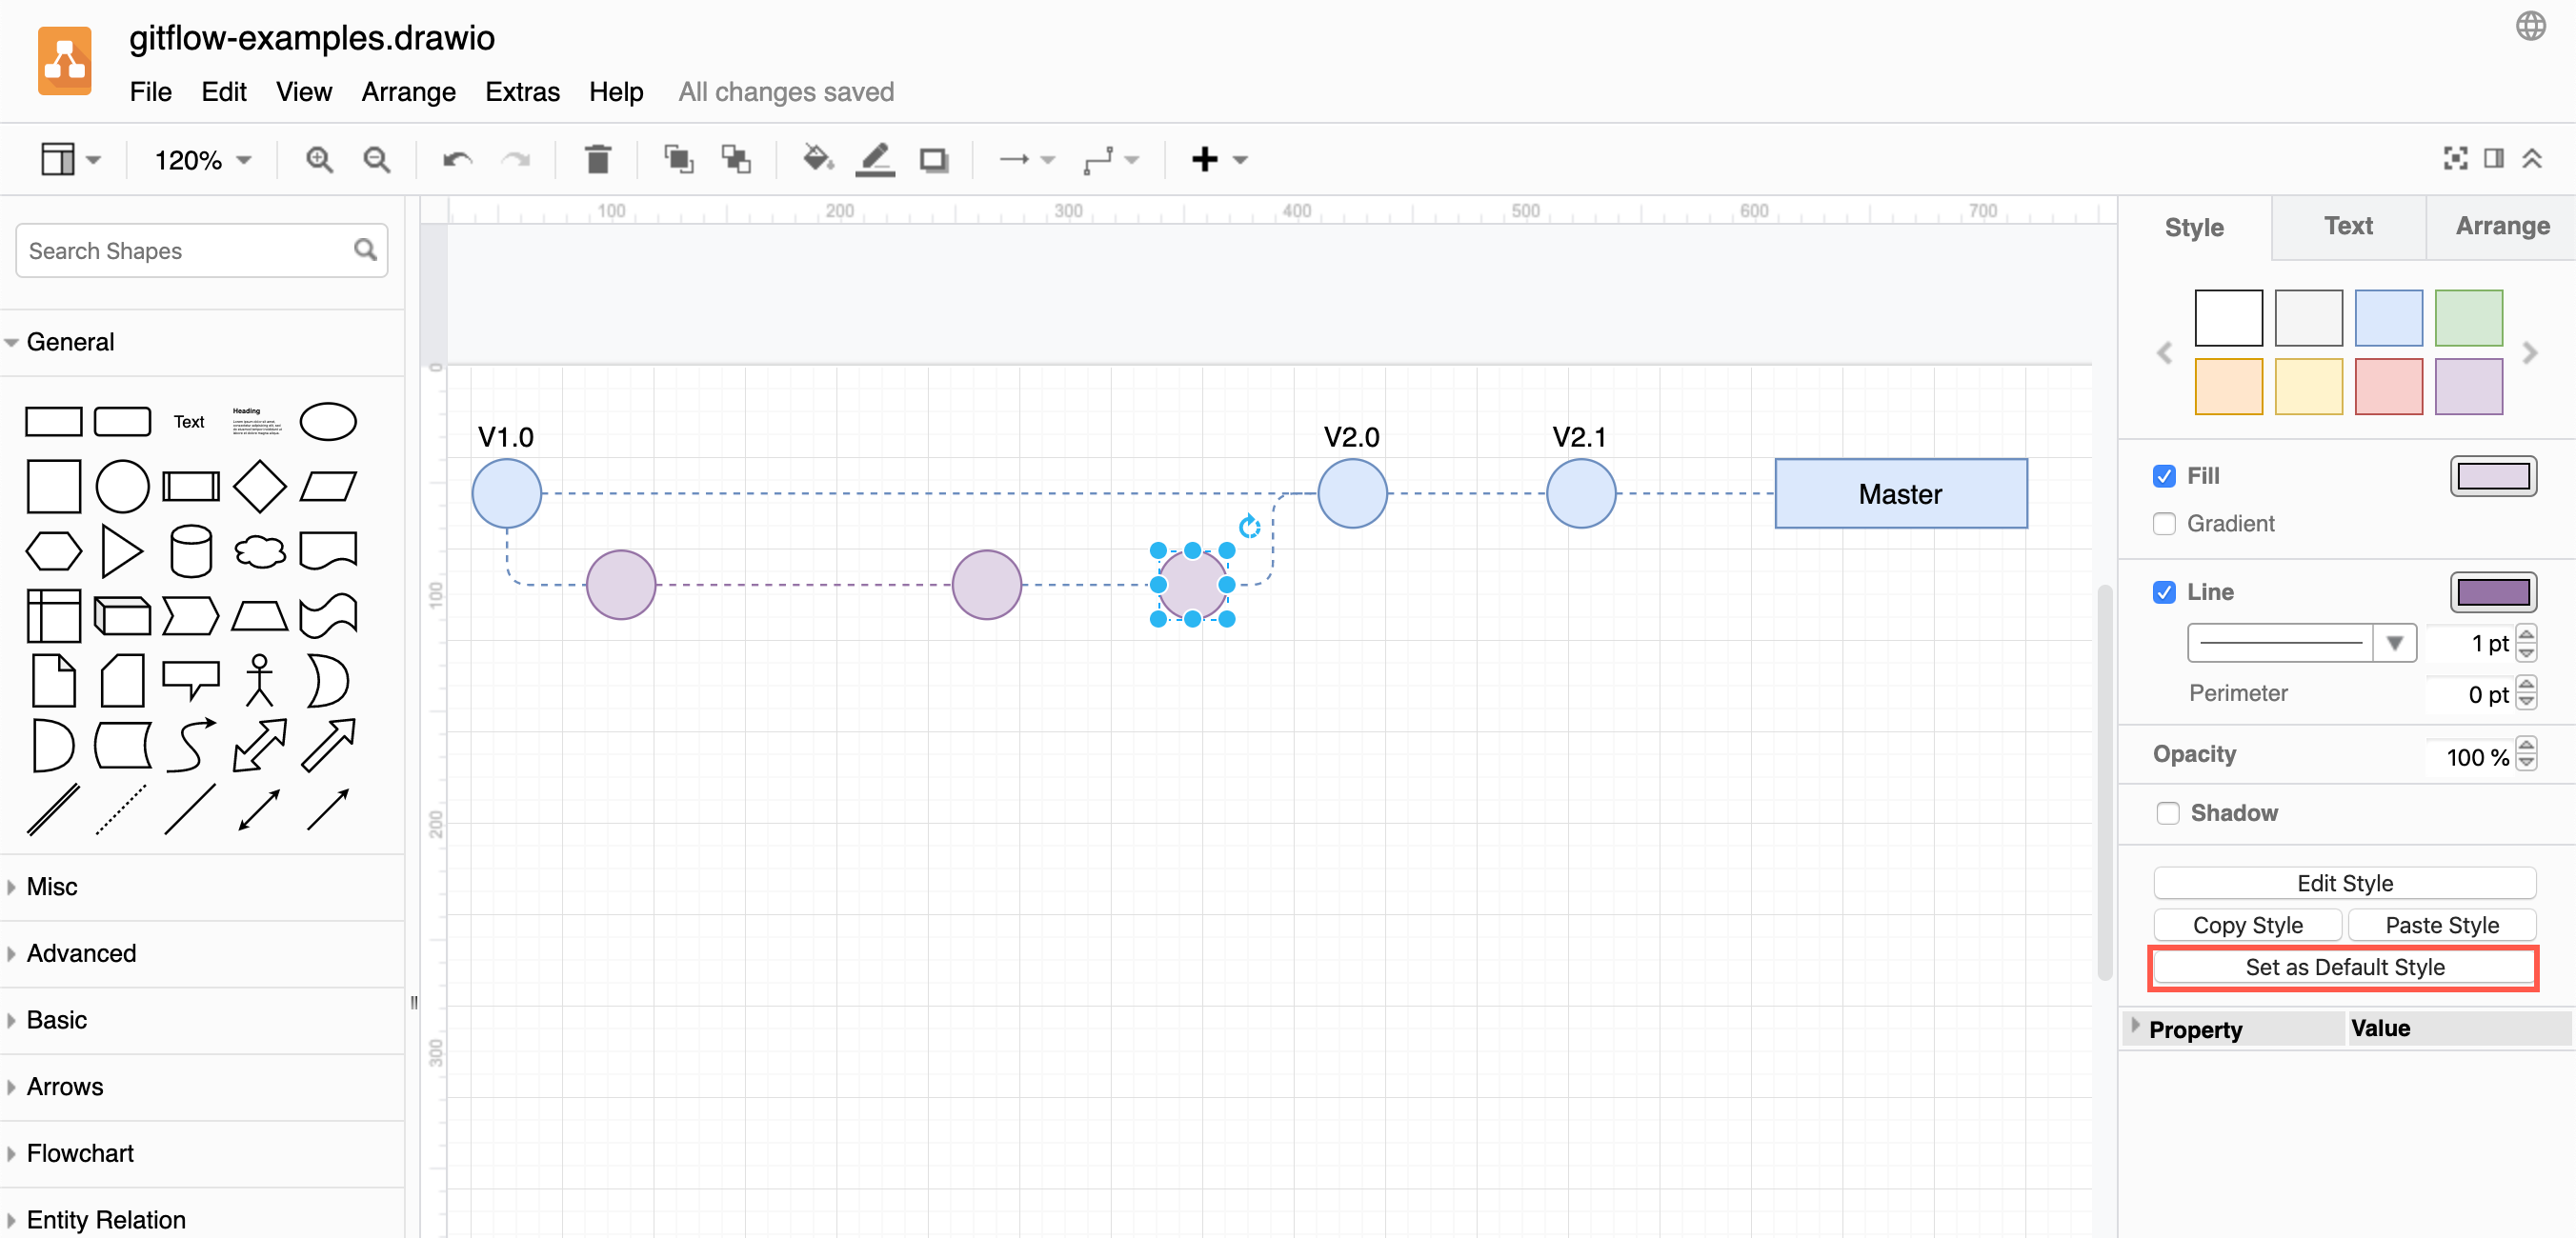
Drag a shape from the library and hover over a shape until you see the black replace arrow

Copy styles

Select a shape that has the style you want to copy. In the Style tab of the format panel on the right, click Copy Style. Select one or more shapes that you want to update, and click Paste Style.
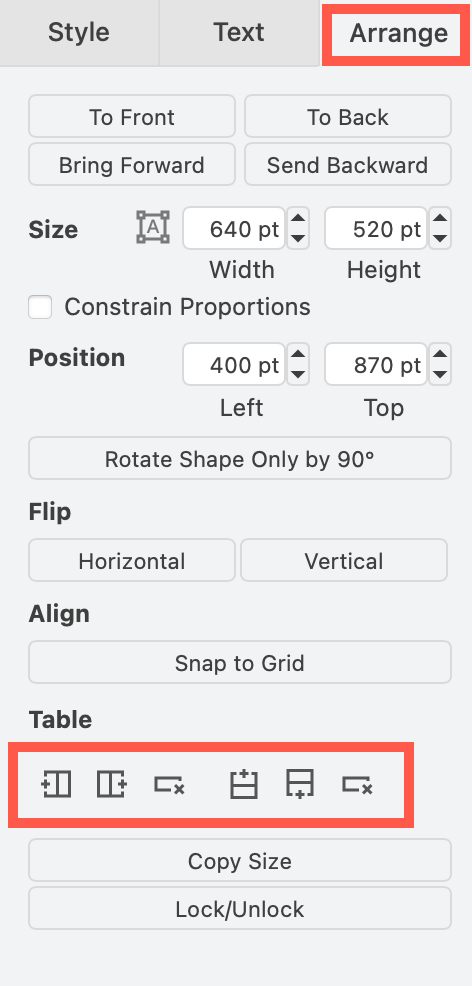
Copy sizes

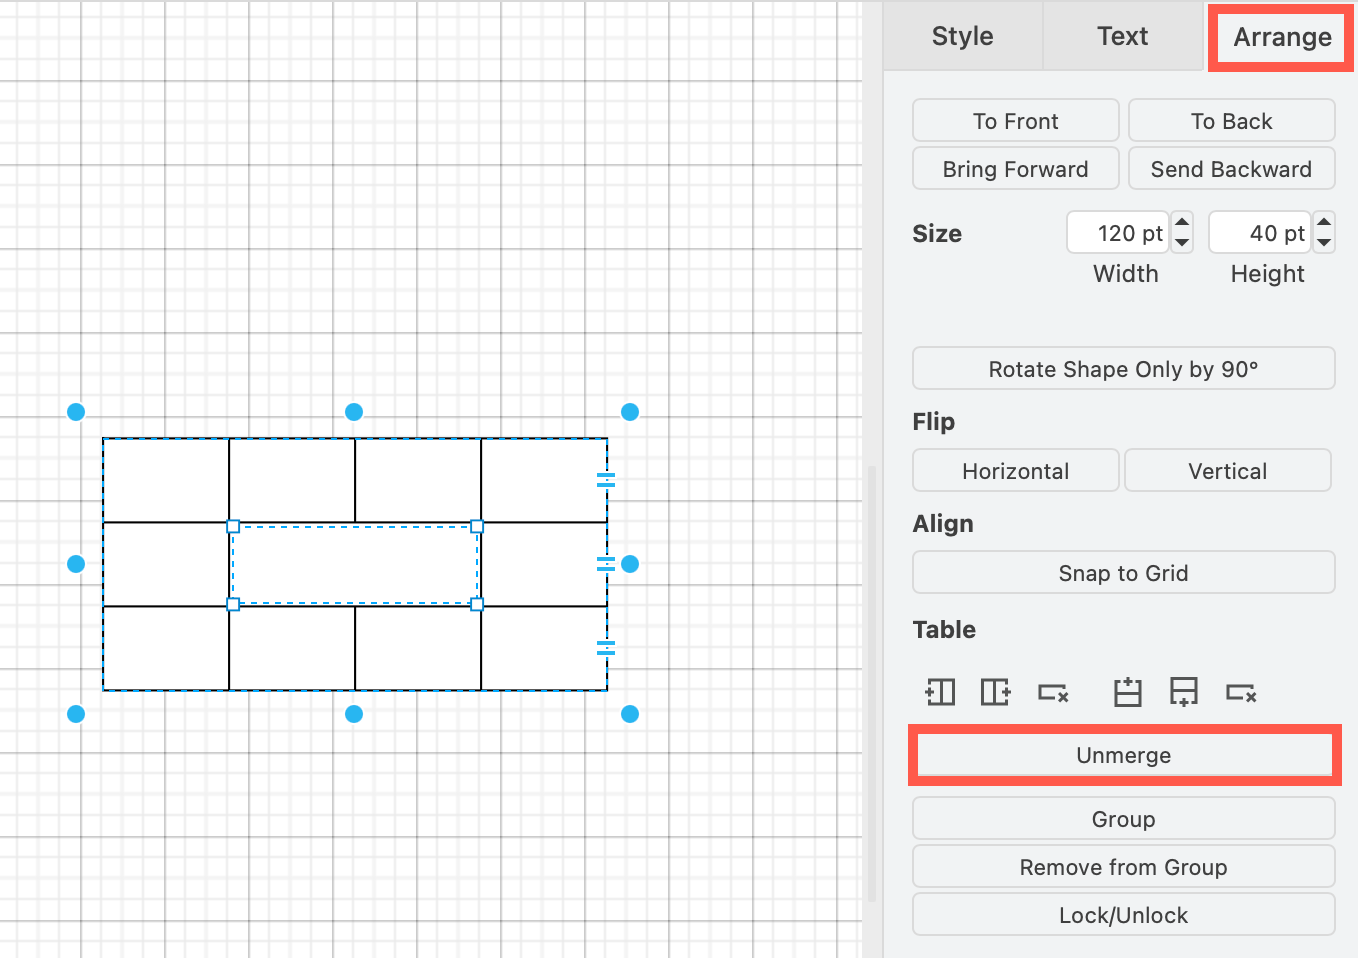
Select a shape that has the size you want to copy. In the Arrange tab of the format panel, click Copy Size. Select one or more shapes, then click Paste Size.

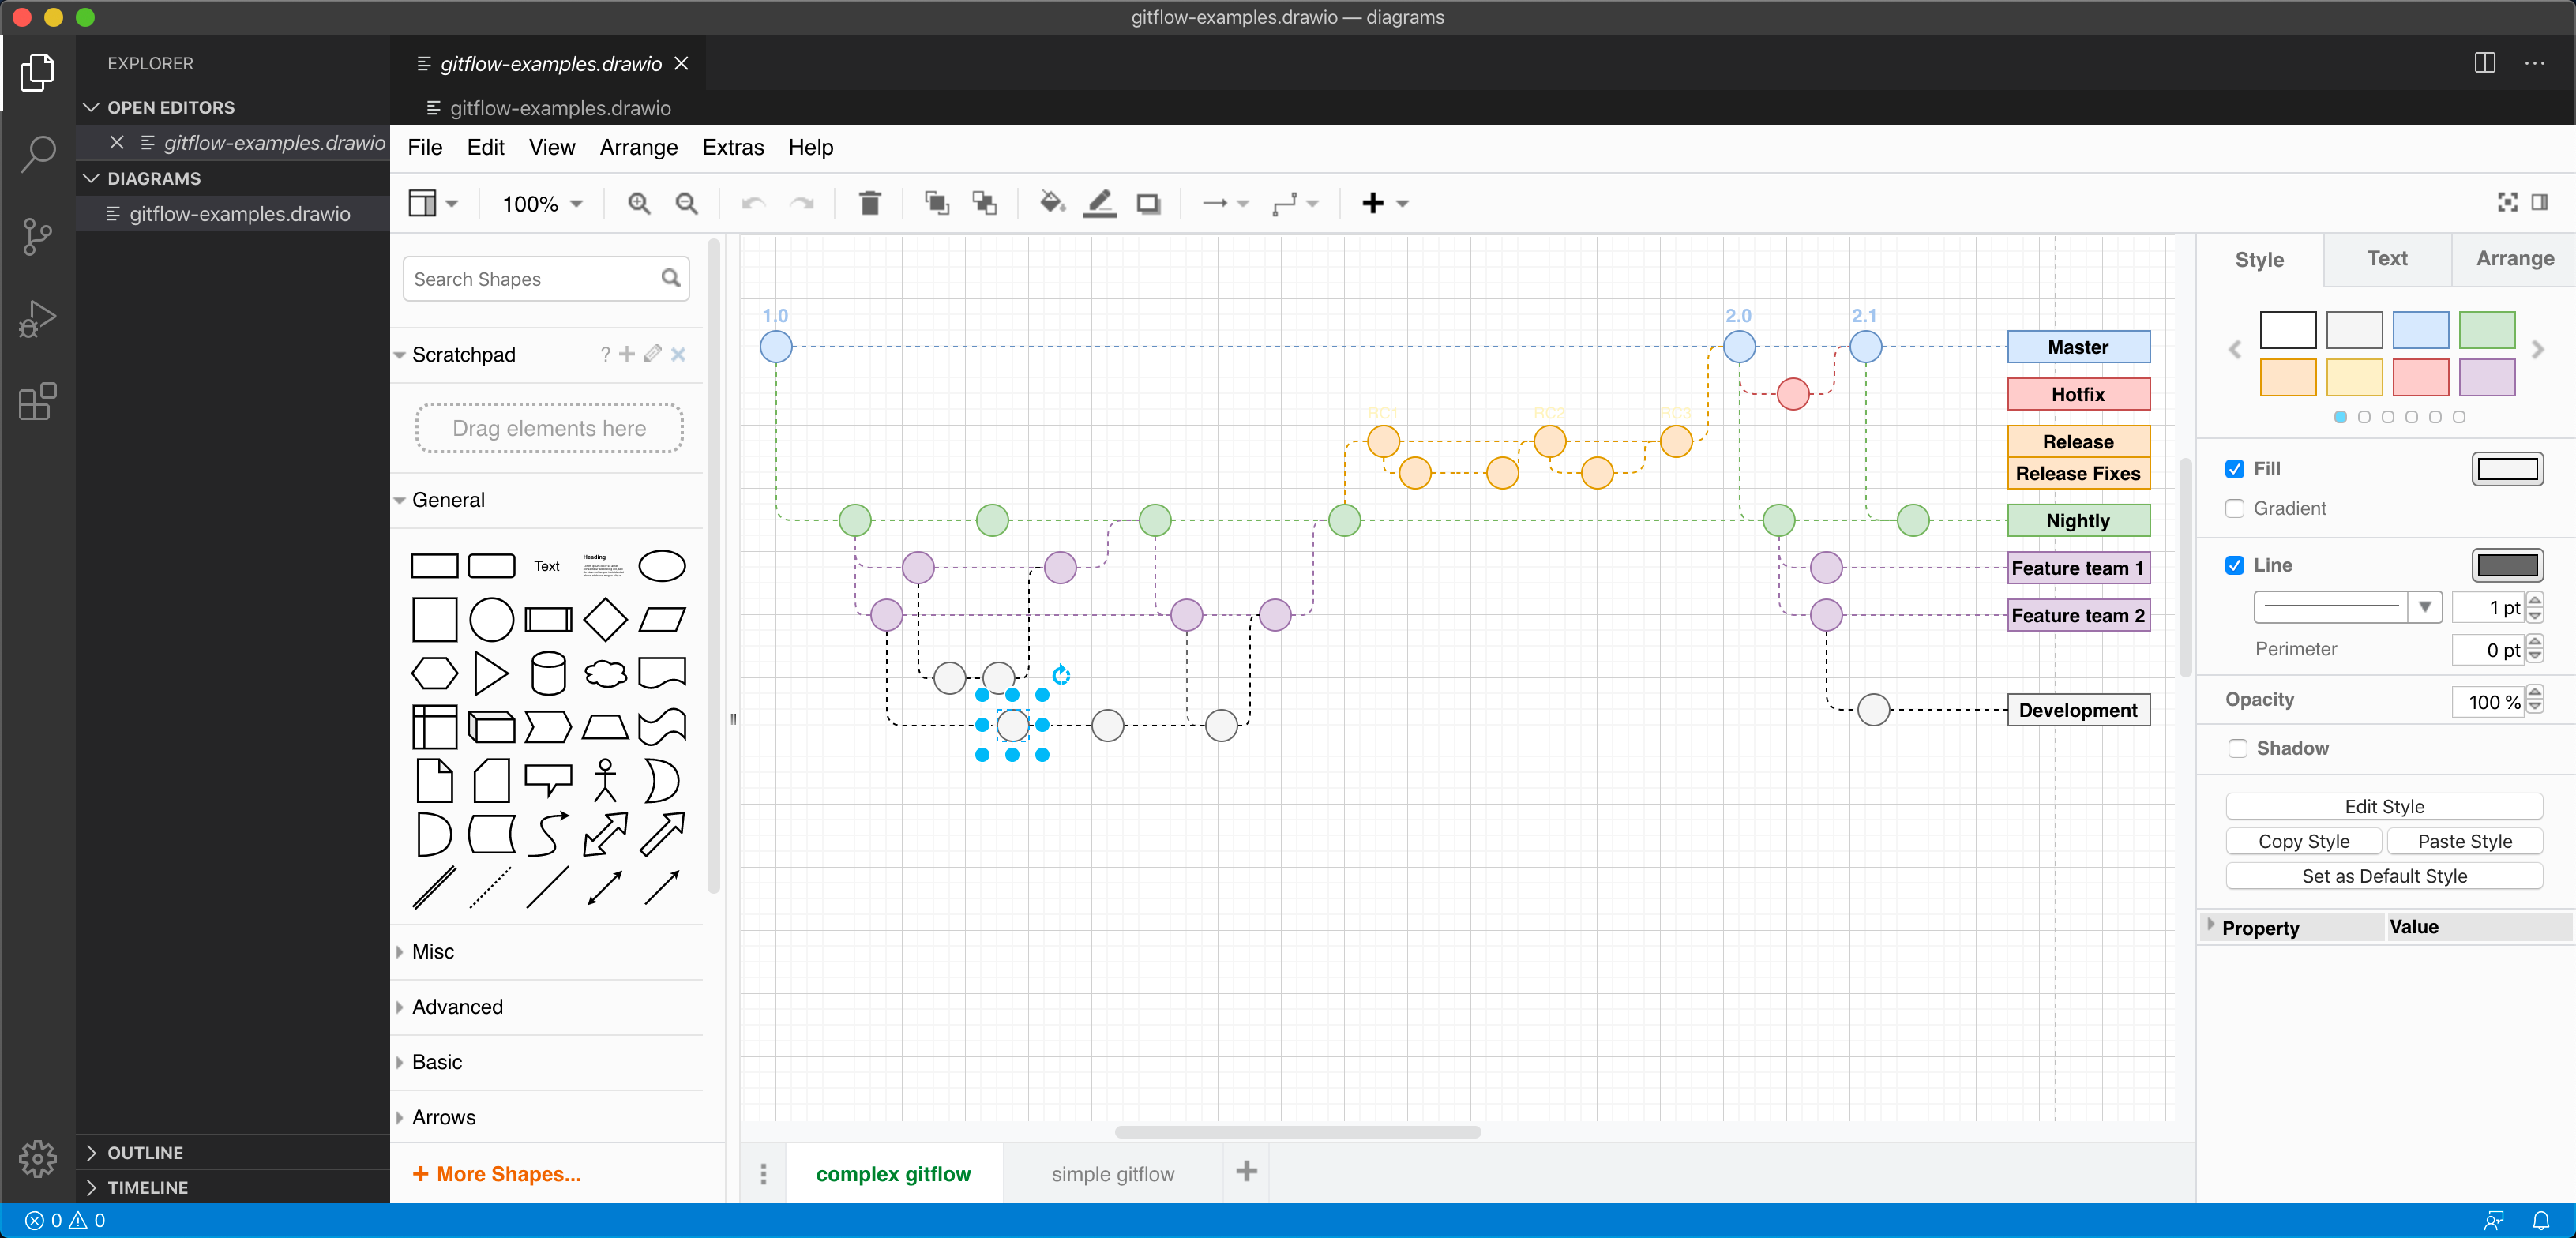
In this example, all of the older AWS shapes and 3D shapes have been updated to use a more recent AWS shape library.

IOT example using 2019 AWS shapes
Open this AWS diagram in the free draw.io diagram viewer

Snap connectors to an anchor point

· 2 min read
draw.io
draw.io Team

Floating connectors are easy to create - drag a connector from one shape, hover over another shape until the outline is blue, then release.

If you don't want the connector to float freely, but instead you can set them to connect to the nearest anchor point, those little crosses that appear when you hover over an unselected shape. When you move the shape or connector around on the drawing canvas, they will 'snap' to the nearest anchor point. To do this, edit the shape style or the connector style.

Note: If either the shape or the connector are set to snap to an anchor point, this will work.

Connectors can snap to the nearest anchor point on your shape

Change the shape style

  1. Select the shape or the connector.
  2. In the Style tab of the format panel on the right, make sure that the Property section at the bottom is expanded.
  3. Click on the checkbox next to the Snap to Point style label so that it is enabled. Enable the Snap to Point property in the Style tab

Manually edit the shape style

Alternatively, you can edit the style of your shape manually.

  1. Select the shape or connector then click on the Edit Style button in the Style tab of the format panel
  2. Add the following style to the end: snapToPoint=1; then click Apply. Edit the shape or connector style