
Thanks for supporting draw.io in 2022

· 4 min read
draw.io
draw.io Team

It was quite a year. We want to take this opportunity to thank you for your support, look back at some of the features we've added and updated.

To our diagram editor users

Whether you use our web-based draw.io app or one of our draw.io integrations, or our standalone desktop app, thank you for your support, feedback, and participation in our Google forum and GitHub discussions.

To our open-source contributors and sponsors

Also to our development and support team, translators, bug reporters, and open-source sponsors - we love that you love our secure diagramming app. Thank you for your support and contributions this year.

To those open-source projects and developers we sponsor

Particularly Henning Dieterichs (unofficial draw.io extension for VSCode), Preet (rough style for shapes) and Dan Brown, but we'd like to thank all those we sponsor for your contributions to the open-source community and our application.

New features and updates in 2022

The biggest and most recent new draw.io feature is our redesigned toolbar and menu for a distraction-free diagram editor.

The new simple mode takes the best parts of all of our editor themes and blends them together with a simple, responsive toolbar and large drawing canvas. To switch to this mode, click on the sun/moon in the top right, and select Simple.
Draw a freehand shape in your diagram via the toolbar in simple mode in draw.io

  • draw.io users in Confluence Server/Data Center can apply a sensitive label to exclude diagrams from recent lists and search.

  • draw.io users in Confluence, and with Google Drive and Microsoft One Drive can see each others' mouse cursors in real time as they collaboratively edit a diagram.
    Share your mouse cursor with others who are editing the same draw.io diagram in Confluence Cloud

  • Improvements were made to the mass Gliffy import and Confluence instance migration tools for draw.io users.

  • Shape libraries have been expanded and updated with new icons - particularly the Azure, AWS, Google Cloud and SysML shape libraries.

  • You can add and edit translations within the shape labels as shape metadata - no need to keep separate diagrams for separate languages.
    Translate labels on shapes and connectors directly in the draw.io editor

  • The editor was translated into new languages - Lithuanian and Latvian.

  • Switch between dark and light modes without having to reload the browser tab - click on the sun/moon in the top right and select Dark.

  • A connection point editor tool was added - you can now easily customise the fixed connection points for any shape on the drawing canvas.
    Move, delete and add connection points to a shape visually in draw.io

  • Swap existing shapes on the drawing canvas by holding down Shift as you drag one over the other. Flip connectors and groups of shapes via the Arrange tab on the format panel.

  • Number shapes and connectors with the built-in enumerate property (to replace the number plugin).

  • To run your own diagramming server, you can use our Docker image of draw.io for secure and private diagramming behind your firewall.

  • Freehand drawing was updated with a variable size brush, which works well with a tablet and pen.
    Freehand drawing in draw.io on a tablet - click the freehand tool in the toolbar on the left

  • Several advanced tools and features were updated, including Mermaid import, mathematics typesetting, rough style, CSV import, image cropping, font mapping, SVG export, drag and drop diagram import, and more.

  • More integrations with a wider range of tools for built-in diagramming - thanks to the developers who have integrated our open-source diagram editor.

And, of course, our team also published a mountain of bug fixes, security patches and smaller optimisation changes to both the web version of draw.io and our own draw.io app integrations.

Keep a draw.io diagram out of the recent diagrams list and search results with a sensitive label

· 3 min read
draw.io
draw.io Team

When you apply a sensitive label to a draw.io diagram in Confluence Server/Data Center, it will not be listed as a recent diagram or in the diagram search results when creating a new diagram or embedding a diagram.

Note: This is a new feature for draw.io in Confluence Server/Data Center version 8.x. It is not yet available in draw.io for earlier versions of Confluence Server/Data Center or in Confluence Cloud.

Why is this useful?

Use the sensitive label to ensure that draft diagrams are not copied or embedded until they are finalised or approved, and the label on the diagram file attachment is removed.

Mark a new diagram as sensitive

At the bottom of the new diagram dialog, enable the Mark as sensitive checkbox.
Mark a new diagram as sensitive when you create it to hide it from the recent diagrams list and search results

For example, the circle diagram on this page was marked as sensitive. You can see this via the labels in the page attachments list.
Confluence page attachments where the circle diagram file has two labels - drawio and sensitive

Now when you create a new diagram or embed an existing diagram, you won't see this sensitive diagram in the recent diagram list. It will also not be shown when you search for the diagram's filename.
Diagram files that have the sensitive label will not be shown in the search results, even when you search for their exact filename

Add a sensitive label to an existing diagram

All draw.io diagram attachments on a Confluence page are given the drawio label by default. You can add a sensitive label to an existing diagram via the Confluence Server/Data Center page attachments.

  1. On the page that contains the diagram file, click on the three dots to open the menu and select Attachments.
    Open the page attachments on a Confluence Server/Data Center page to see all the diagram files attached to that page
  2. Find the name of the diagram file you want to mark, click on the label icon next to the existing drawio label.
    Click on the label icon next to the diagram file you want to mark as sensitive on the Confluence Server/Data Center page
  3. Type sensitive and click Add, then click Close.
    Type the new label 'sensitive' in the text box and click Add to add the new label to that attachment on the Confluence Server/Data Center page

Remove the sensitive label from a diagram

  1. Open the page attachments in the same way as above.
  2. Find the name of the diagram file, and click on its label icon.
  3. Click on the little cross next that is on the sensitive label to delete it.

Draw Azure architecture diagrams with updated shapes

· 7 min read
draw.io
draw.io Team

The Azure shape library in draw.io has been updated. You can draw Azure architecture diagrams for your cloud infrastructure from scratch, or import .vsdx files or exported diagrams from automated infrastructure documentation apps like Cloudockit.
Azure architecture diagrams are easy to draw with the hundreds of Azure shapes in draw.io

Open this Azure architecture example in the online draw.io editor

Draw Azure diagrams in logical blocks

You will likely never draw a single Azure diagram that contains all levels of detail. You can either start with the overview diagram and work from this top level down to the details, or bottom up starting with the logical blocks in your architecture.

  • Azure architecture overview diagram: Includes design principles and the broad choices of specific services in your subscriptions.

  • High-level Azure diagrams: Includes Azure services and their configuration, resource groups, virtual networks, and environments. Performance, regional service provision, availability zones, monitoring, backup and recovery services are included at this level of detail.

  • Low-level diagrams: These are less common, and usually document the specific details needed to implement the design and the continuous integration/continuous deployment pipelines.

Enable the Azure shape library

  1. Go to our online editor or open one of the draw.io integrations or our desktop app.
  2. Click on More Shapes at the bottom of the left panel.
  3. In the Networking section, click on the checkbox to enable the Azure shape library, and click Apply.
    Select the Azure shape library in the Networking section to use these shapes

The Azure shape library will load in the left panel, with its shapes separated into categories.
The Azure shape library is well organised into categories

Tip: You can also search for Azure using the Search Shapes text box to see a list of all Azure shapes not sorted in categories.
Search for 'azure' to see all the shapes without them being sorted into categories

Use the scratchpad

Many Azure architectures repeat sub-sections of the architecture for backup or redundancy purposes. Instead of placing copies, you can put that sub-section into the scratchpad.

  1. Select all the shapes on the drawing canvas that you want to repeat.
  2. Drag these onto the scratchpad in the left panel.

Click on the sub-section shape in the scratchpad to add it to the drawing canvas, or drag another copy from the scratchpad into position.
Use the scratchpad to quickly copy common subsections of your Azure architecture diagram

See how to use the scratchpad in draw.io

Use rectangles to indicate regions

Use rectangles from the General shape library to indicate a region. Once you've placed and resized a region shape, send it to the back on the Arrange tab of the format panel so that it is placed behind the Azure architecture's shapes.
Move region shapes to the back via the Arrange tab of the format panel, behind the other shapes in your Azure diagram

Next, update the rectangle style to separate regions in the Style tab of the format panel on the right.

  • Dashed outline - Change the Line of the region to Dashed using the dropdown list, and ensure the Fill checkbox is not selected to remove the background.
    Change the Style of basic rectangles in the format panel to indicate different regions in your Azure architecture

  • Coloured background - Click on the colour block to the right of the Fill checkbox and select a new colour from the palette. Ensure the Line checkbox is not selected or set the colour to match the fill colour.
    Change the Style of basic rectangles in the format panel to indicate different regions in your Azure architecture

Tip: Group all of the shapes contained within the region with the region rectangle so you can more easily move them together.

Draw connectors

Hover over any shape in the diagram to drag a connector from one of the four connection arrows, then drop it on another shape (or group of shapes) to connect the two.

Floating connectors: Floating connectors move around the perimeter of the shape intelligently as you reposition it on the drawing canvas. Drop the connector on the target shape when the outline is blue.
Use floating connectors to make it easier to move the Azure shapes around on the drawing canvas

Fixed connectors: Fixed connectors remain connected to a particular point on the target shape when you reposition it. Drop the connector on a connection point (a little cross) or when the outline of the shape is green.
Use fixed connectors to ensure a connector stays attached to that particular point when move the Azure shape around on the drawing canvas

Learn more about working with connectors in draw.io

Azure architecture templates

Several Azure diagram templates are available in the template library.

  1. Click Arrange > Insert > Template to open the template library.
  2. Expand the Cloud section and select Azure to see the Azure diagram templates.
    Start with a template for your Azure architecture diagram in draw.io
  3. Click on a magnifying glass in the top right of any template to see a preview.
  4. Select a template and click Insert to add it to the drawing canvas.
    Start with a template for your Azure architecture diagram in draw.io

Export and embed your Azure diagram

Select File > Export as from the menu.

Tip: Make sure you select the Include a copy of my diagram in the Image export options dialog to allow those you share it with to edit it.

Embed diagrams in the following documentation platforms

Create data-driven diagrams with draw.io

· 8 min read
draw.io
draw.io Team

Using diagrams.net or draw.io together with scripts and data sources, you can create data-driven diagrams, with colours, shapes, text labels and even animations that change to reflect live data.
Update shapes in a diagram based on live data with draw.io, Grafana and the Flowcharting plugin

Aside from live diagrams of cloud network infrastructures, and charts that visualise data in graphs, there are few true data-driven diagrams. As draw.io does not include spreadsheet or graph functionality - it's a diagram editor - dynamically updated charts are not possible.

You can program your own scripts or use integrations with other applications to achieve data-driven diagrams where diagram shapes change to reflect live data because draw.io is open source and the .drawio diagram format uses accessible XML.

How it works

Each shape in a draw.io diagram has a unique shape ID.

Because the diagram data is stored in your file using XML tags, you can use a script to search for the shape ID in the XML source and replace common shape properties with a different value to reflect the data at that time.

What you'll need

  • diagram created in the draw.io editor and saved as an XML file
  • application or script to do the following:
    • display and refresh the diagram
    • query or read the live data
    • analyse the data values and update the shape properties in the diagram according to programmed rules

Example - factory status floorplan

To show you how to build such a data-driven diagram, we'll use an example of a dashboard that shows the status of a machine on a factory floorplan based on real-time sensor data from that machine.

This example uses Grafana and Arnaud Genty's Flowcharting plugin to feed the real-time sensor data recorded in a database to scripts that update the shapes in the diagram based on rules that we define.


Draw your diagram and set it up for data

Create your diagram in draw.io online or one of our draw.io apps.

You can draw any type of diagram - flow charts, wireframes, floorplans, org charts, wiring diagrams, etc.

Avoid using complex shapes for elements you want to update. Those that contain multiple fields, like tables, entity shapes or swimlanes won't typically have unique IDs that you can refer to later.

In this example, we've created a factory floorplan with simple text shapes to show important machine information.
Draw your diagram in draw.io

Set custom unique shape IDs

For each shape that will dynamically update based on a data source, you should override the auto-assigned shape ID to make it easier to refer to later.

  1. Right-click on a shape and select Edit Data. Alternatively, select a shape and press Ctrl+M or Cmd+M.
  2. Hold down Shift and double click on the ID string at the top.
  3. Change the shape ID to something more memorable - make sure it is unique.
  4. Click Apply to save the new shape ID, then click Apply to save the shape data.
    Give each element in your diagram that you want to dynamically update a new, memorable and unique shape ID via its shape data - select a shape and press Ctrl+M

In our example, all of the text shapes that say Text are to be updated. Each has been assigned a new custom unique shape ID.

View the shape IDs in the Properties section on the Style tab.
Check each shape has a unique ID assigned in the Properties section of the Style tab in the format panel

Export your diagram as an XML file

You need to read (and copy) the full XML source of your diagram, so export it as an XML file so it can be easily opened by a text editor.

  1. Select File > Export As > XML from the menu.
  2. Save the file to your local device.

Create a dynamic dashboard

  1. Install Grafana and the Flowcharting plugin.
  2. Configure one or more data sources in Grafana.
  3. Create a new dashboard and add a Flowcharting panel.
    Install Grafana, connect a database and create a dashboard with the Flowcharting plugin - you can add the .drawio diagram in the next step

Add the diagram to the dashboard

  1. Open the diagram .xml file you previously saved in a text editor.
  2. Copy all the diagram data that appears after the initial <?xml ... > tag.
    Open the .xml file in a text editor and copy all of the text that appears after the first XML tag
  3. Now, add the diagram data to the Flowchart panel in Grafana.
  • Set the Editor URL & Theme to our online service at embed.diagrams.net, and select Dark or Light from the drop down list. If you run your own draw.io server, use its URL instead.
  • Set the Source Type to XML.
  • In the Source Content text field, paste the diagram data you copied from your text editor.
    Add the diagram data to the Flowchart panel in Grafana

The diagram will appear in the dashboard preview panel.

Map diagram shape IDs to data queries with rules

Now, you need to link the diagram shapes you want to update, with queries of a data source and rules defined in the Flowchart panel.
Map the diagram shapes you want to dynamically update to data using rules in the Flowchart panel in Grafana

  1. Write the queries to extract the data you need from your data sources. Set the name of the metric to the diagram shape ID that it updates so it's easier to see which query updates which shape.
    Update the name of each metric to match the diagram shape ID that it updates for ease of understanding
  2. Set the behaviour in the Mapping section for each query.
    • Set Identify by to ID as that is how we identify a specific shape.
    • Enable Regular expression and add some rules. In the What field of the rule, enter the specific shape ID for the shape you want to update.
      Set up the rules for each of the shapes you want to update based on data query values
      The shape label is Active or Stop based on the latest database value.

Refer to the Flowcharting mapping documentation if you need help with this step.

You can change the colour or tooltip of the shape, its text label or link, or add an animation.

Now, when your dashboard runs and your data queries are updated, your diagram will update according to the rules you have set.

Update shapes in a diagram based on live data with draw.io, Grafana and the Flowcharting plugin

More data-driven diagram examples

  1. Select one of these live examples of diagrams in the Flowcharting plugin.
  2. Expand the title and select Edit to see how it is set up.
    Have a look at a live example of a draw.io diagram used with the Flowcharting Grafana plugin

Translate diagrams in the draw.io editor

· 5 min read
draw.io
draw.io Team

By using URL parameters with our online version of draw.io, you can add translation properties in the shapes themselves while you work in the diagram editor. You can switch languages in the editor via the Extras > Diagram Language in Classic mode, and via Settings > Diagram Language if you use Simple mode.
Translate labels on shapes and connectors directly in the draw.io editor

If you want to make a diagram available in multiple language, most diagramming applications require you to use separate files. Changes made to the original diagram require edits to multiple copies of a diagram.

Translating directly in the diagram editor has a number of advantages:

  • See the label strings in context and translate a diagram faster.
  • Check that labels in different languages still fit, without having to understand the language.
  • Modify the diagram once - not separately for each language.

Diagram translation is enabled by default

If switching the diagram language as described below doesn't work, make sure it is not disabled via the menu.
If you can't switch the diagram language even though you have written labels in multiple languages, check that Diagram Language is not Disabled via the Extras or Settings menu

Explicitly enable diagram translation

Add the translate-diagram=1 URL parameter to the URL of our diagram editor, or go directly to the following link:

Alternatively, add "translateDiagrams": true to the draw.io editor configuration.

Translate labels on shapes and connectors

When you have enabled the diagram translation feature via the URL parameter above, the original label is shown at the top of the Edit Data dialog.

  1. Right-click on a shape or connector and select Edit > Edit Data from the context menu. Alternatively, select a shape and press Ctrl+M or Cmd+M.
  2. Add a language for the label in the format label_XY where XY is a two-letter language code, and click Add Property.
    Add a shape property for each language of a shape's label in the diagram editor to translate directly in the editor
    E.g. label_de is German, label_es is Spanish, label_jp is Japanese, etc.
  3. Enter the translated text to the right of the shape property you just added. Click Apply when done.
    Add the translation of the label to the shape property and click Apply

Now, when you hover over a shape in the editor, you can see which languages have been added.
Hover over a shape in the diagram editor to see which languages have been added to the Shape data

Tip: To get rid of a translation, click the x to the right of the translated string.

Note: If you don't see the original label in the Edit Data dialog, you haven't enabled the diagram translation feature with the URL parameter above. Add the parameter to the app.diagrams.net URL in your browser, and if necessary, reload the diagram in the editor.

Switch diagram language in the editor

Once you have added a translation to a shape or connector label, you can switch the diagram to that language via the menu. This doesn't change the editor's language - only the text in the diagram.

In the diagram editor:

  1. Open the menu and select Settings > Language.
  2. Choose the language you want to use and refresh the browser tab.
    Select Extras /> Diagram Language and enter a two-letter language code to switch the diagram to another language using the shape properties for that language
    Open this example in the draw.io editor

The labels of shapes that have that language in their shape properties will update and display in that language. Any shapes that have not yet been translated will continue to display a label in the original language.

Switch diagram language in the lightbox viewer

At the moment, you need to use URL parameters to change the language of a diagram when it is displayed in the lightbox (such as when you export the diagram as a URL).

Add both &translate-diagram=1&diagram-language=XY to the lightbox URL, where XY is the language you want to view the diagram in.
Add URL parameters to select a different language in the Lightbox at viewer.diagrams.net

Gliffy vs draw.io - concurrent editing

· 4 min read
draw.io
draw.io Team

TL;DR : Gliffy on Confluence Cloud saves with last write wins, you lose data concurrently editing. draw.io supports real-time collaborative editing with shared cursors.

Gliffy vs draw.io for Confluence

When comparing diagramming apps, you'll see lists of standard Confluence-supported features - sharing, import and export, search, version history, customisation, security - and, of course, pricing.

Unlike Gliffy, draw.io has concurrent diagram editing. All team members' changes are merged and synchronised - visible to each other in the diagram editor.

When you choose to show your cursor, your team will see where you move your mouse and what you select, all in real-time.

Shared cursors mean better collaboration in draw.io for Confluence

Each person who is editing a draw.io diagram in Confluence is assigned a colour. Cursors are shared by default - you'll see everyone's name with their mouse pointer as they move around and edit the diagram.
Share your mouse cursor with others who are editing the same draw.io diagram in Confluence Cloud

Additionally, when you select a shape everyone else will see it highlighted in your colour.

Don't lose diagram data - use draw.io

More importantly than seeing a mouse cursor in real time, you don't want to lose any changes as you collaboratively edit a diagram.

That's why draw.io merges and synchronises the changes while you are editing. You don't even have to publish the diagram to Confluence to see everyone's changes in the editor - draw.io saves and synchronises automatically.
When multiple people edit draw.io diagrams in Confluence, share cursors to see their mouse movements and selection. As changes as they are made, they are saved and synchronised to your editor.
Recorded using two different devices, both editing the same draw.io diagram file in Confluence Cloud. Changes are constantly merged and the draw.io diagram is updated in the editor in real time.

Now, let's contrast the collaborative editing process in draw.io the animation above with editing a diagram in Gliffy.

Gliffy vs draw.io - when a team edits a diagram

The following example shows that you can't see the changes made by others while editing the same Gliffy diagram in Confluence, and that Gliffy follows a last-write-wins approach.

1: Person A adds a shape and publishes the edited Gliffy diagram, then returns to Confluence to view it.
2: Person B was already editing the Gliffy diagram file, so doesn't see the added shape, or that any changes were made by another person.
3: Person B deletes an existing shape and publishes their version, returning to Confluence to view it.
4: Because Person B's Gliffy diagram was the last to be published, it overwrites and ignores the changes made by Person A.

Recorded using two browser windows, both editing the same Gliffy diagram file in a Confluence Cloud instance

Person A must now manually refresh their browser tab to see the updated Gliffy diagram. Only then will they see that their changes have been overwritten by Person B.

Person B remains unaware that another person had edited the Gliffy diagram.

Use draw.io to avoid this problem - share your cursor and let others see you collaboratively edit a diagram in Confluence.

Updated shapes for GCP and AWS network diagrams

· 4 min read
draw.io
draw.io Team

You can create network diagrams from scratch in draw.io using shapes that match the platform you are using - AWS, GCP, Veeam, Azure, Cisco, IBM and many more. Both the draw.io AWS19 and GCP Icon shape libraries for network and cloud architectures have been updated recently.

Open the updated network shape libraries

Both the Amazon Web Service and Google Cloud Platform shape libraries have been updated recently. Enable the shape libraries that you need to use in draw.io.

  1. Click on More Shapes in the left-hand panel.
  2. In the Networking section, click on the checkboxes next to the libraries you want to enable, then click Apply.
    Enable the AWS19 shape library for Amazon Web Services infrastructure diagrams in draw.io

If you want to see the shape names even when you aren't hovering over a shape in the shape libraries, click on the Labels checkbox in the shape library selection dialog.

Hover over any shape in the shape libraries on the left of the drawing canvas to see a preview and its name.
Hover over any shape to see a preview and its name in draw.io

Drag the shape library panel edge towards the drawing canvas to expand the panel and see more shapes.
Drag the edge of the shapes panel to make it larger

Updated AWS19 network shapes

Enabling the AWS19 shape library will give you a large number of sub-libraries in the left panel, sorted into logical categories. Expand the categories that you need by clicking on the sub-library's title or the arrow next to it.

As you can see below, the AWS19 shape library for modelling cloud service architectures on Amazon's platform is large and varied.
The AWS19 shape library for Amazon Web Services infrastructure diagrams has been updated in draw.io

Create a new diagram with the AWS19 shape library already enabled

Updated GCP Icons

The large Google Cloud Platform shape library containers older labels and icons, whereas the updated GCP Icons are sorted into their own shape library. Click More Shapes and enable the GCP Icons library to see updated sub-libraries shown below.
The GCP icons shape library for Google Cloud Platform infrastructure diagrams has been updated in draw.io

Create a new diagram with the GCP Icons shape library already enabled

Some cloud visualisation platforms can output diagrams in the .drawio format, including Cloudcraft and Cloudockit.

Embed the exported diagram in your system documentation or display it in your wiki with one of our draw.io integrations.

Network diagram templates

draw.io includes many templates for common cloud infrastructures on several platforms. Select Arrange > Insert > Template from the menu.
Network diagrams in the templates at draw.io

Reporting issues, suggesting features and upvoting

· 6 min read
draw.io
draw.io Team

We've recently implemented a number of features, most popularly requested via our drawio Github repository. To reach support at draw.io for diagrams.net and our draw.io apps, please read and follow the instructions on our support page.

Skip to the end of this post to see how to upvote existing issues and feature requests.

Tip: To use the updated features in our online editor, clear the draw.io cache in your browser (clear.diagrams.net), then reload the draw.io editor.

Crop images in the diagram editor

You can now crop images in the draw.io editor. This works on both images imported into the editor from your device, as well as images embedded from a URL.

  1. Right click on an image and select Crop.
  2. Resize the crop using the grab handles and drag the crop box to reposition it.
    • Click on Ellipse to use a circular or ellipse-shaped crop.
    • Click on Rounded to round the corners on the rectangular crop.
  3. Click on Apply
Crop an embedded or imported image in draw.io

This is a non-destructive crop. To reset the crop to the original image, click on Reset in the crop image dialog.

Merge and unmerge table cells in the Sketch editor theme

Merge and unmerge table cells using the Table tool on the toolbar in the Sketch editor theme - our uncluttered online whiteboard theme.

These options only appear when you have selected multiple table cells or a previously merged table cell.

Merge two or more table cells

  1. Select two or more adjacent table cells (hold down Shift and click on multiple cells).
  2. Click on the Table tool in the toolbar and select Merge. Alternatively, click on Merge in the Arrange tab of the format panel.
    Merge table cells in the Sketch whiteboard-like editor theme in draw.io

Unmerge merged table cells

  1. Select the merged cells in the table.
  2. Click on the Table tool in the toolbar on the left and select Unmerge.
    Unmerge table cells in the Sketch whiteboard-like editor theme draw.io

In all of the editor themes, you can also unmerge merged table cells via the Arrange tab of the format panel.
Unmerge table cells in the draw.io editor via the Arrange tab in the format panel

SVG export options for formatted text

Previously, draw.io exported shapes and labels with HTML formatted text embedded as a foreign object in the SVG. This displays fine in browsers, but a number of users had issues with exporting and editing in SVG editors, which wasn't a use case we had considered.

Now, you can choose how formatted labels should be exported, and whether the SVG file it should contain a warning about the text not being SVG.

For example, in the following diagram, some of the shapes have bold and italic words in the label text - they use formatted text.
You can use different formatting options inside a text label - on part of the label only

When you export this diagram as a SVG (File > Export as > SVG), you can now choose the Text Settings.

  • No Change includes the warning embedded in the raw SVG data (default).
  • Embed Fonts includes the fonts in the exported SVG file in case the viewer doesn't have the font installed.
  • Convert Labels to SVG transmits the diagram to our servers, generates a PDF, then pipes that through Inkscape, and returns the SVG output.
    Choose how to export formatted text labels when exporting to a SVG file

Note with this last option:

  • You transmit the diagram to our servers. Diagram data is not stored after this PDF/SVG conversion has finished and the SVG output is returned.
  • The text is converted to a path. Screen readers can't read it and you can't select it.
  • The file size will be larger.

To report a bug or request a feature

If you are using our draw.io apps in Atlassian Confluence or Jira, please contact your instance administrator for details of your support entitlement.

For our online diagram editor and any of the draw.io integrations that we support via our open source project, follow the steps below.

Go to the Issues tab in our drawio GitHub repository and first search through the list of existing issues to see if your issue or idea has been previously posted.

Upvote an existing issue or feature request

If you find an existing issue related to yours:

  1. Click on the issue title to see the full issue description.
  2. Click on the emoji icon at the bottom of the description, and select the 'thumbs up' icon.
    Register that you also have a reported bug or want the requested feature in our drawio repository on GitHub

This will ensure that the most popular bugs and feature requests get pushed to the top.

Raise a new issue or request

If you have a question, rather than want to report an issue or request a new feature, please look under the Discussions tab in our Github repository.

  1. From the Issues tab in our drawio GitHub repository, click on New issue.
  2. Click on Get started next to either Bug report or Feature request.
  3. Enter a clear and unambiguous title for your bug report or feature request.
  4. Follow the instructions and fill in the Preflight Checklist in the large text field.
  5. Describe your problems or suggested feature in the appropriate sections of the checklist, clearly and in detail.
  6. Click Submit new issue when you have finished.
    Register that you also have a reported bug or want the requested feature in our drawio repository on GitHub

Reviews from real draw.io users

· 3 min read
draw.io
draw.io Team

The barrier to anyone diagramming and whiteboarding with draw.io is lower compared to many other SaaS applications. From reviews and customer feedback, some of the things they like the most include:

  • you don't need to register and it costs nothing
  • you can diagram in all major operating systems
  • there is an offline desktop version
  • you can give your diagram to anyone else and they will be able to load and edit it freely
  • you can store unlimited diagram files wherever you prefer
  • project development is in the open and anyone can take part

But don't take our word for it - here is what draw.io users are actually saying on popular review sites.

On Capterra

Capterra verifies reviewers through LinkedIn and checks their reviews for a range of fraudulent activity and credibility. They are one most popular software review sites for businesses.

draw.io review from real users on Capterra


draw.io review from real users on Capterra


draw.io review from real users on Capterra


draw.io review from real users on Capterra

See more draw.io reviews on Capterra

On GetApp

GetApp has monitored software trends for the past 10+ years, and collates reviews on its site from a number of other trusted platforms.

draw.io review from real users on GetApp


draw.io review from real users on GetApp

See more draw.io reviews on GetApp

On G2

The G2 company gathers user reviews of software products from their own community, and aggregated data collated from various other social and online sources, with more weight given to recent reviews.

draw.io review from real users on G2.com


draw.io review from real users on G2.com

See more draw.io reviews on G2

Thank you to our reviewers

Useful as these reviews are, we don't actively monitor review sites regularly - if you have a suggestion or want to report a bug, please go to the the support page on the Github project. That is best place to get our attention.

New draw.io features and updates in 2021

· 9 min read
draw.io
draw.io Team

This past year has seen a number of new features and big updates to draw.io, including the online editor, our Confluence and Jira apps, and other integrations for a variety of platforms.

Data security and privacy

As a unique security-first diagramming app, we want to provide you with the best in data privacy and data security.

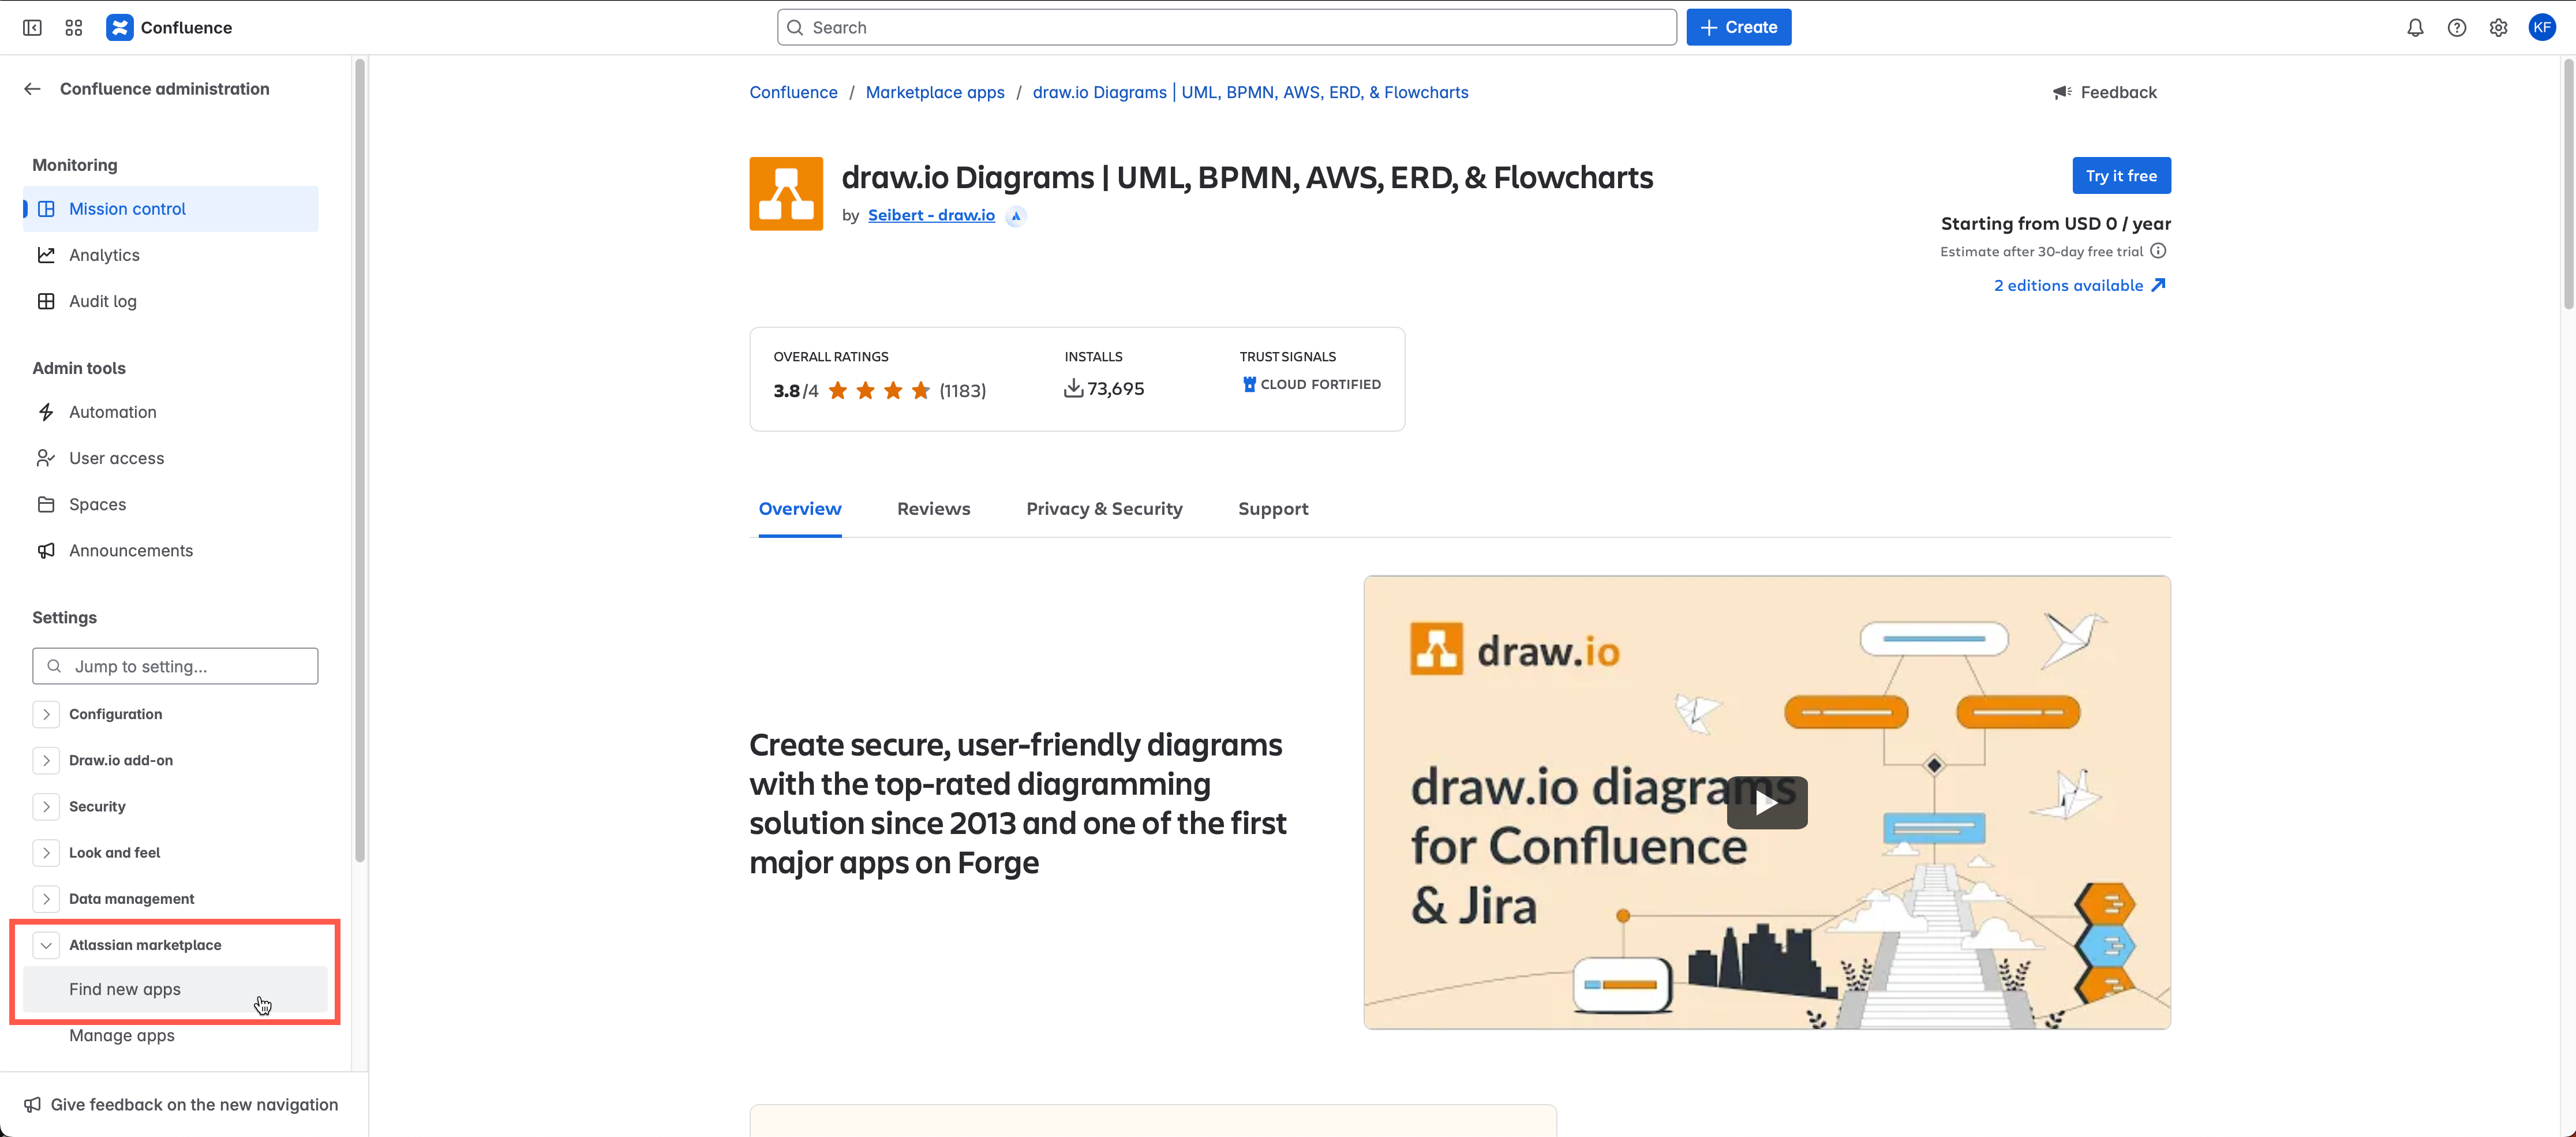
Building on the data governance and lockdown options we implemented last year, our draw.io branded app for Confluence Cloud and Jira Cloud was the first secure diagramming app to meet Atlassian's rigorous Cloud Fortified standard, making it your most secure choice for diagramming and visualization.

The draw.io App for Github is an alternative authorisation method you can use to limit draw.io's repository access to specific repositories, rather than all of the repositories in your account.

We researched a stricter implementation of our content security policy on the test se.diagrams.net domain. Take up of the domain has been very low, so we will port all the changes we can from that project and then close it down.

New and updated integrations

Several new integrations were released, and existing ones were updated in the past year. New and updated features common across all integrations are described in the following section.

draw.io for Atlassian Confluence and Jira

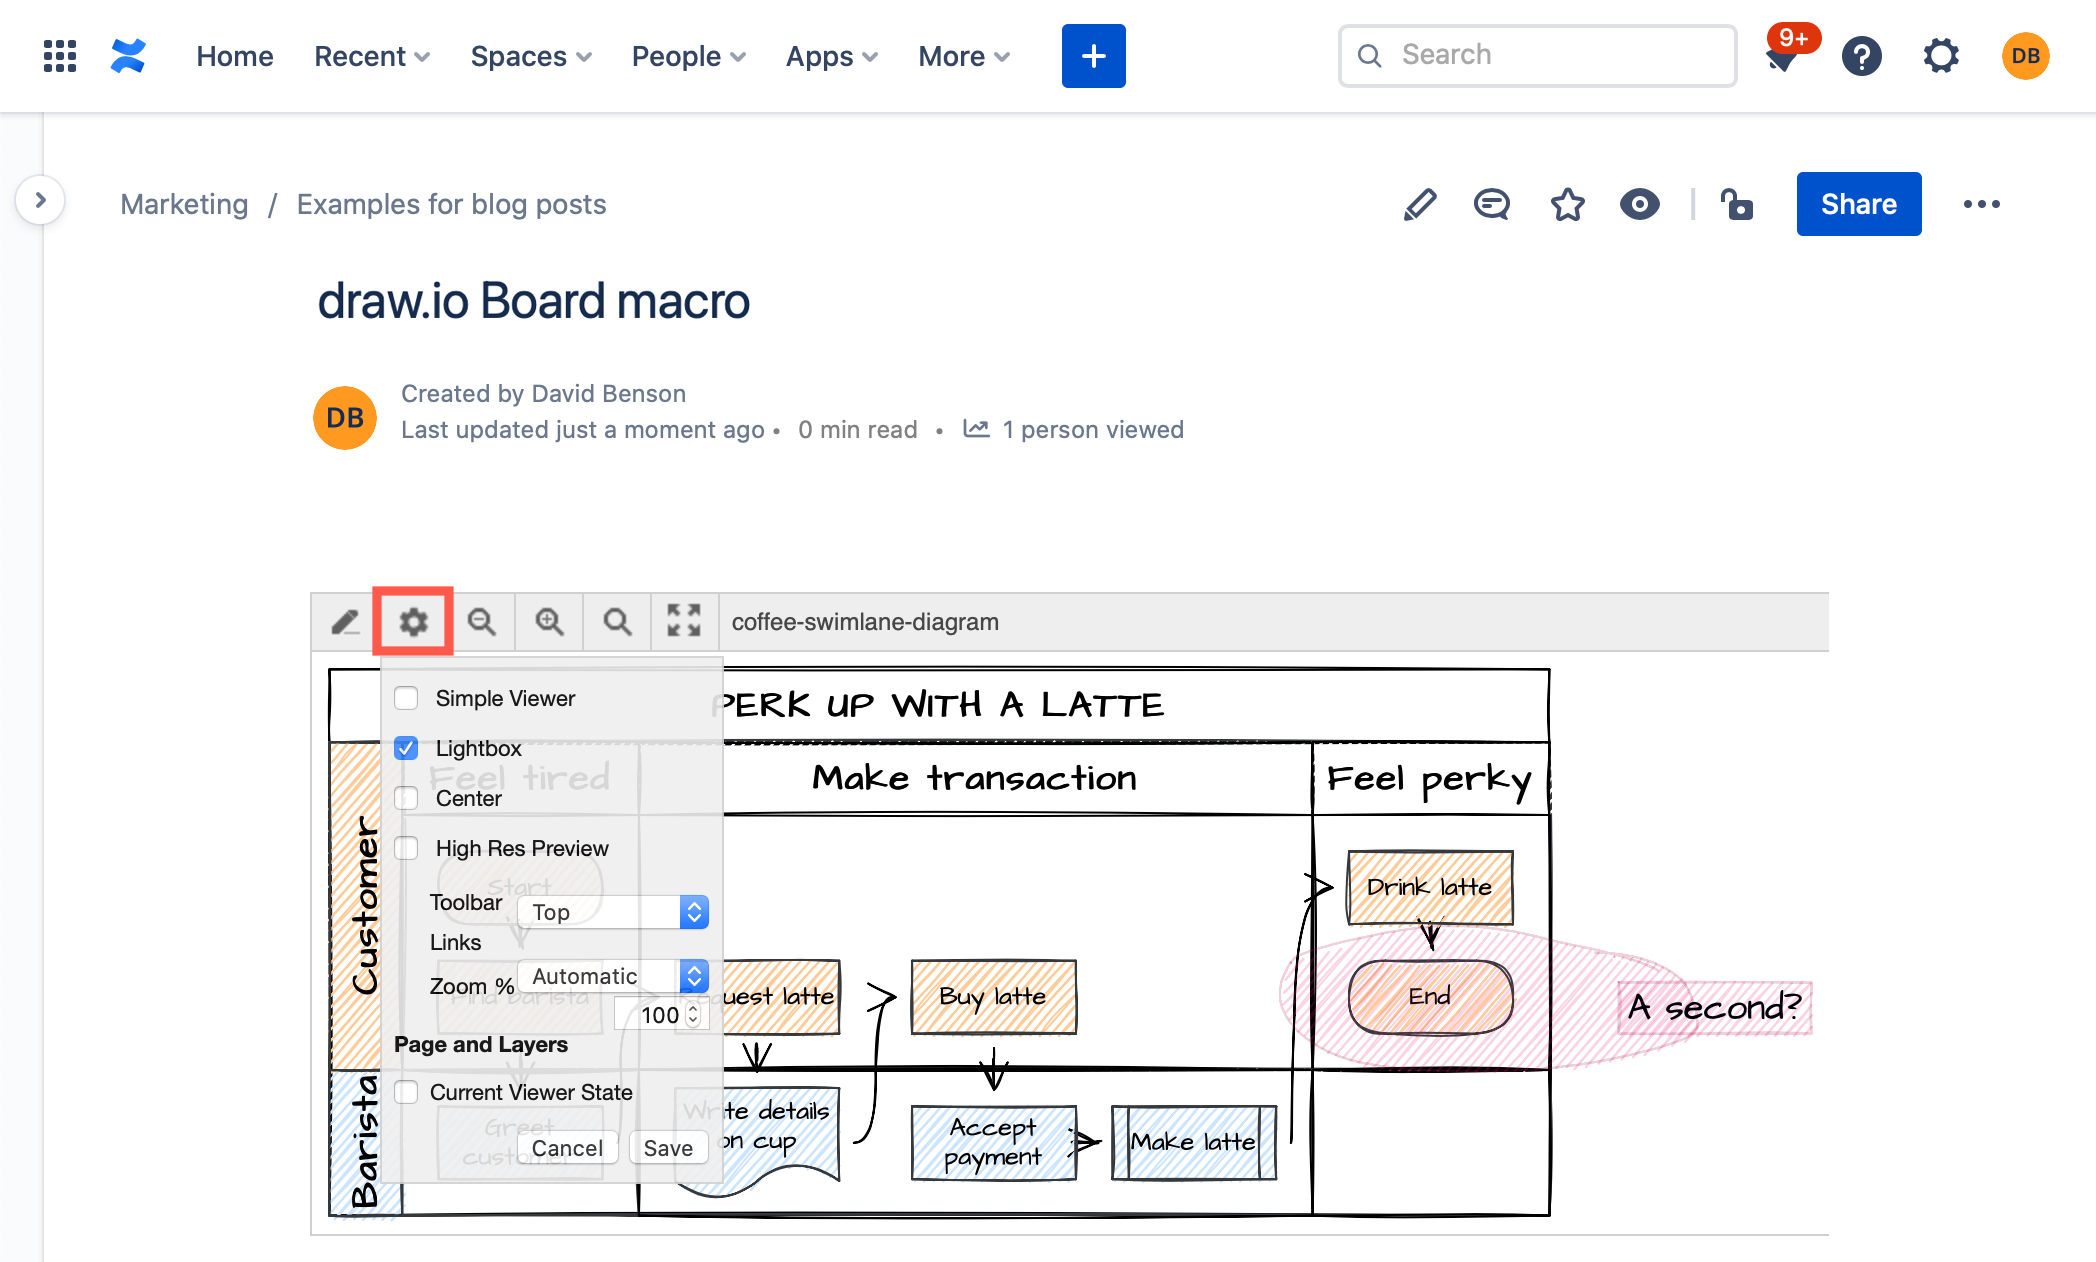
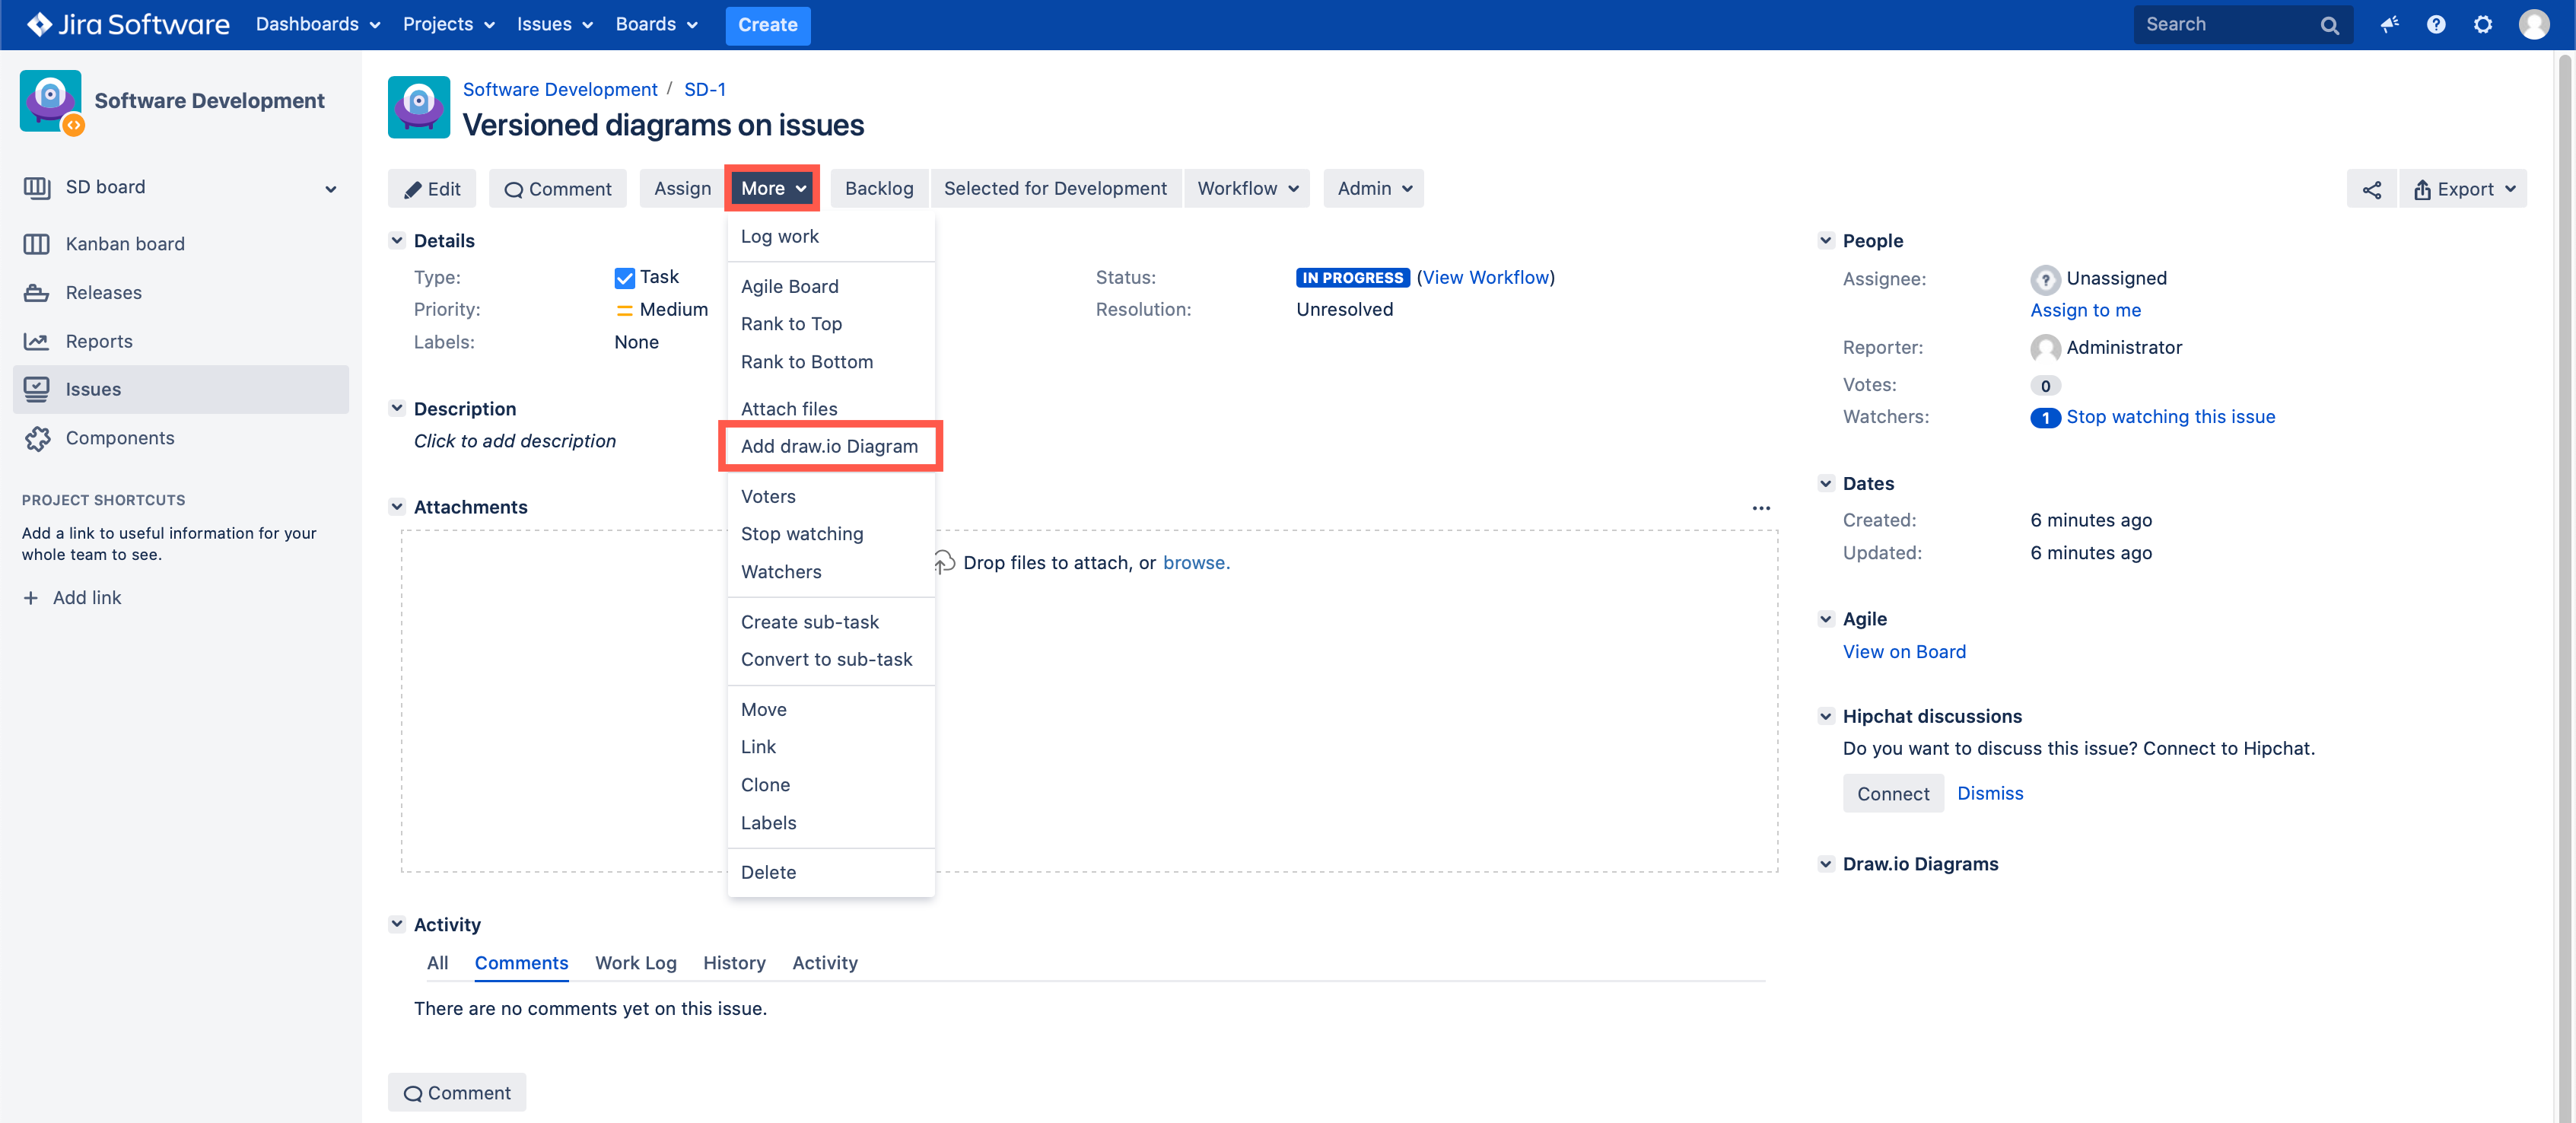
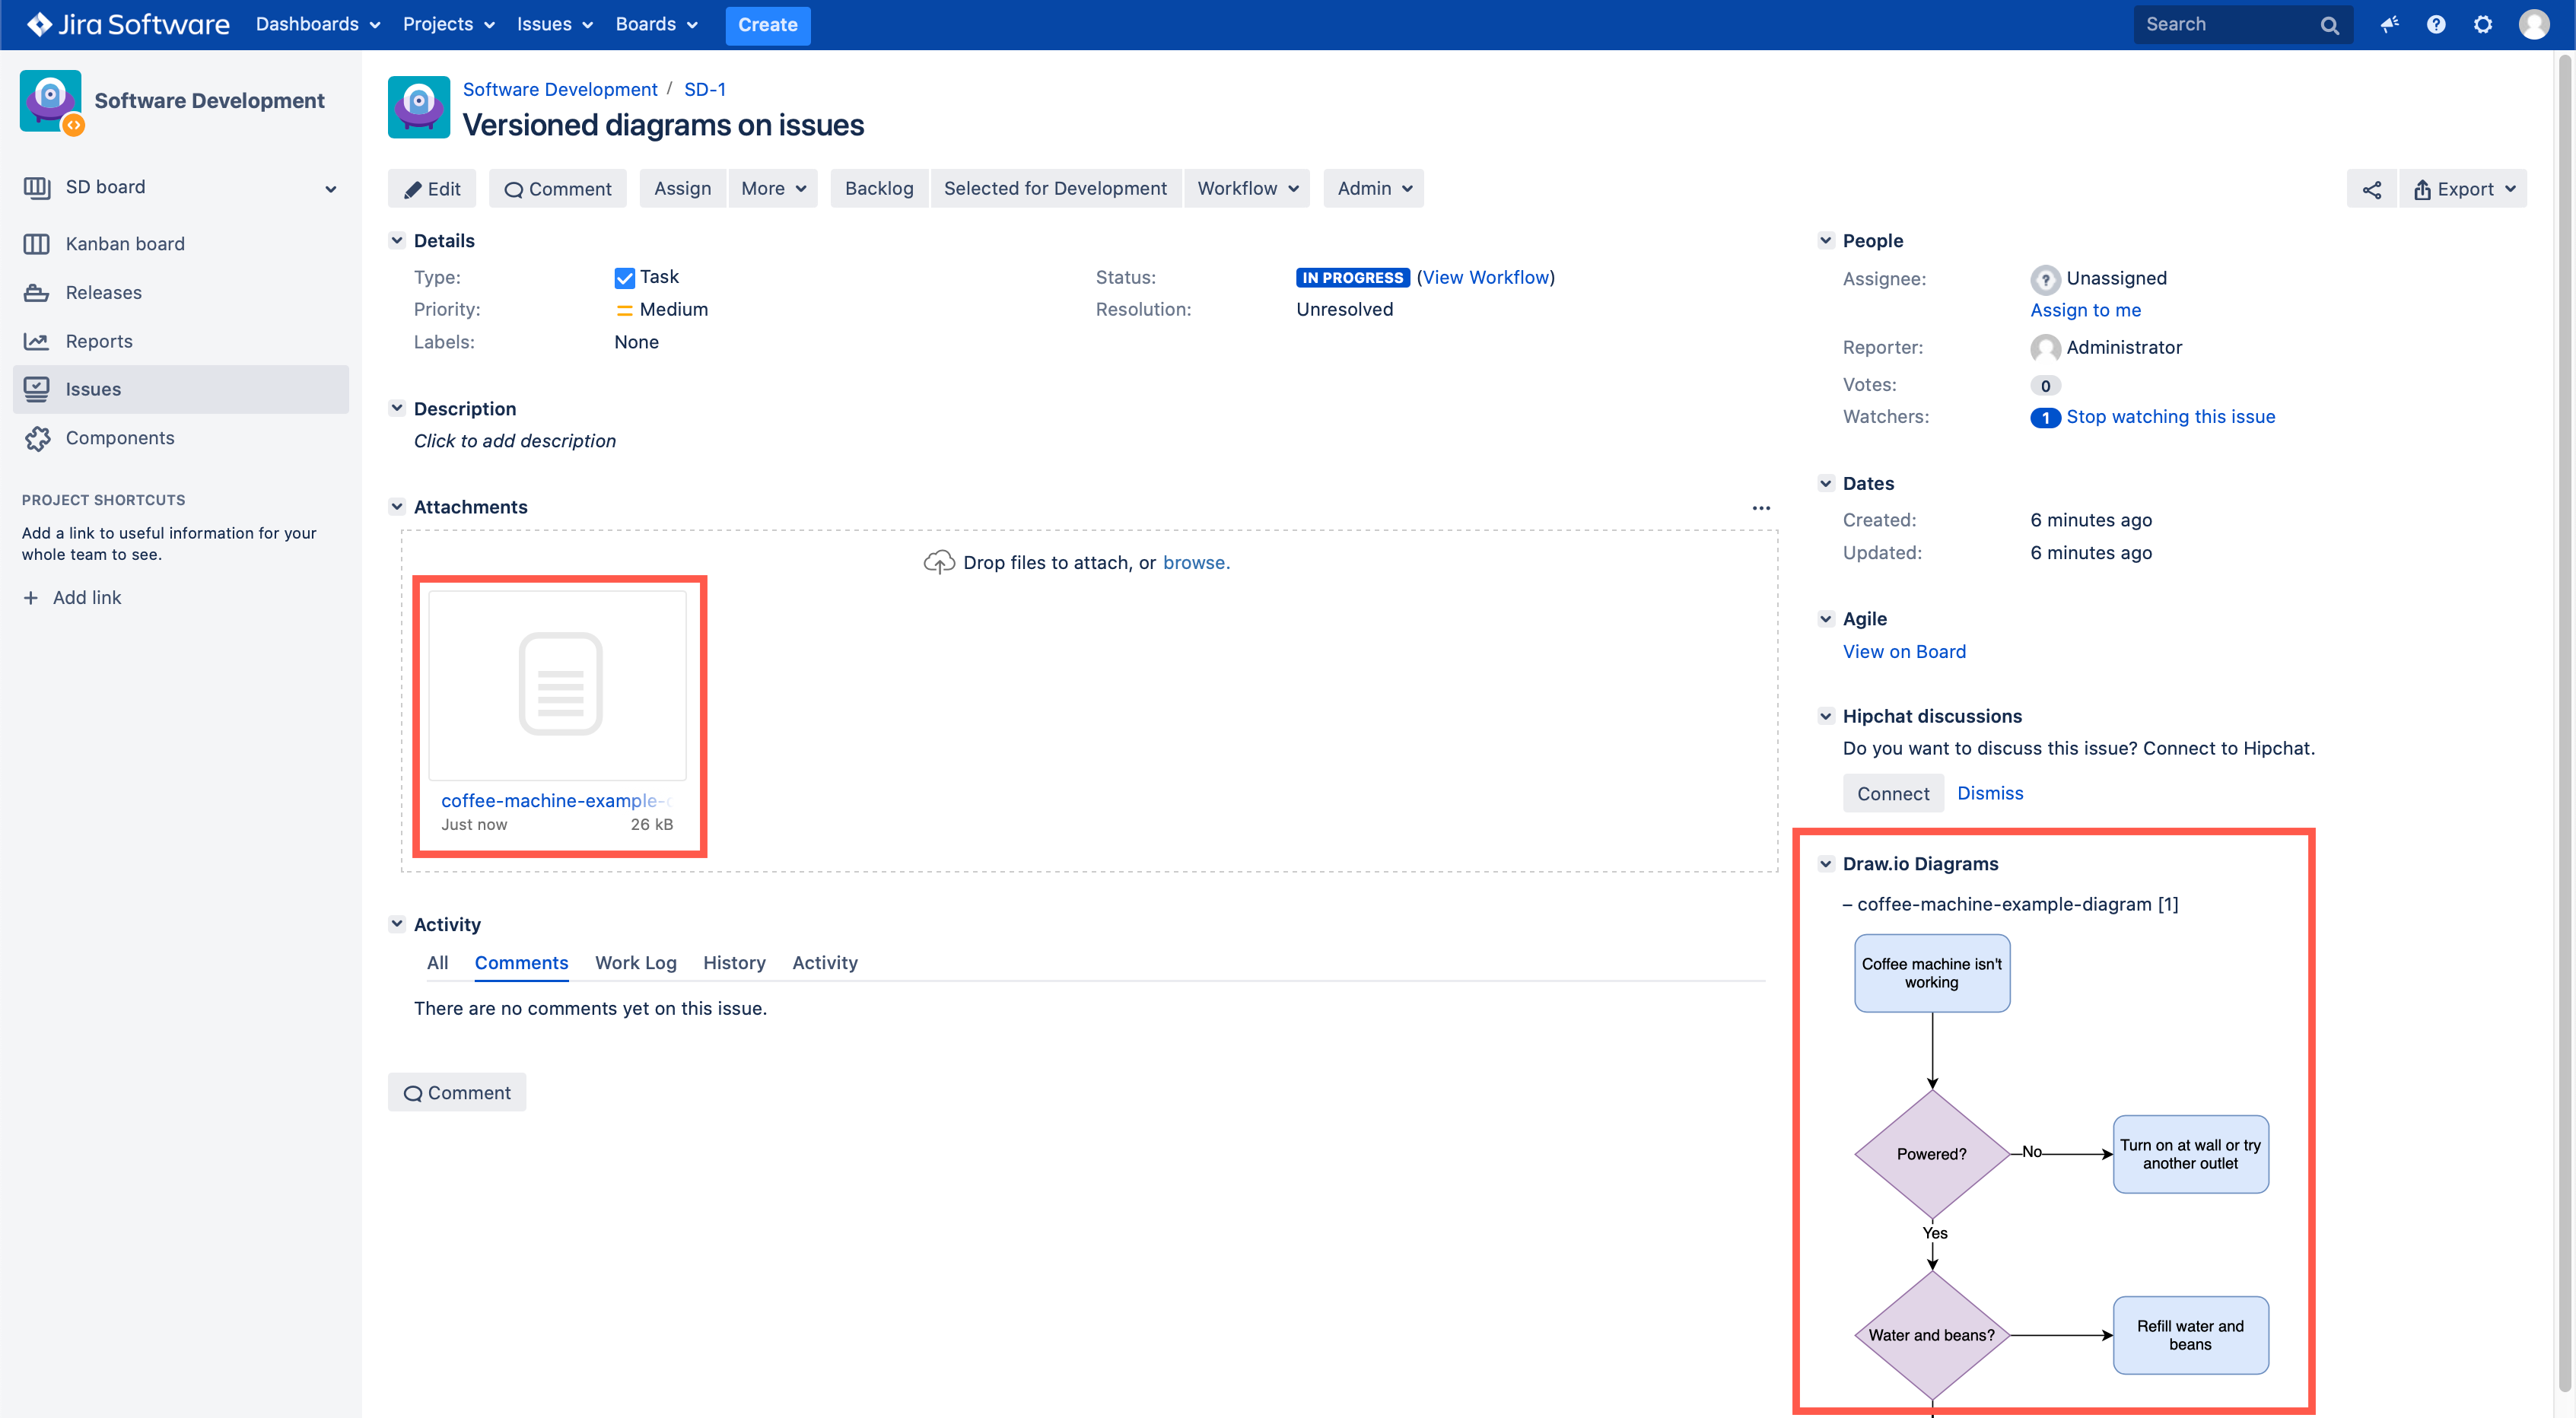
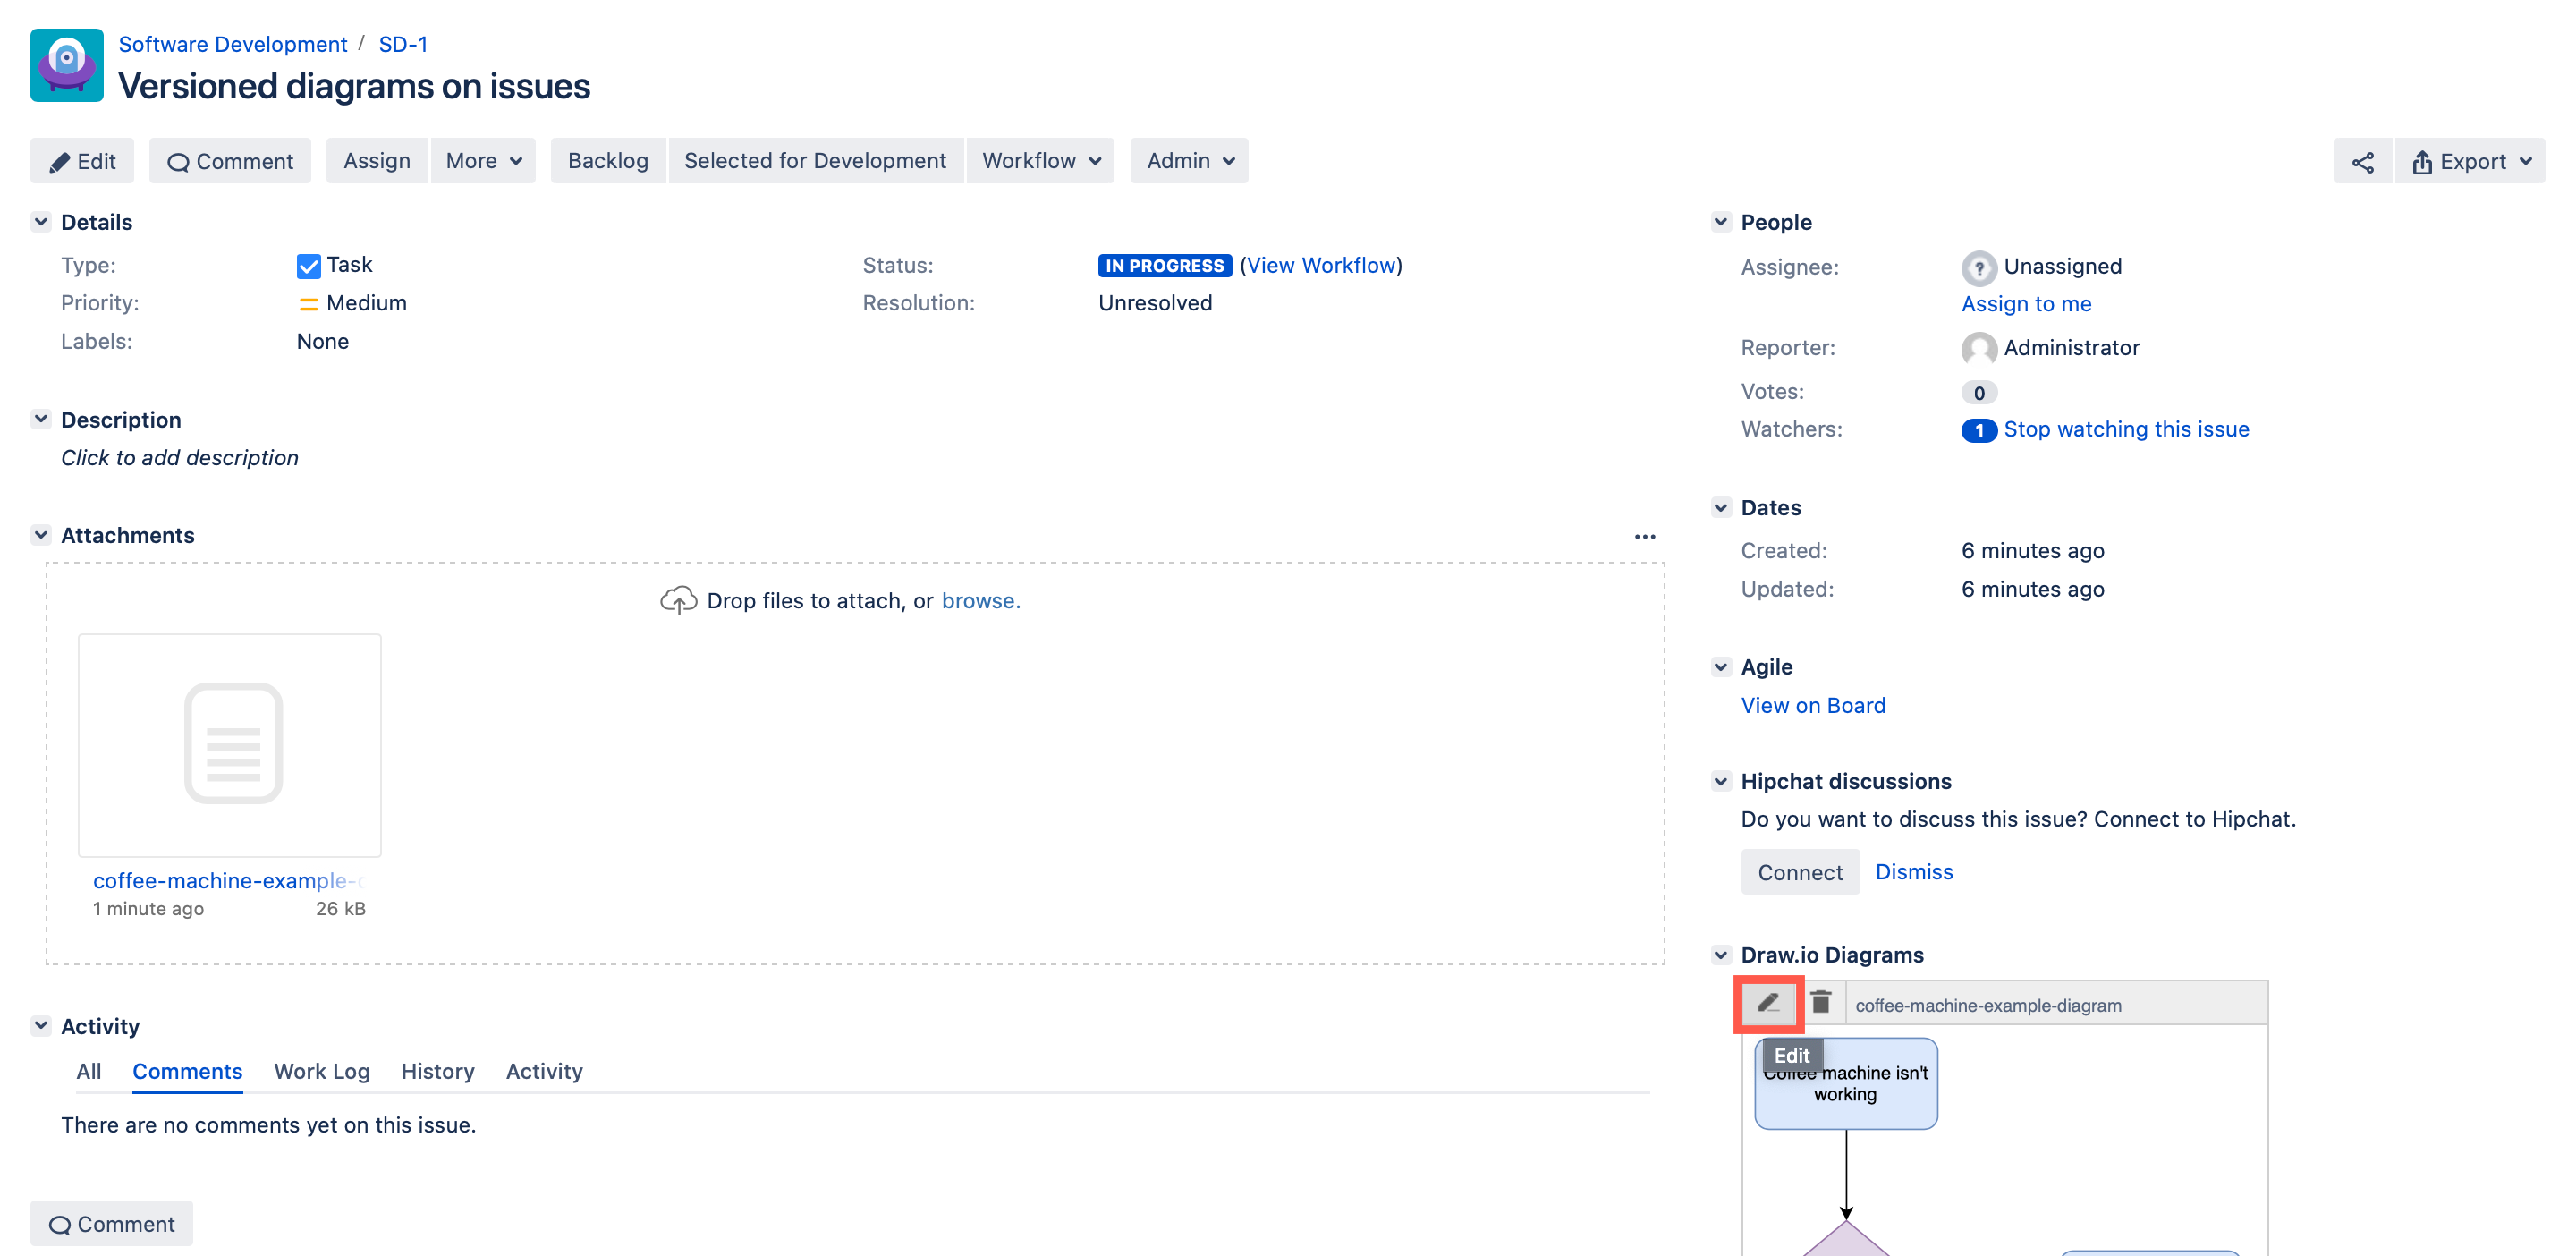
With the draw.io apps for Confluence Cloud and Jira Cloud, you can embed diagrams that are stored in Confluence Cloud in your Jira Cloud issues. Keep all of your visual documentation for systems, processes and software in your Confluence Cloud knowledge base, and reference them in your project tasks in Jira.

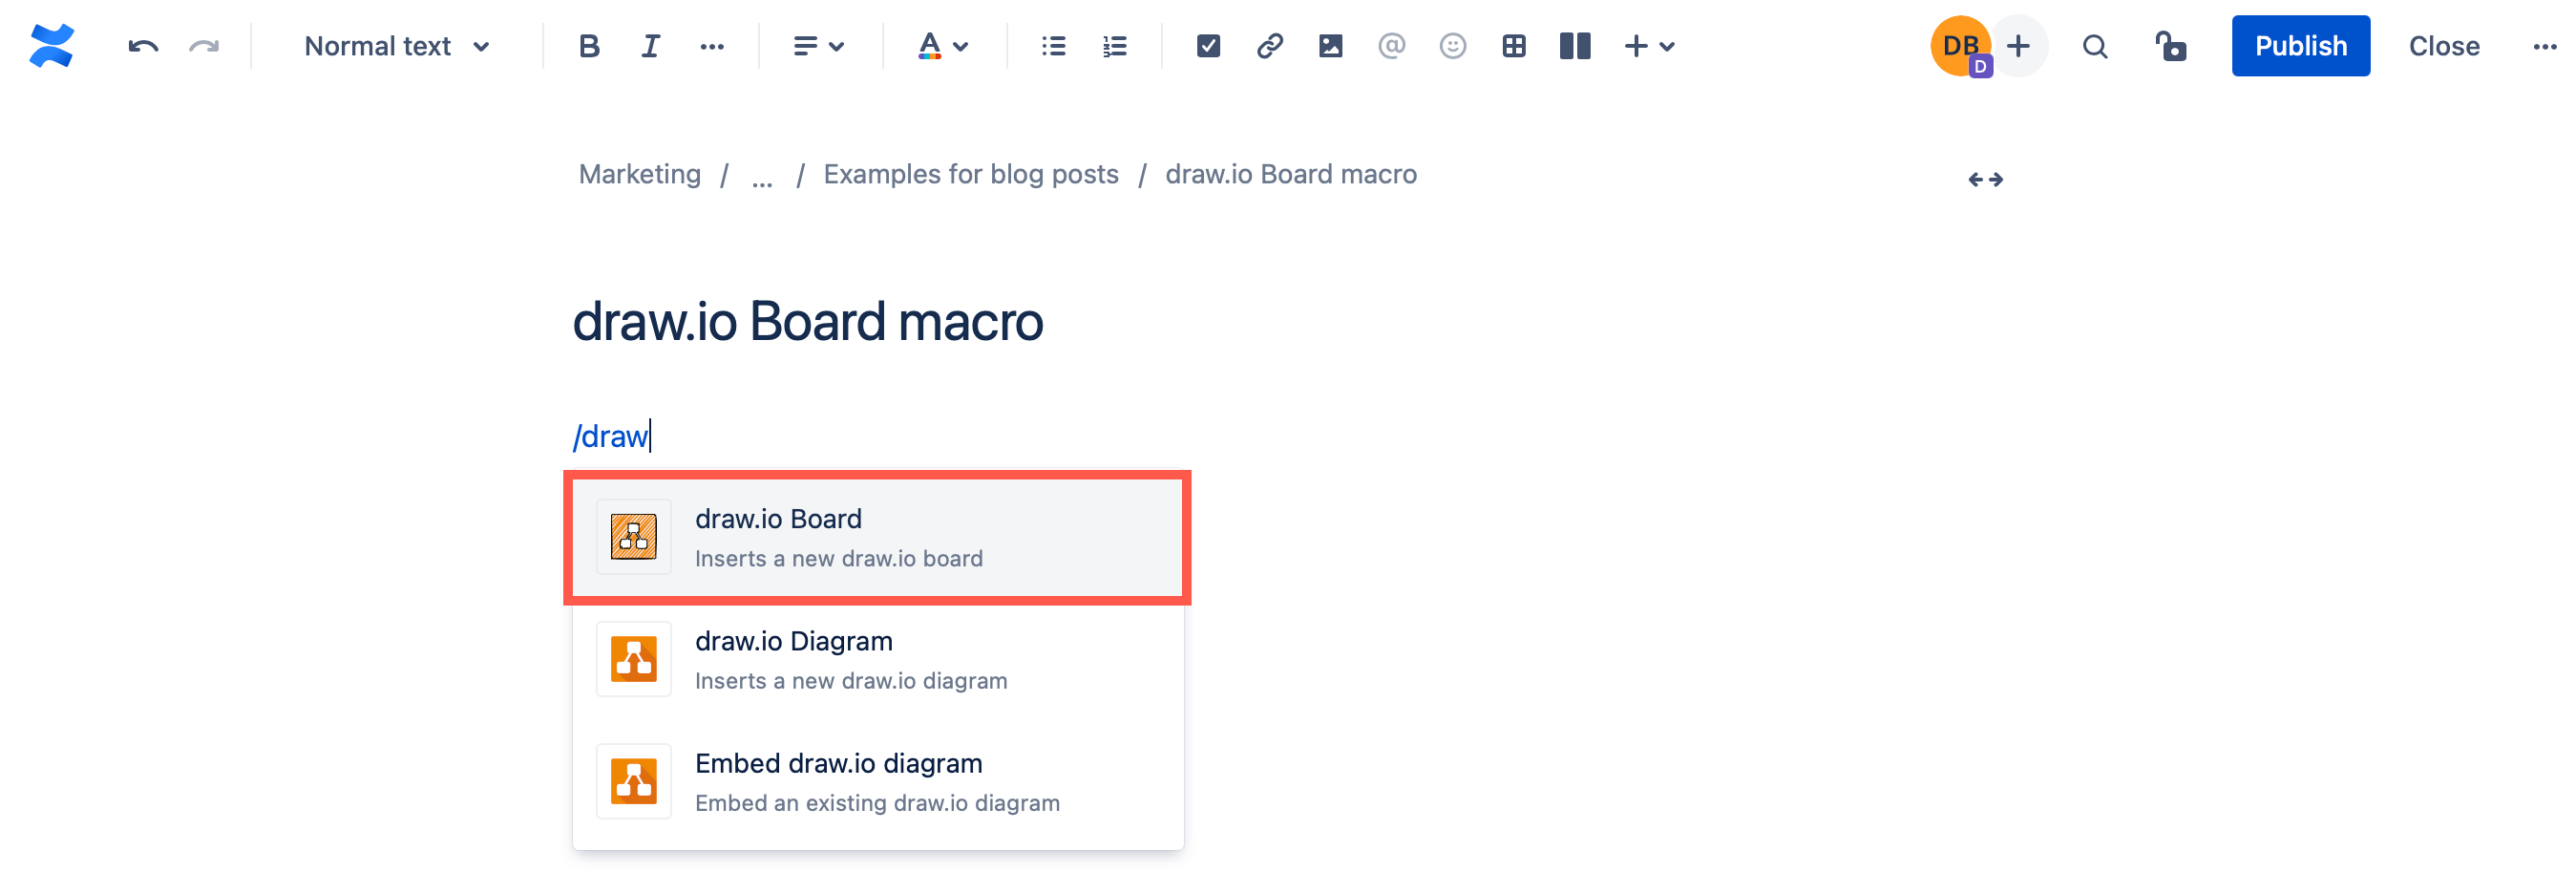
The draw.io app is now free in small Confluence Cloud instances (up to 10 users). If you are taking advantage of Atlassian's offer of a free Confluence Cloud instance for your small team, you can now add the draw.io board macro and embed diagrams in Confluence pages without needing to purchase a license.

We've improved the draw.io app's performance within Atlassian host products, updated the authentication to use the new API, and refreshed the Kennedy editor theme. The Gliffy and Lucidchart conversion features received a number of updates and bugfixes throughout the year.

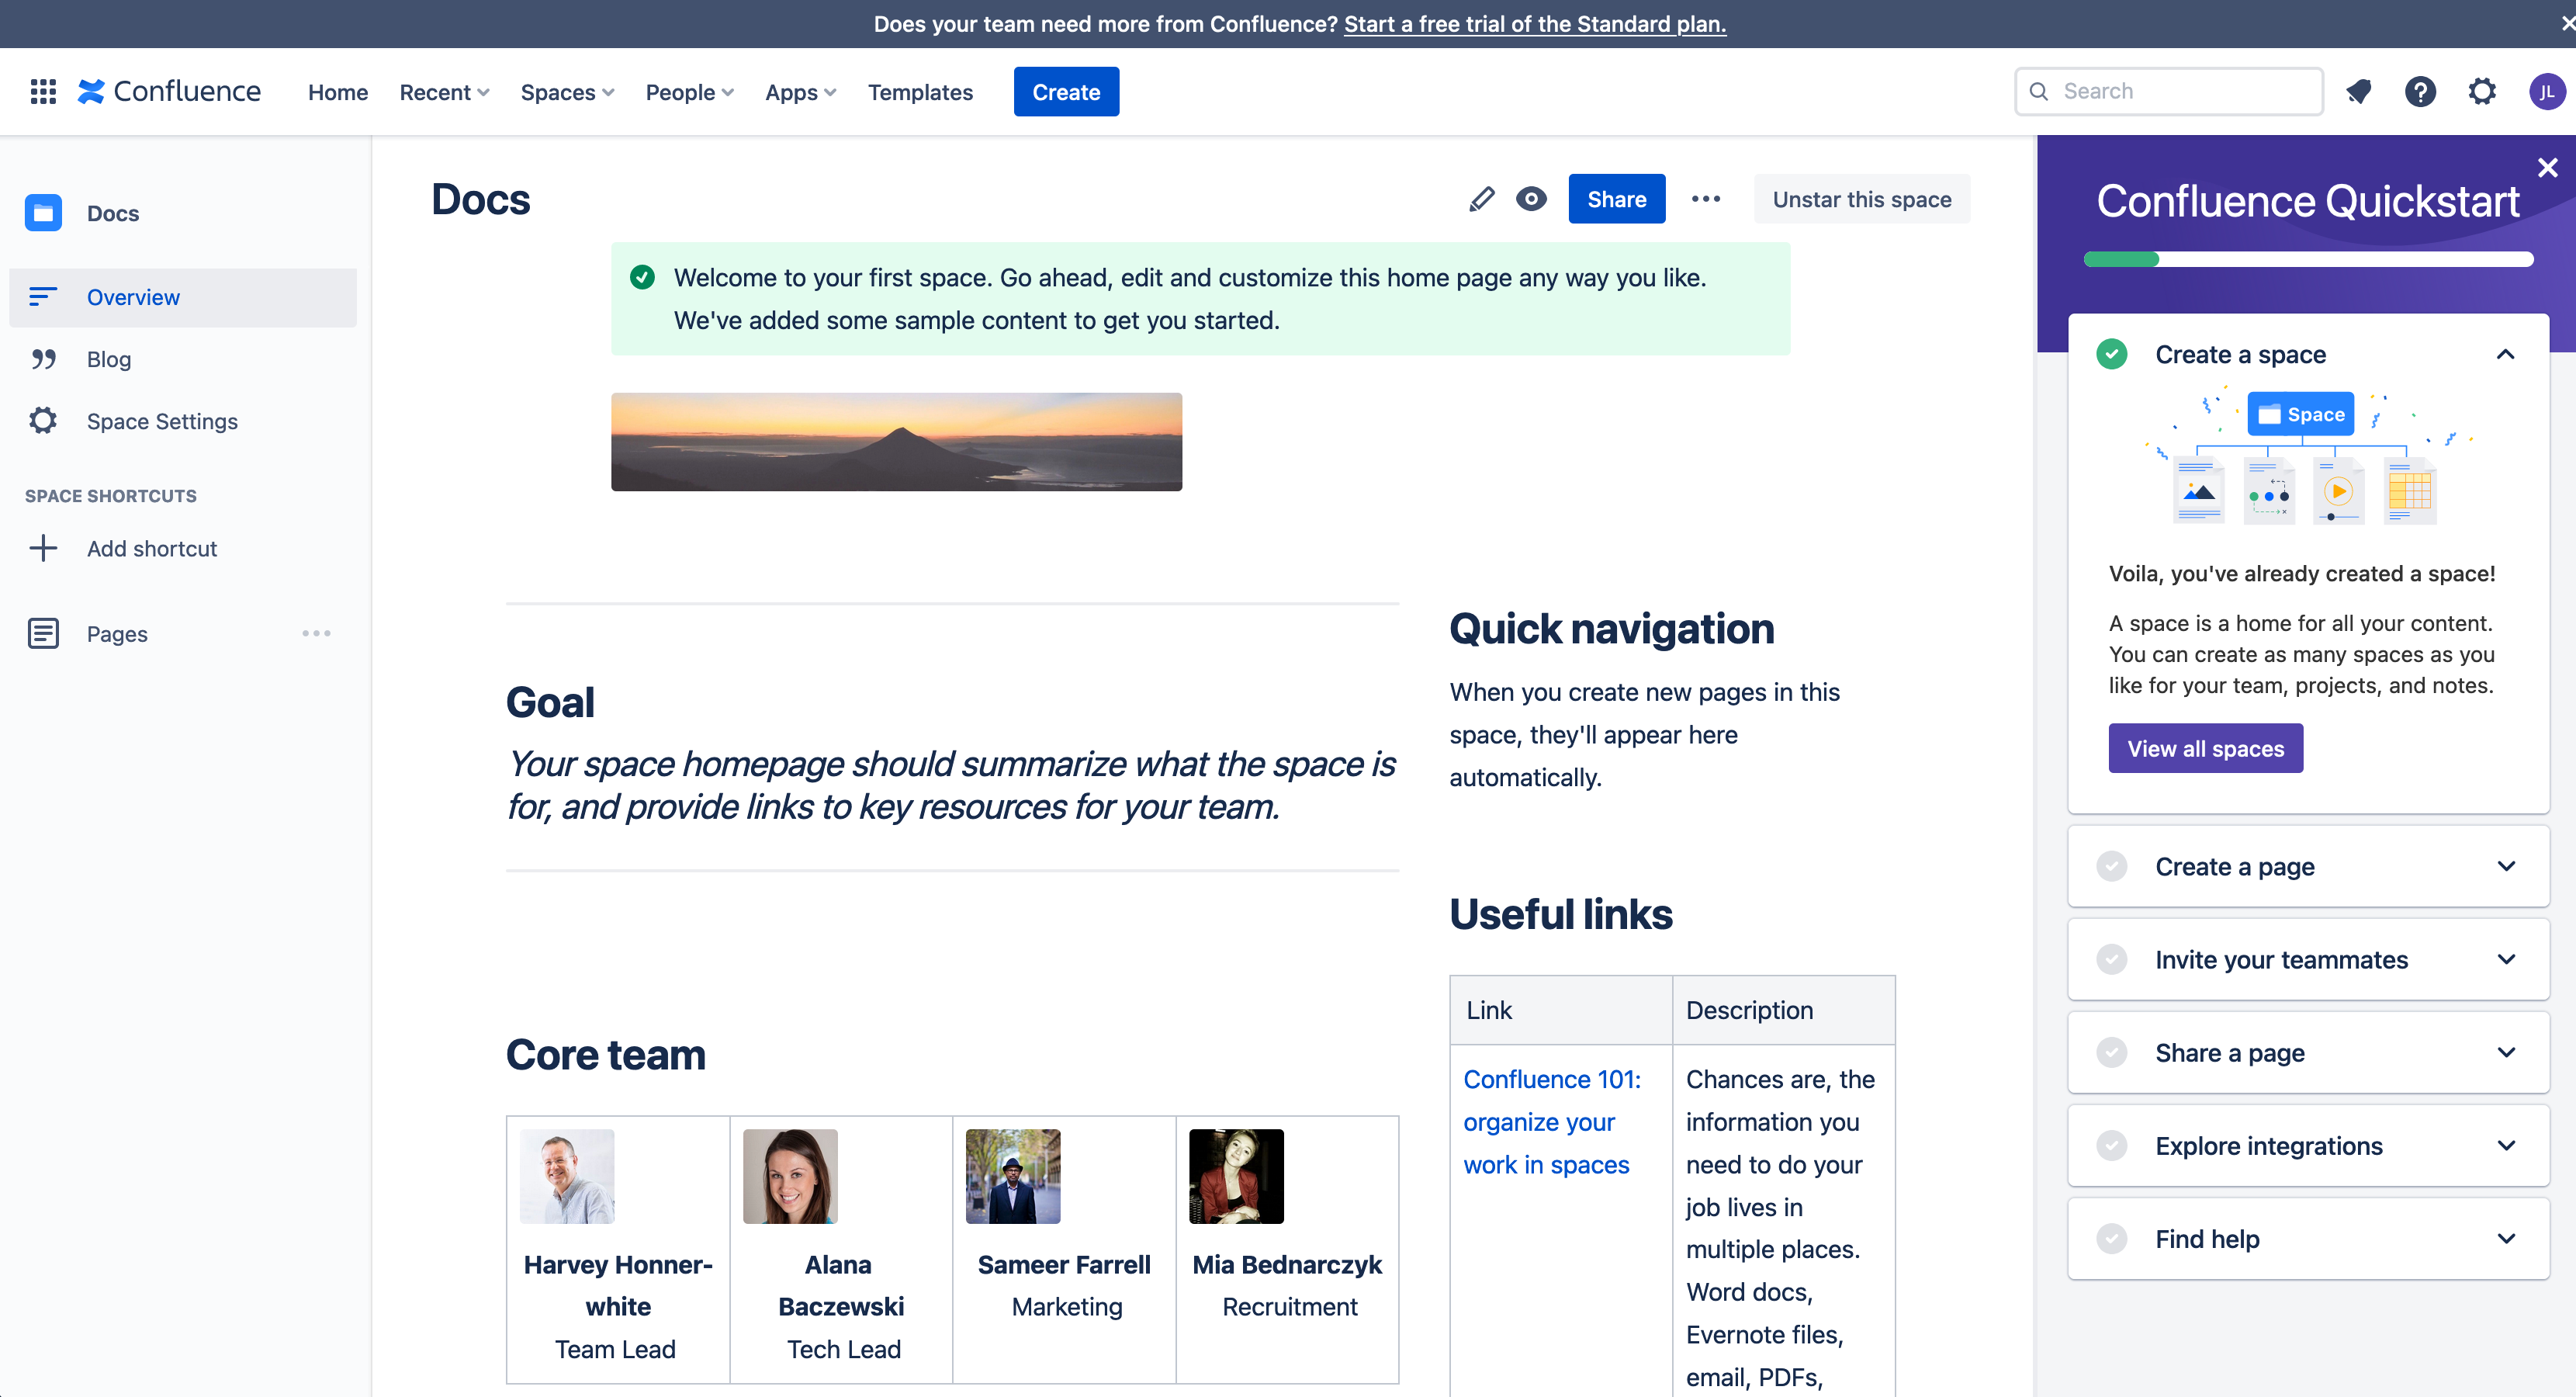
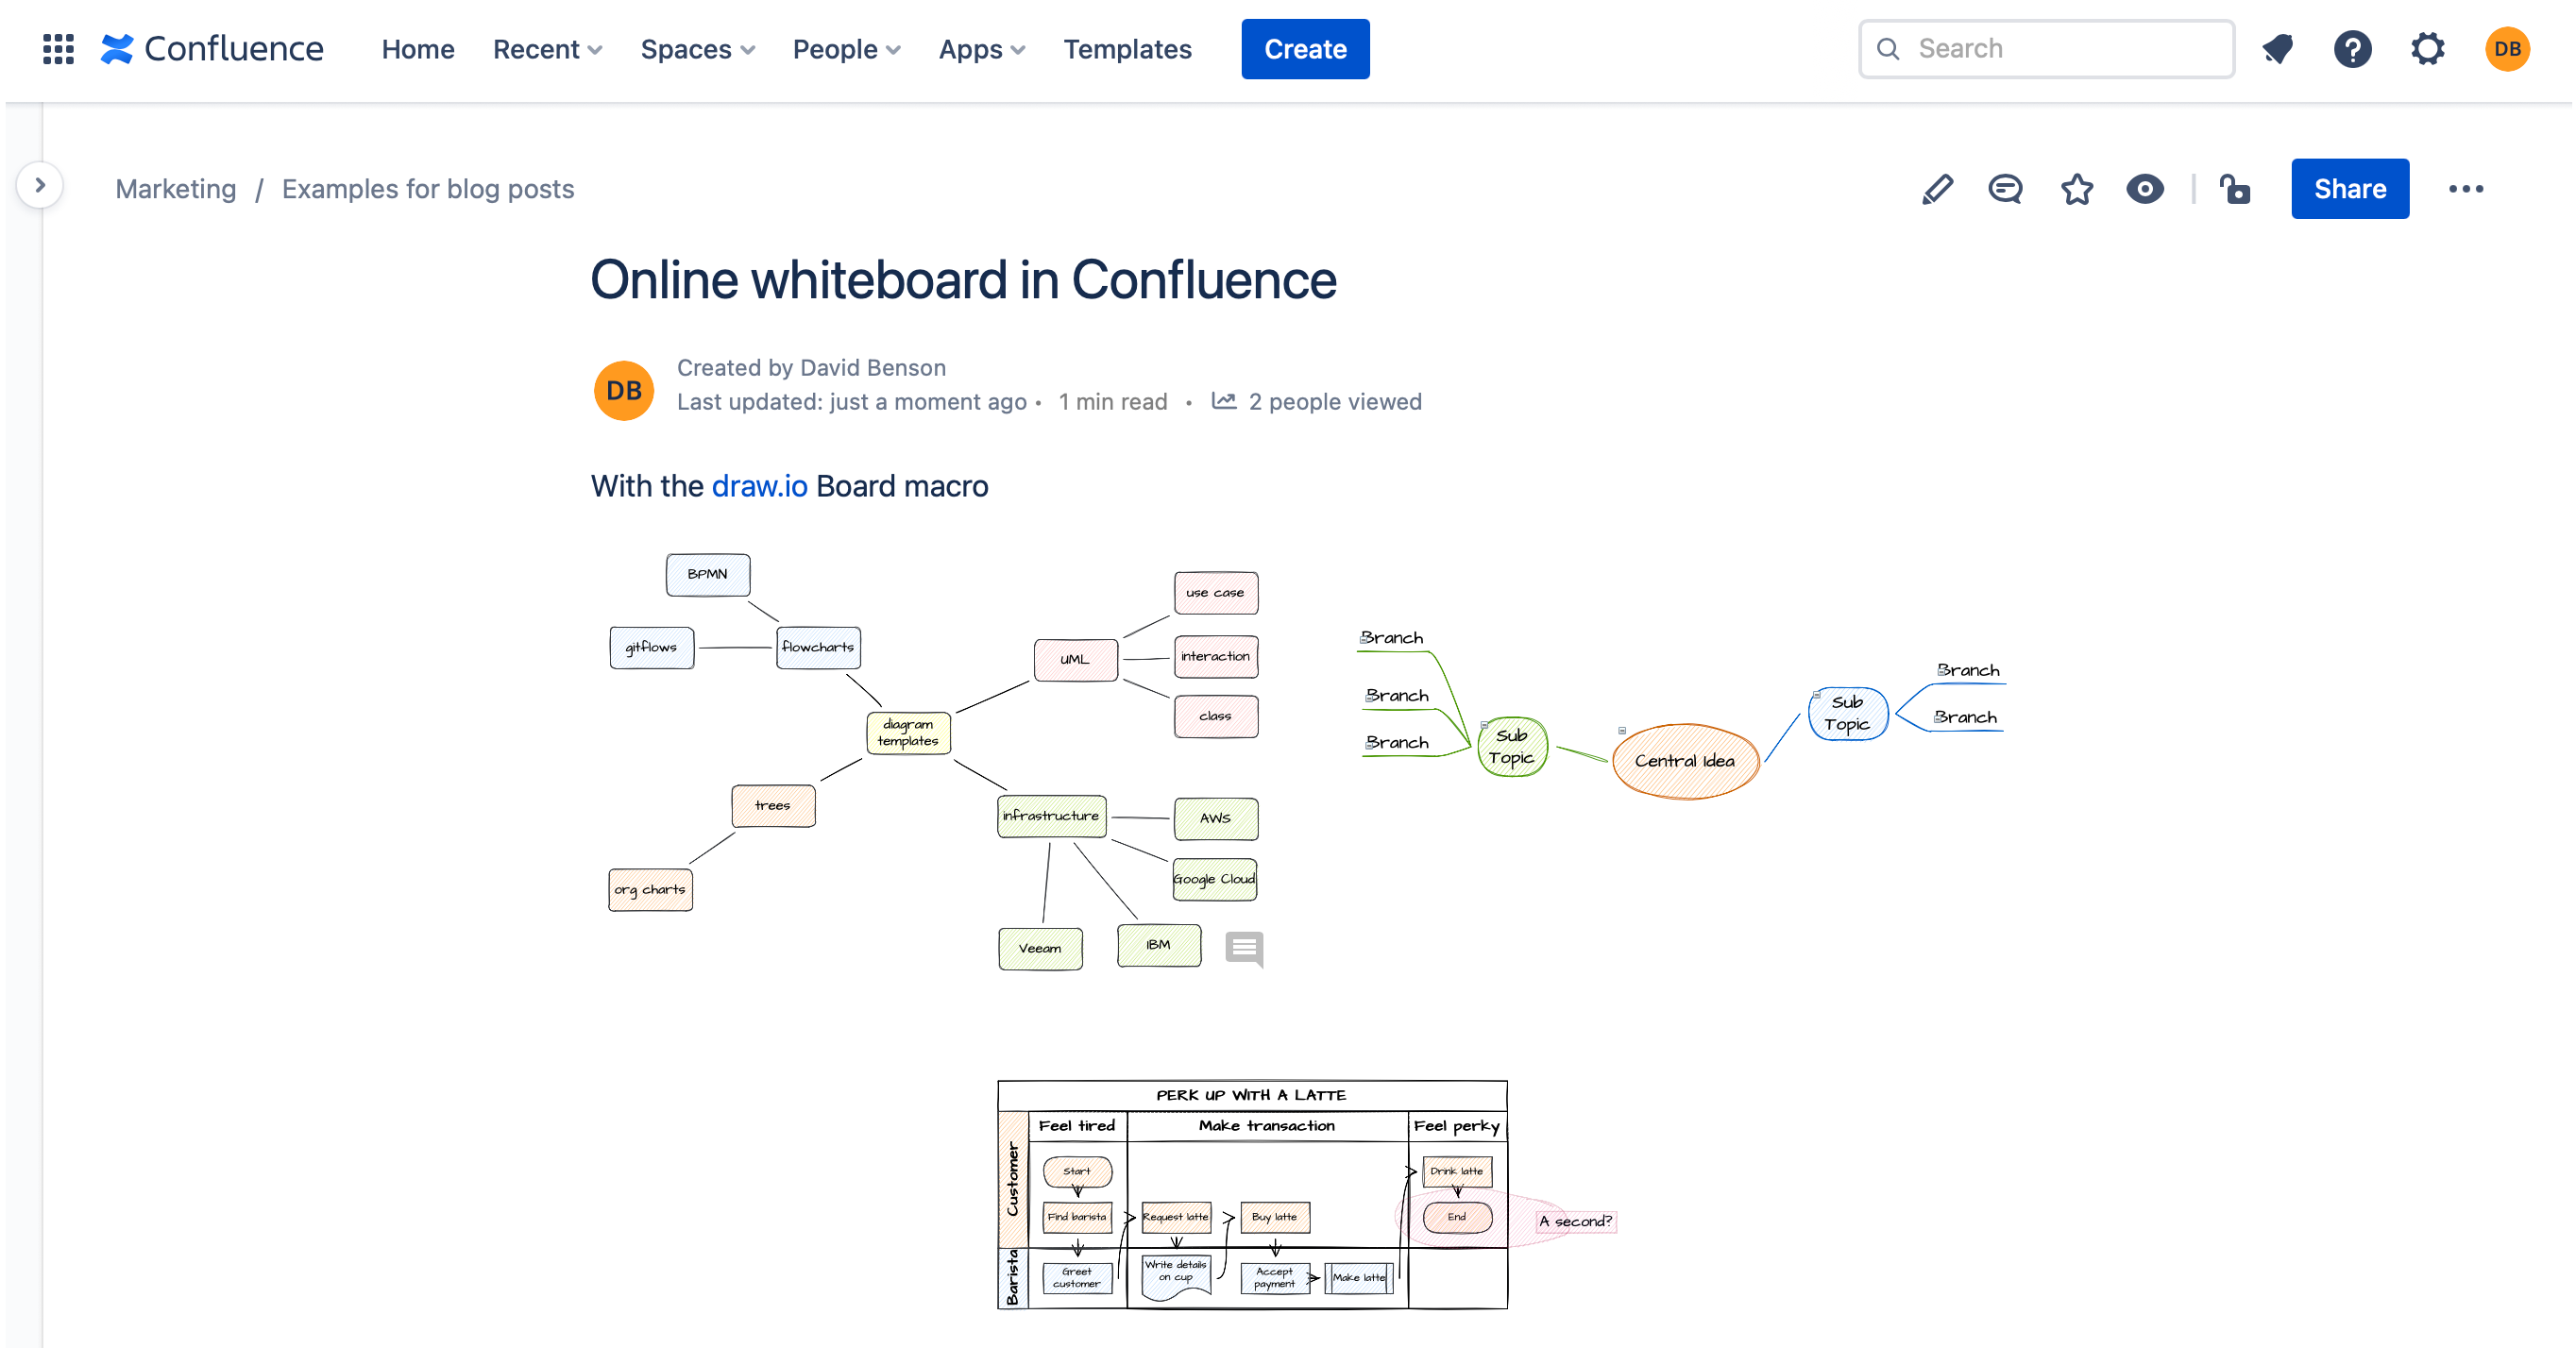
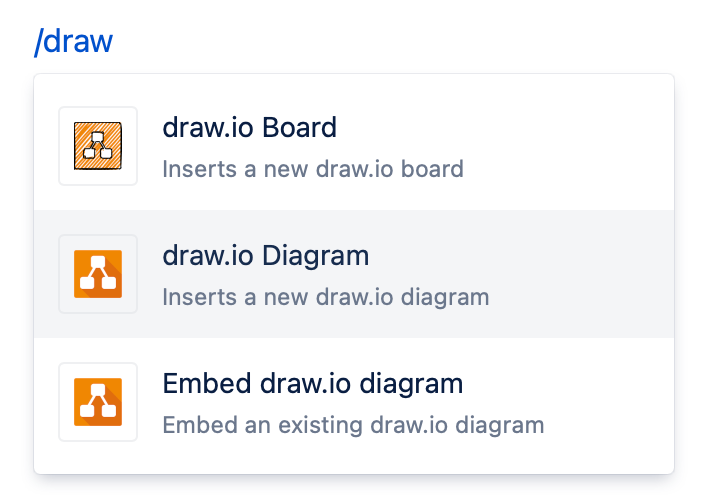
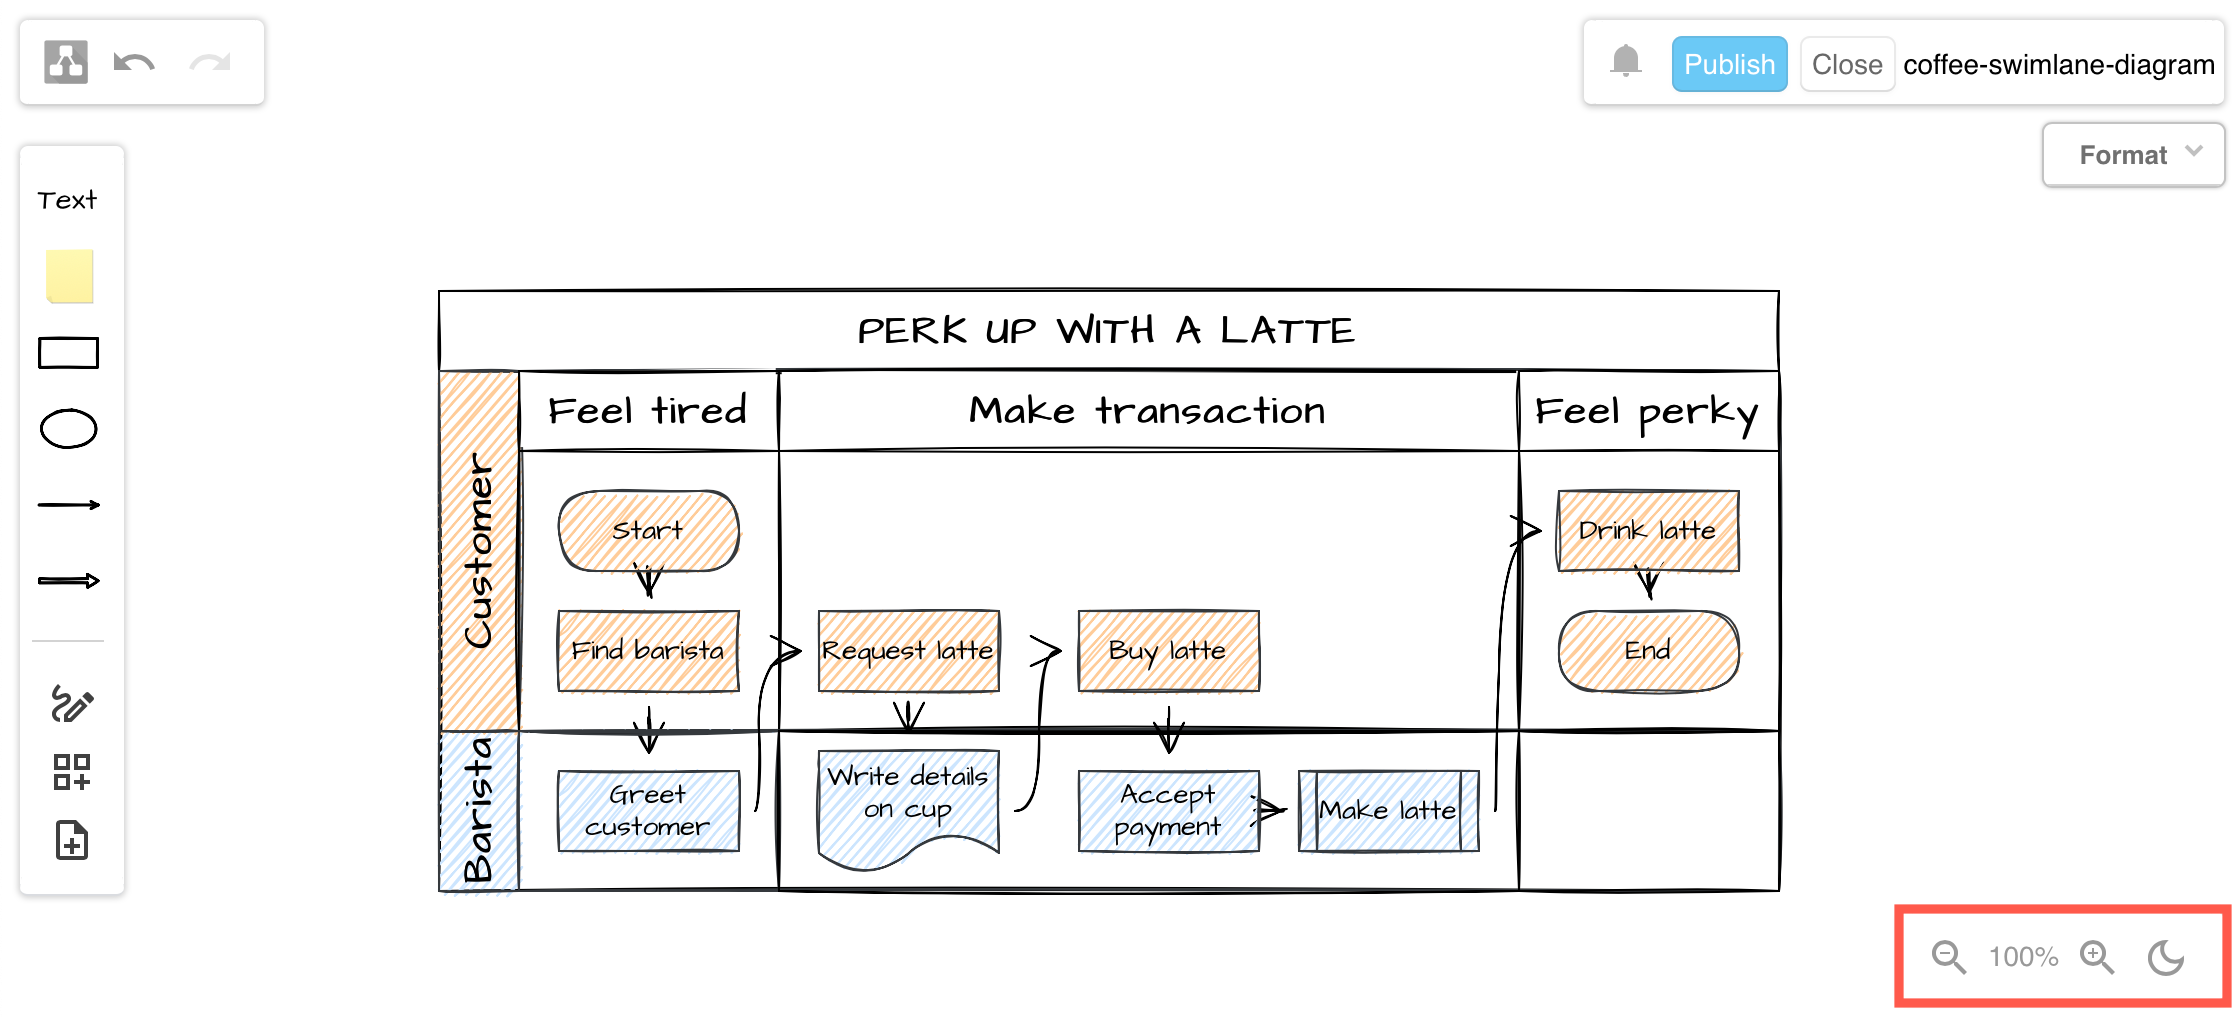
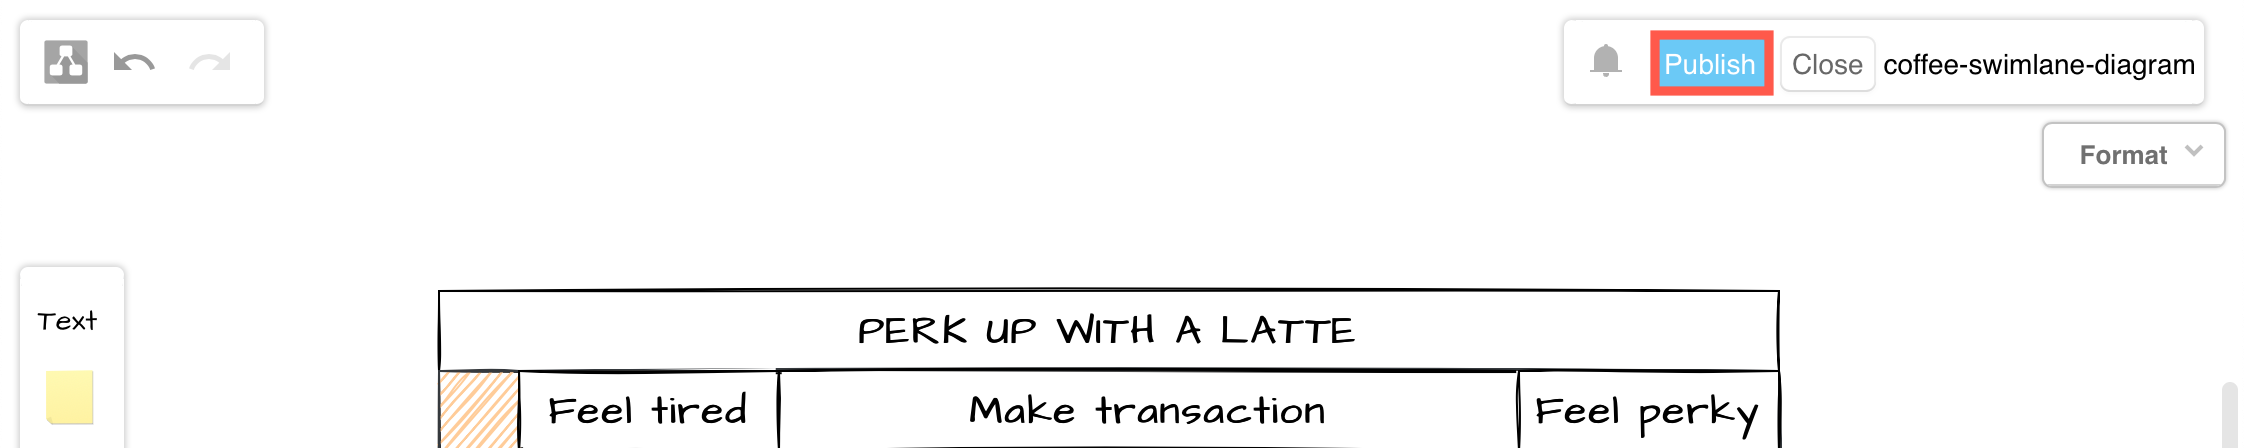
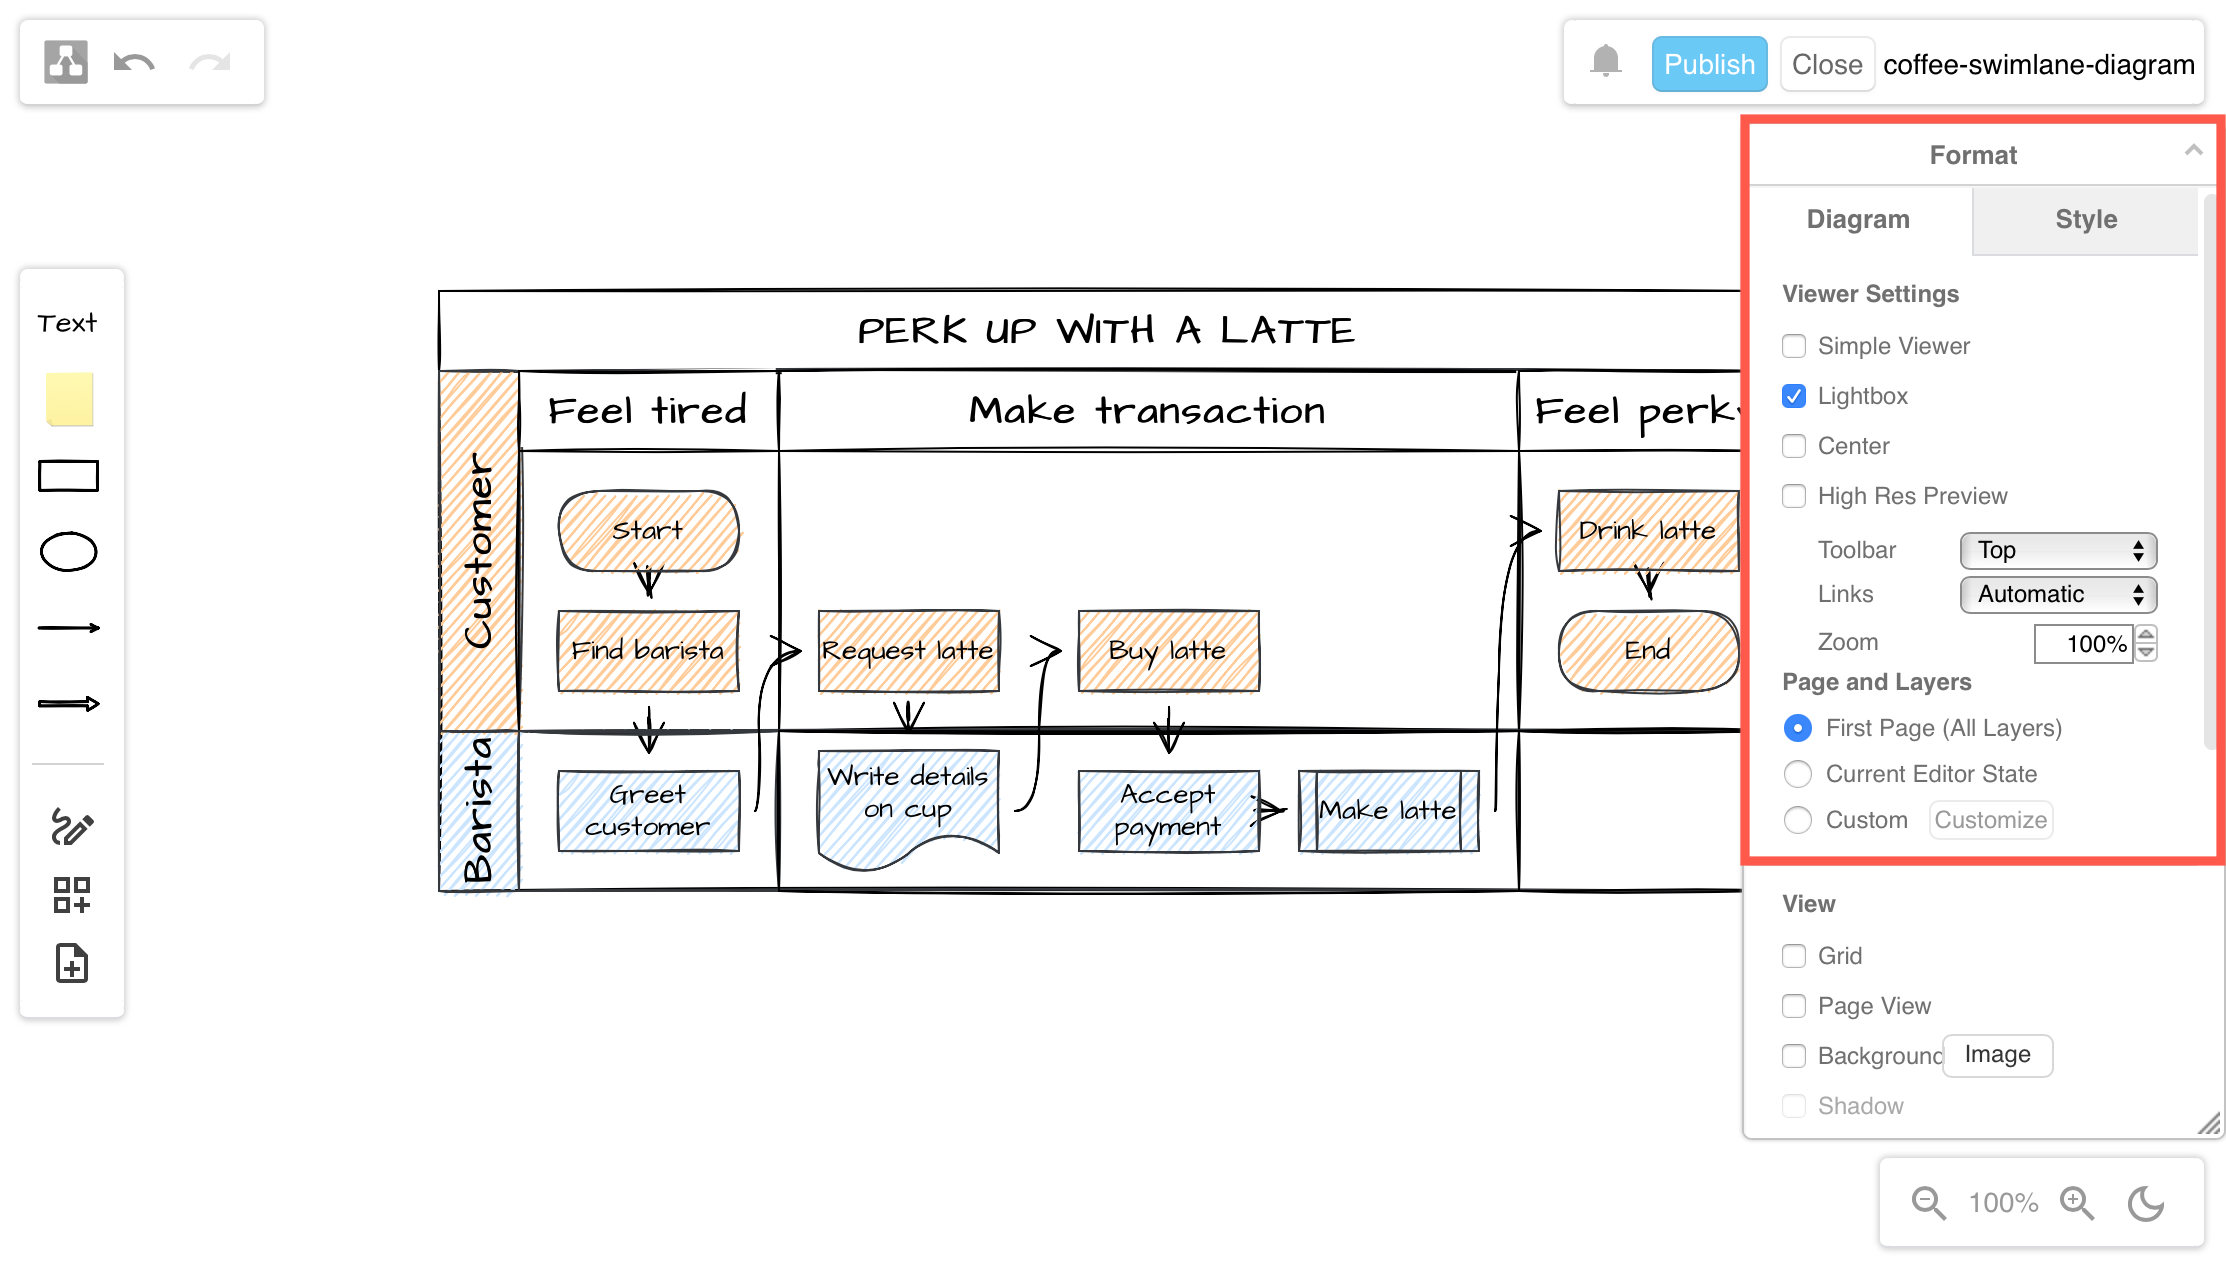
The new draw.io board macro in Atlassian Confluence uses the updated Sketch editor theme by default, providing teams with an easy-to-use digital whiteboard.
Double click on the drawing canvas to add a shape, or click on a direction arrow, or drag a new connection to a shape in another position in the draw.io editor

draw.io for Google Workspace, Drive and Classroom

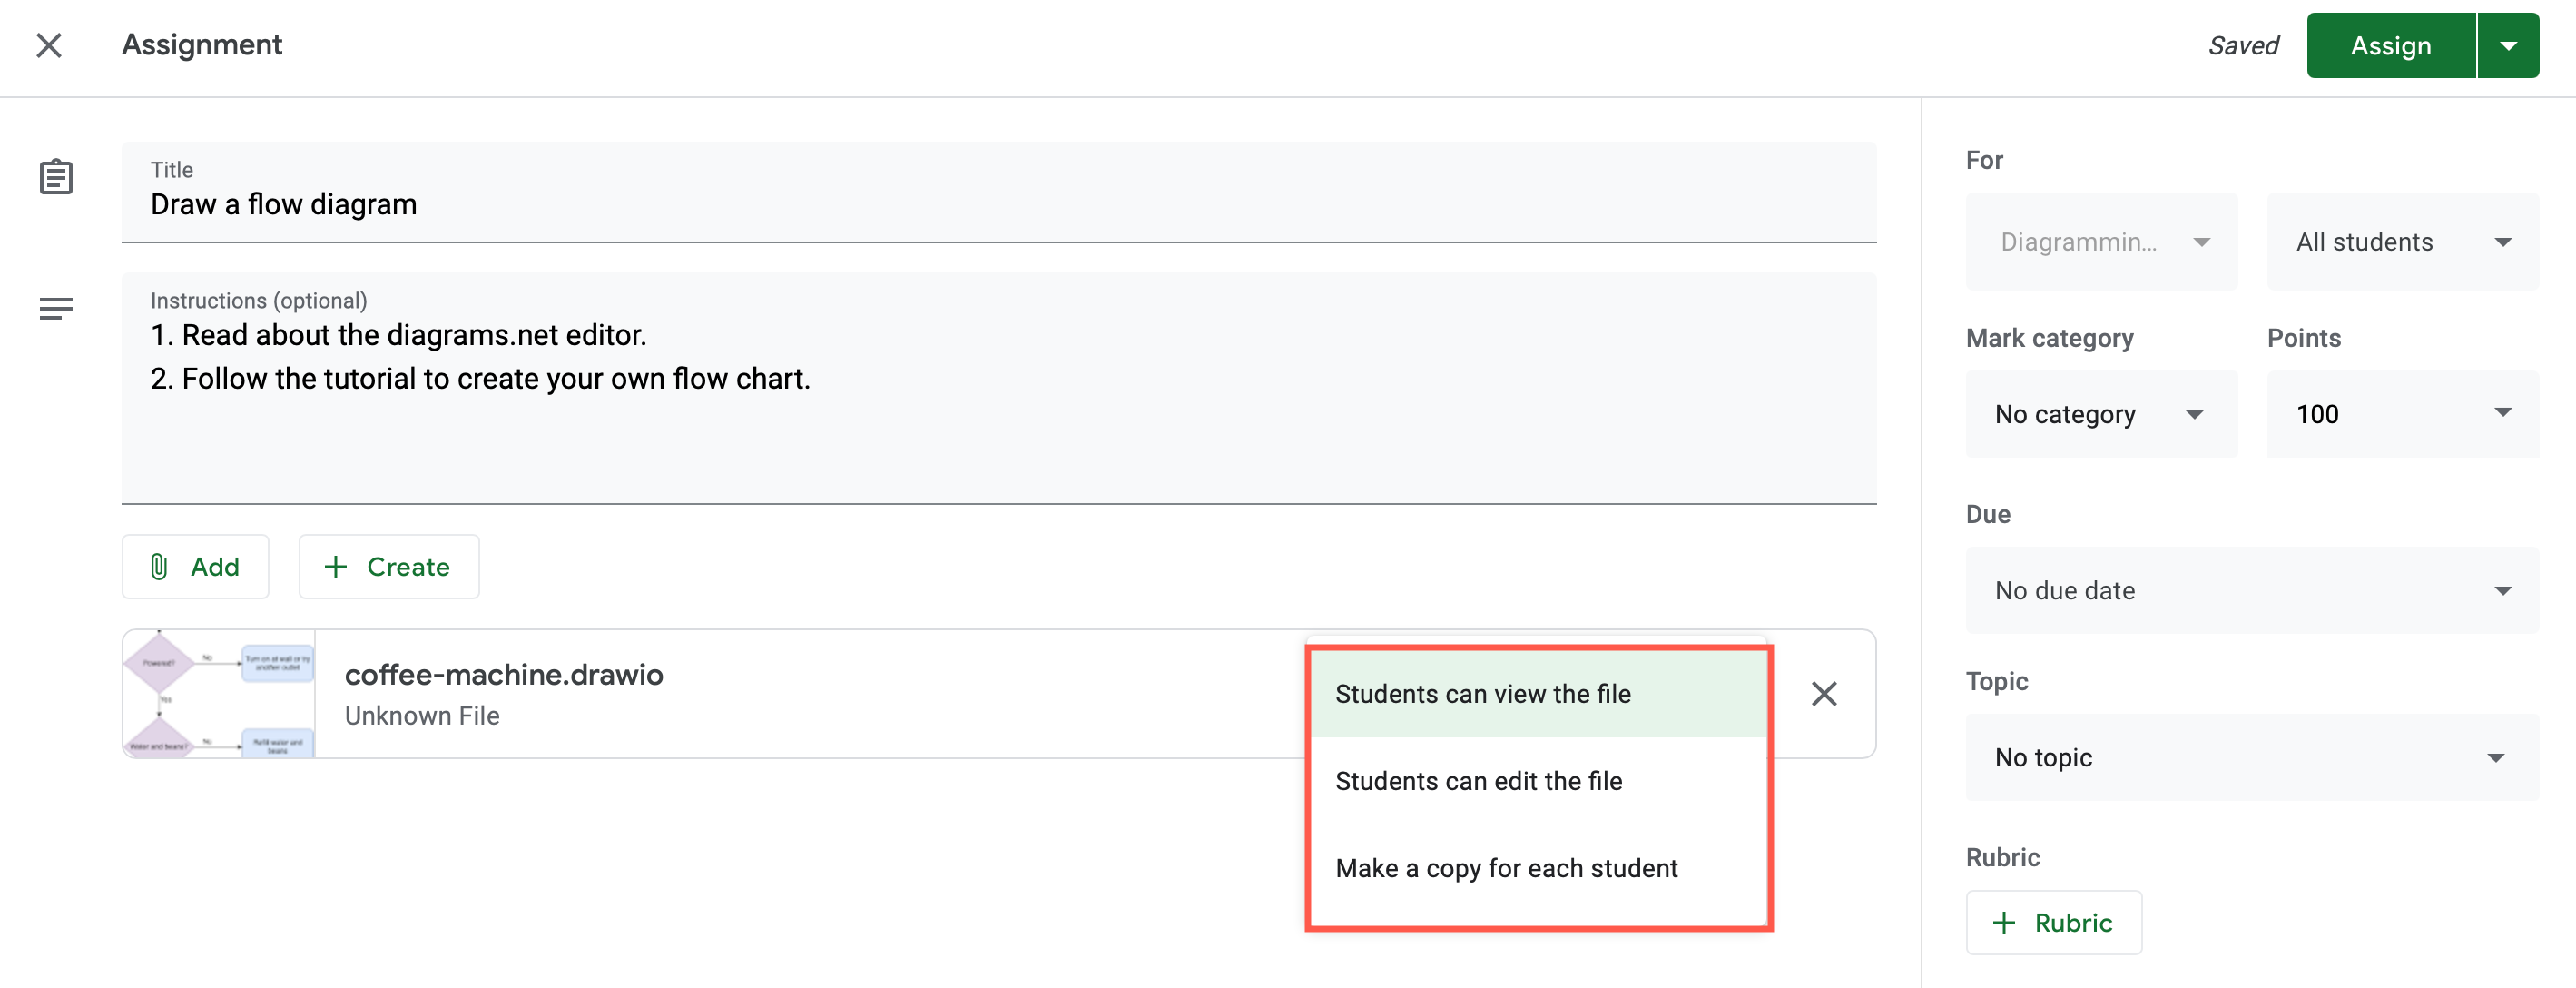
Google Classroom continued to be used extensively by schools and training providers. The draw.io app for Google Drive lets you integrate diagrams into Google Classroom assessment tasks and discussions. Diagrams set in assessment tasks can be collaboratively edited, or act like a template with each student getting their own copy.
Select whether students can view or edit the diagram file, or if they automatically get their own copy in their Google Drives on diagrams attached to assignments in Google Classroom
Tip: Install the Google Workspace apps for Docs, Sheets and Slides to embed diagrams in your Workspace documents.

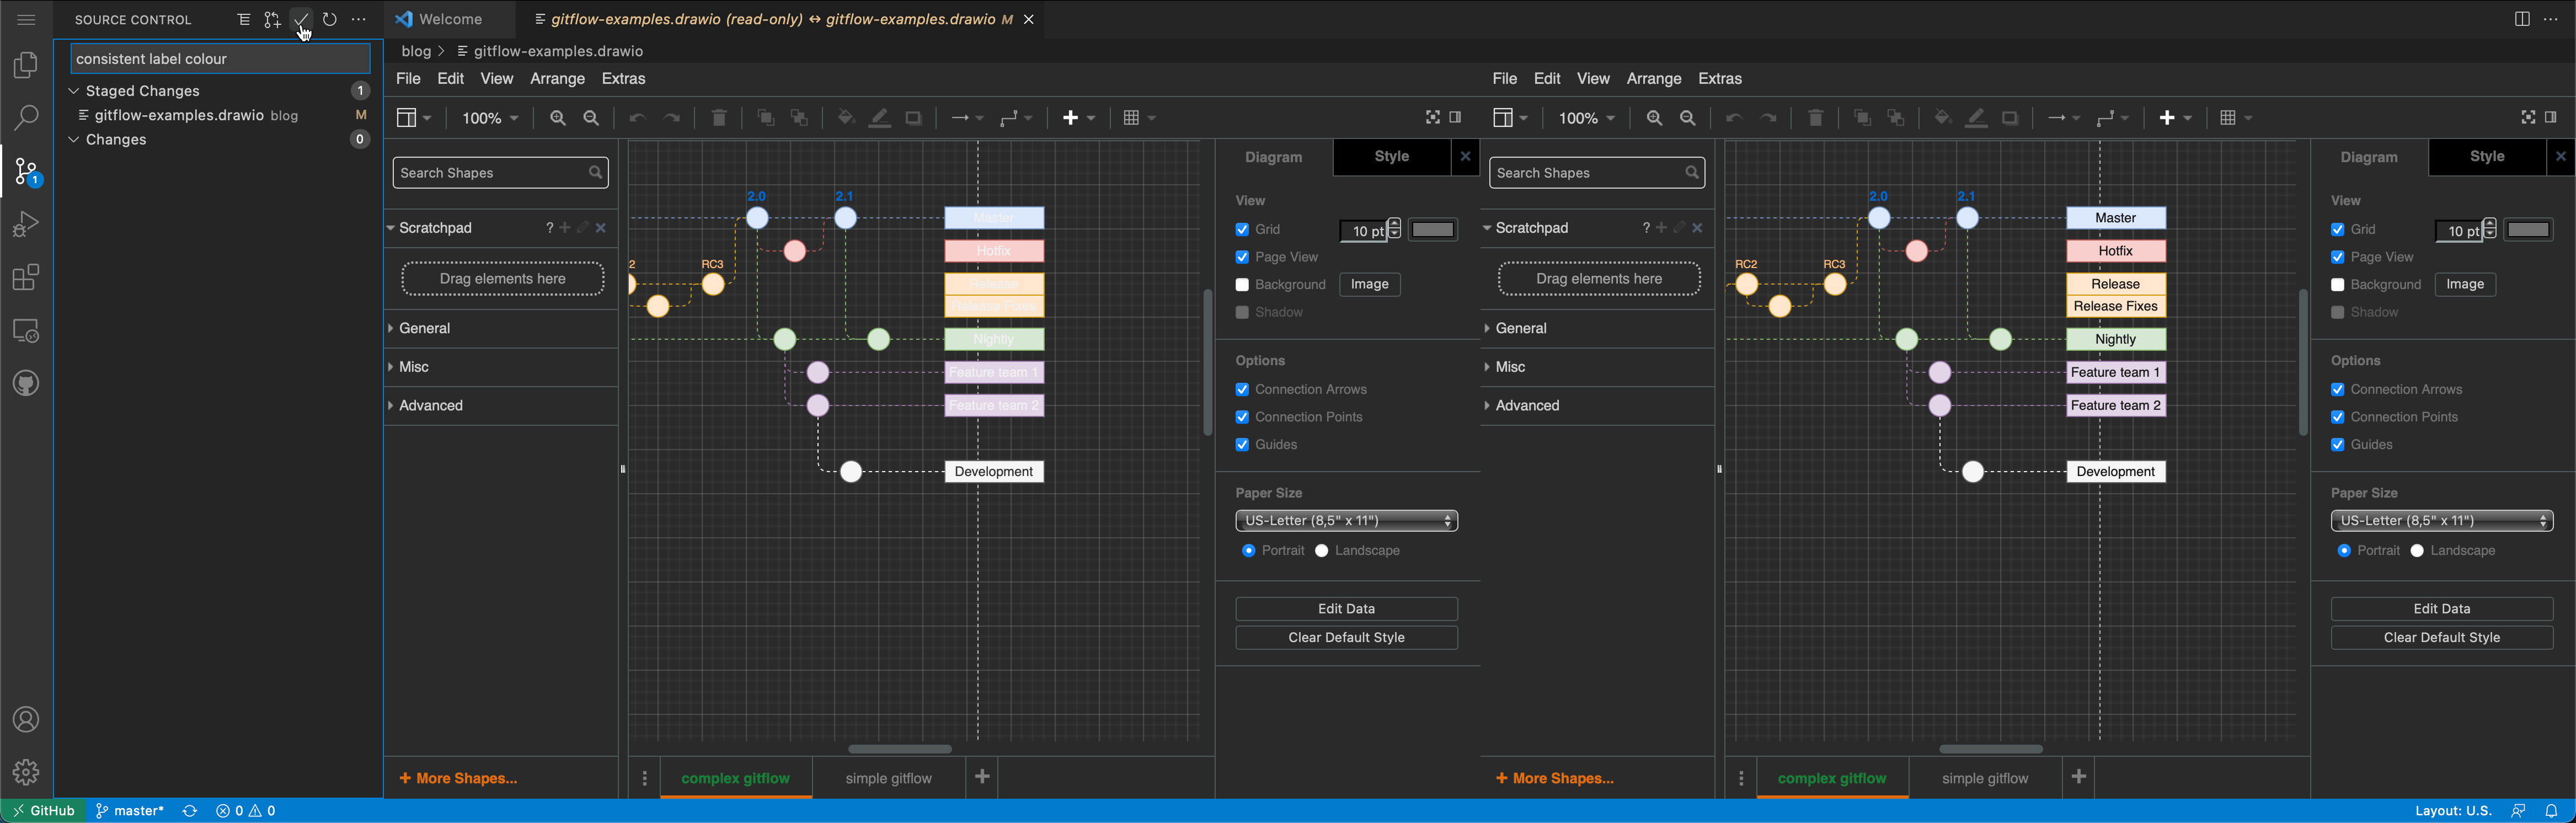
draw.io for VSCode and GitHub

In combination with the third-party draw.io app for VSCode, and the github.dev web-based code editor, you can now edit diagrams stored in GitHub, without needing to change to another tab. You can even compare changes side-by-side on commit.
Compare and commit the changes you made to the diagram files in your repository via github.dev

draw.io diagrams in Notion

You can use the draw.io for Notion extension for the Chrome, Opera and Edge web browsers to store your diagram files in your Notion pages. The diagram editor loads inline in your Notion page using the simple Sketch editor theme.
Import an existing diagram into Notion via the menu, or drag and drop the file into the drawing canvas

draw.io for Microsoft Teams

You can now collaborate in real time on diagrams stored in Microsoft One Drive or Sharepoint, directly from your team’s channel with the draw.io app for Microsoft Teams. Install the draw.io app in your Teams channel to add diagrams to conversations or to a Teams tab.
draw.io in Teams: A diagram added to chat will display the first diagram page as a thumbnail

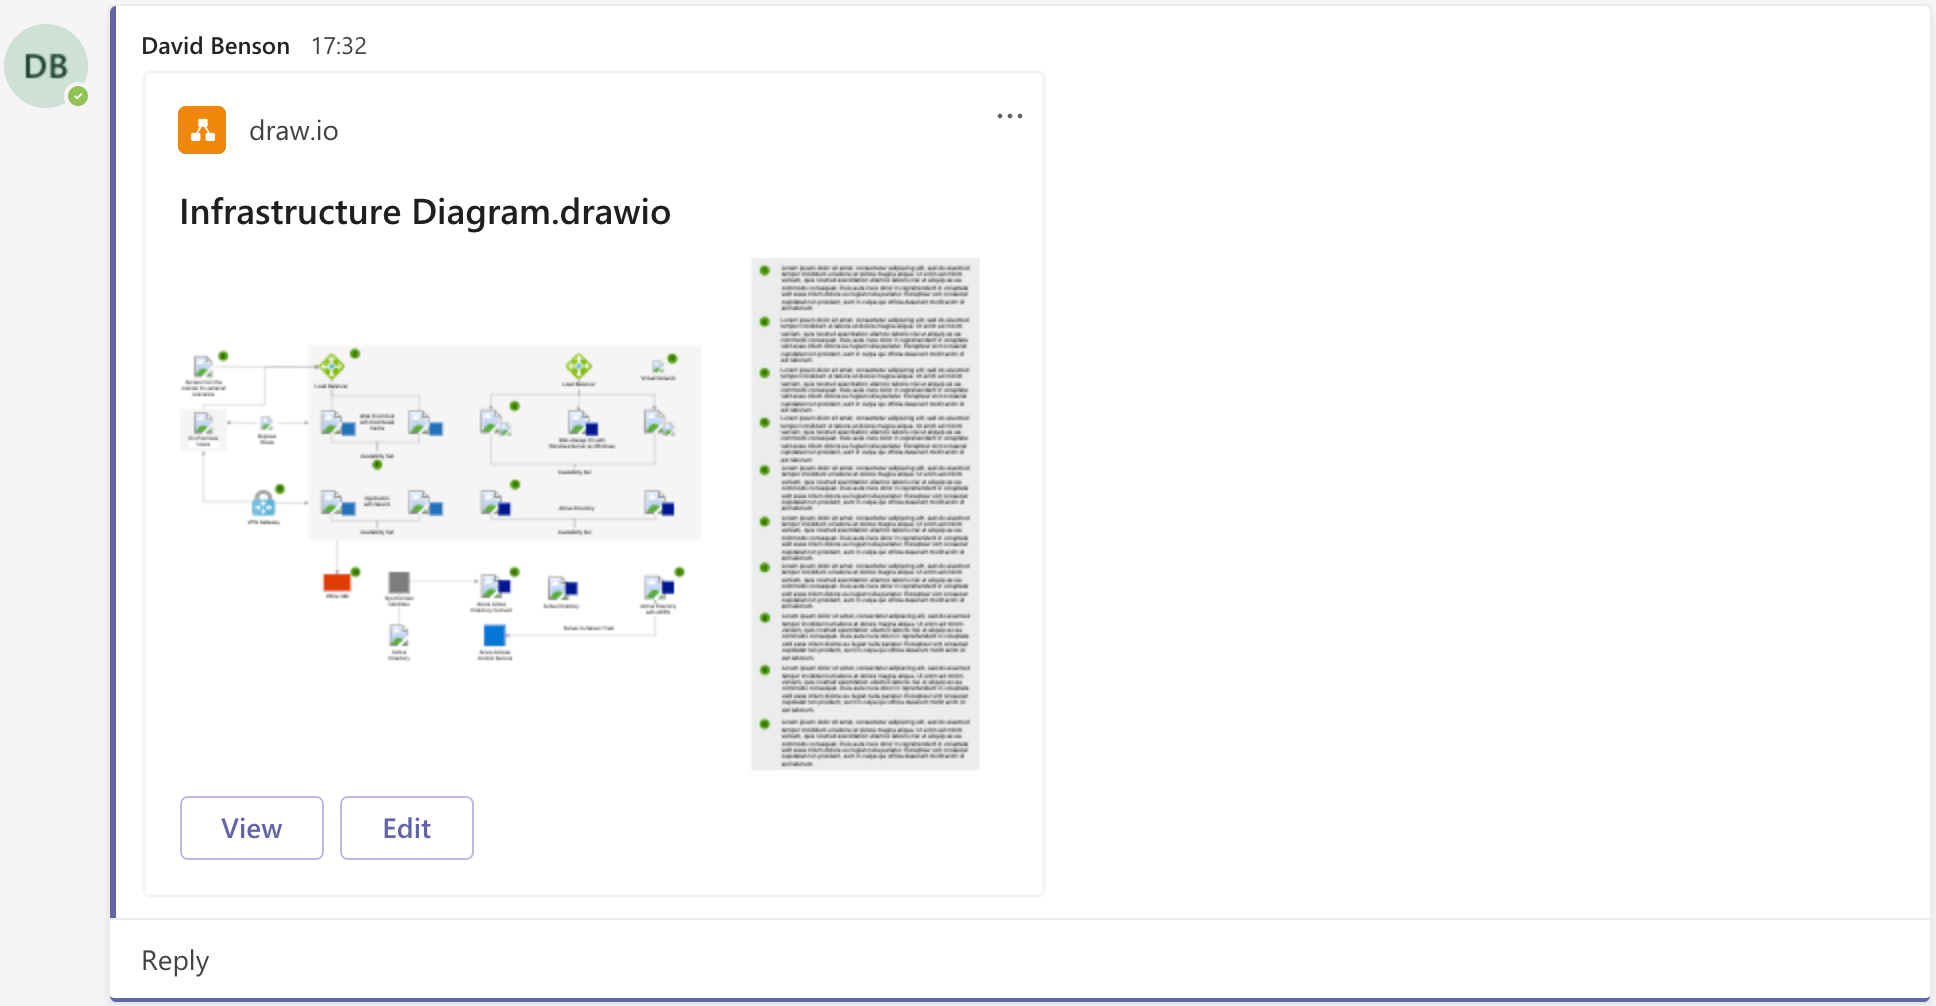
Diagram import and file conversion

The free draw.io Importer extension for the Google Chrome browser lets you convert all of your Lucidchart diagrams to draw.io in a couple of steps. This lets you continue editing all of your diagrams now that Lucidchart has limited Lucidchart EDU, their previously free education plan, to only three editable diagrams.

New features and updates in 2021

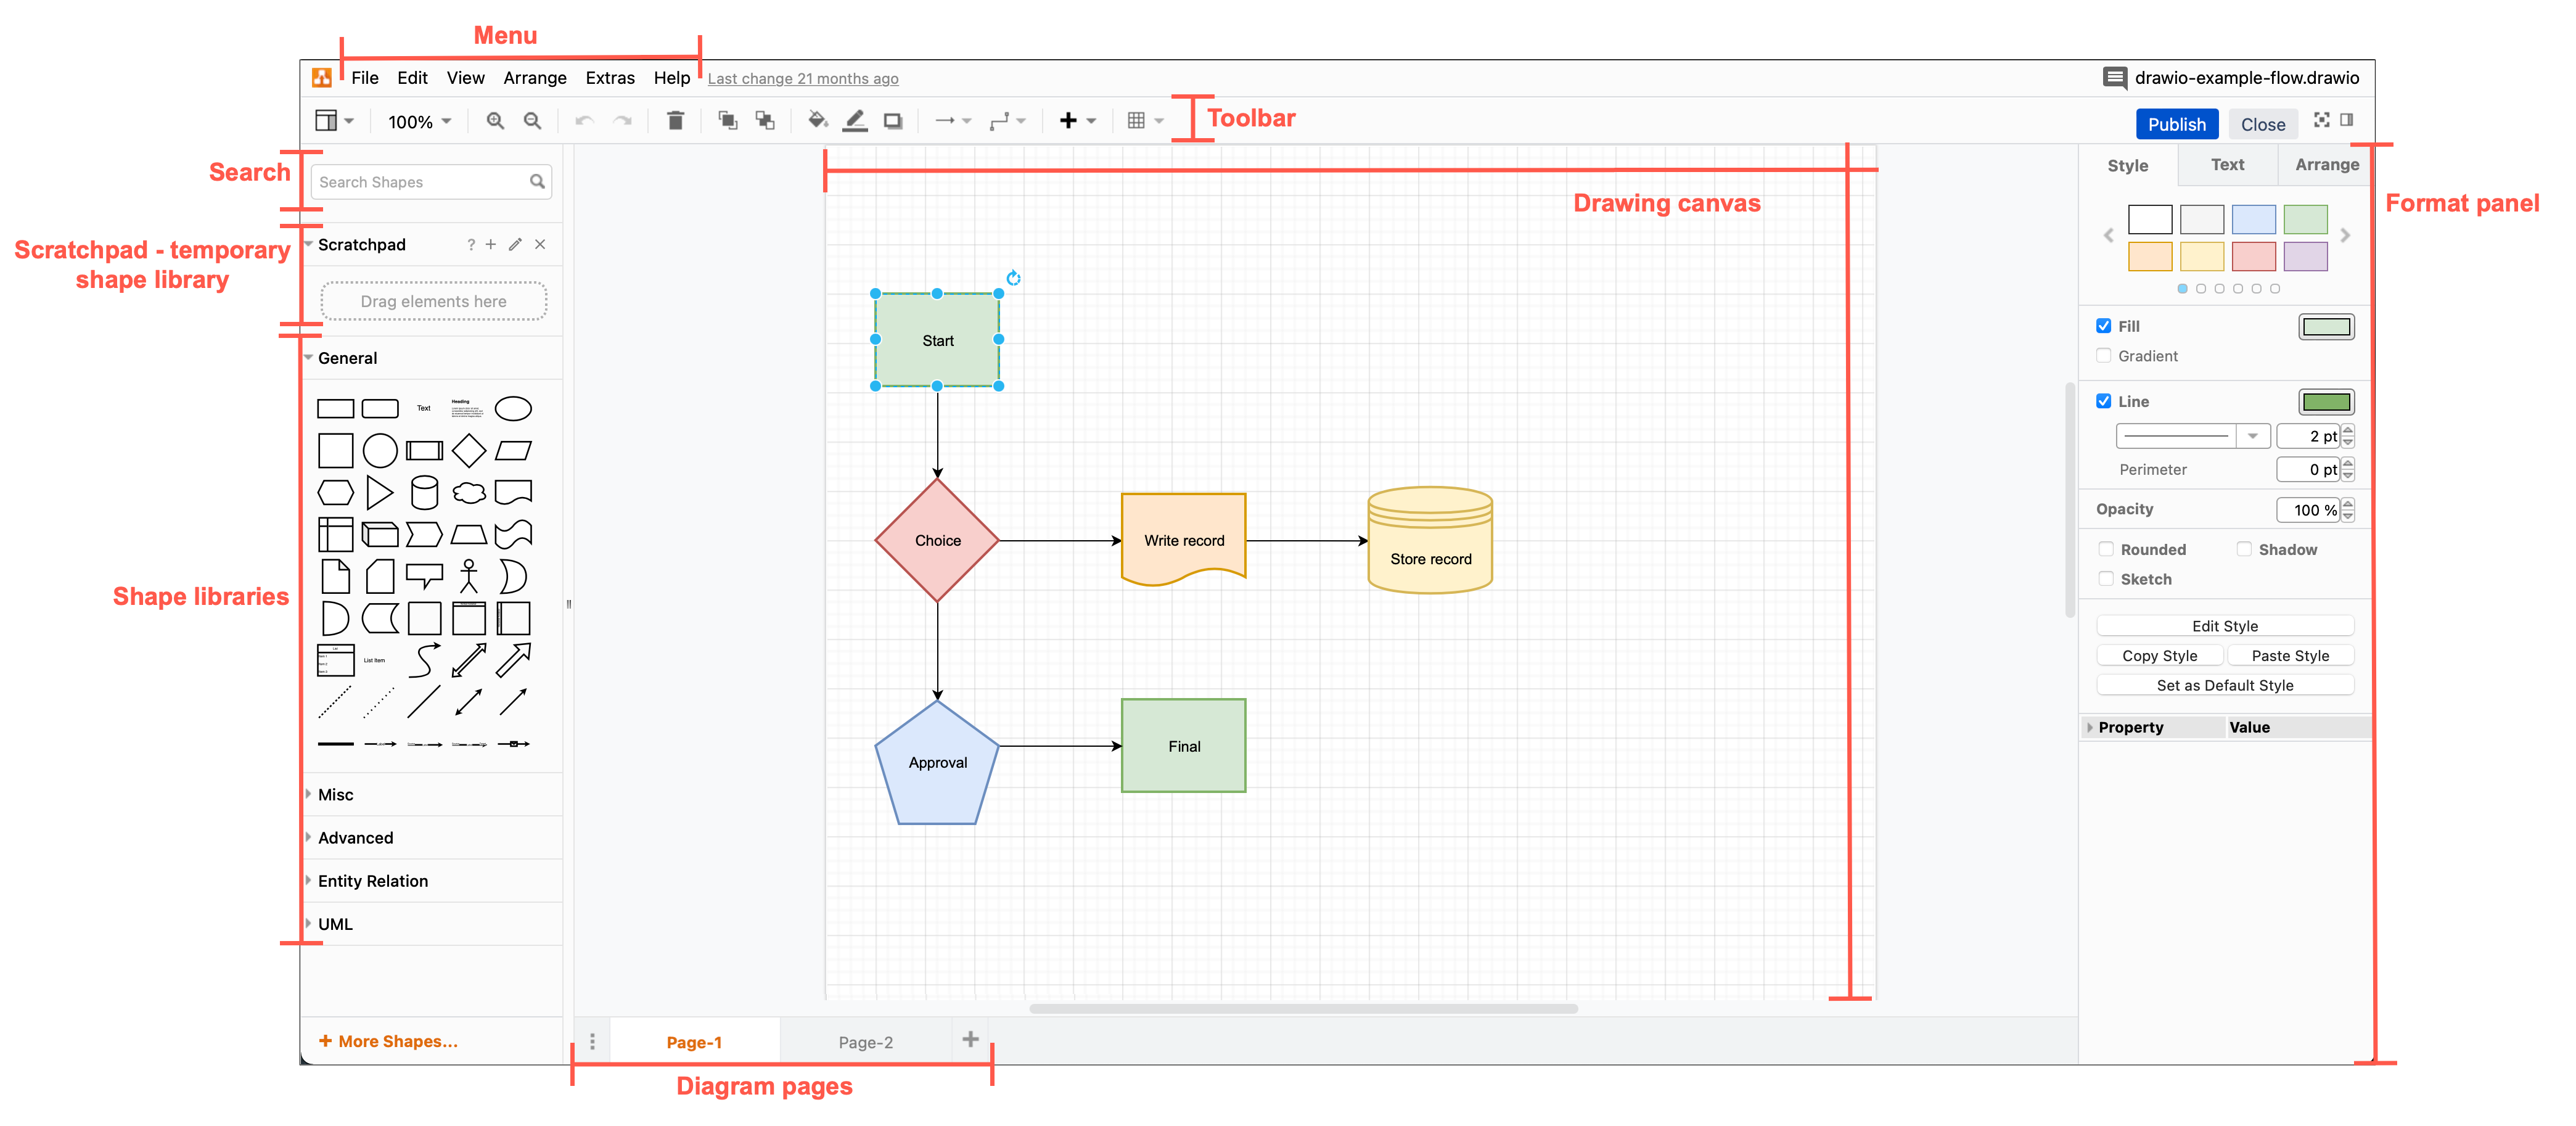
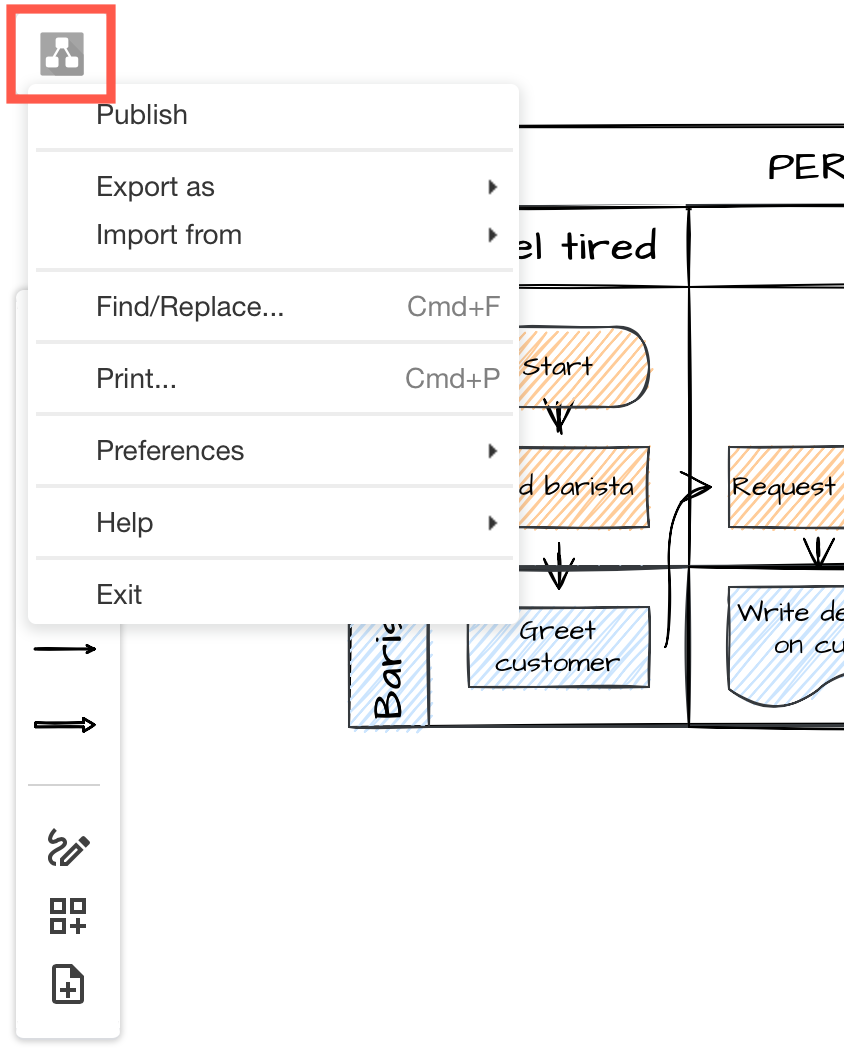
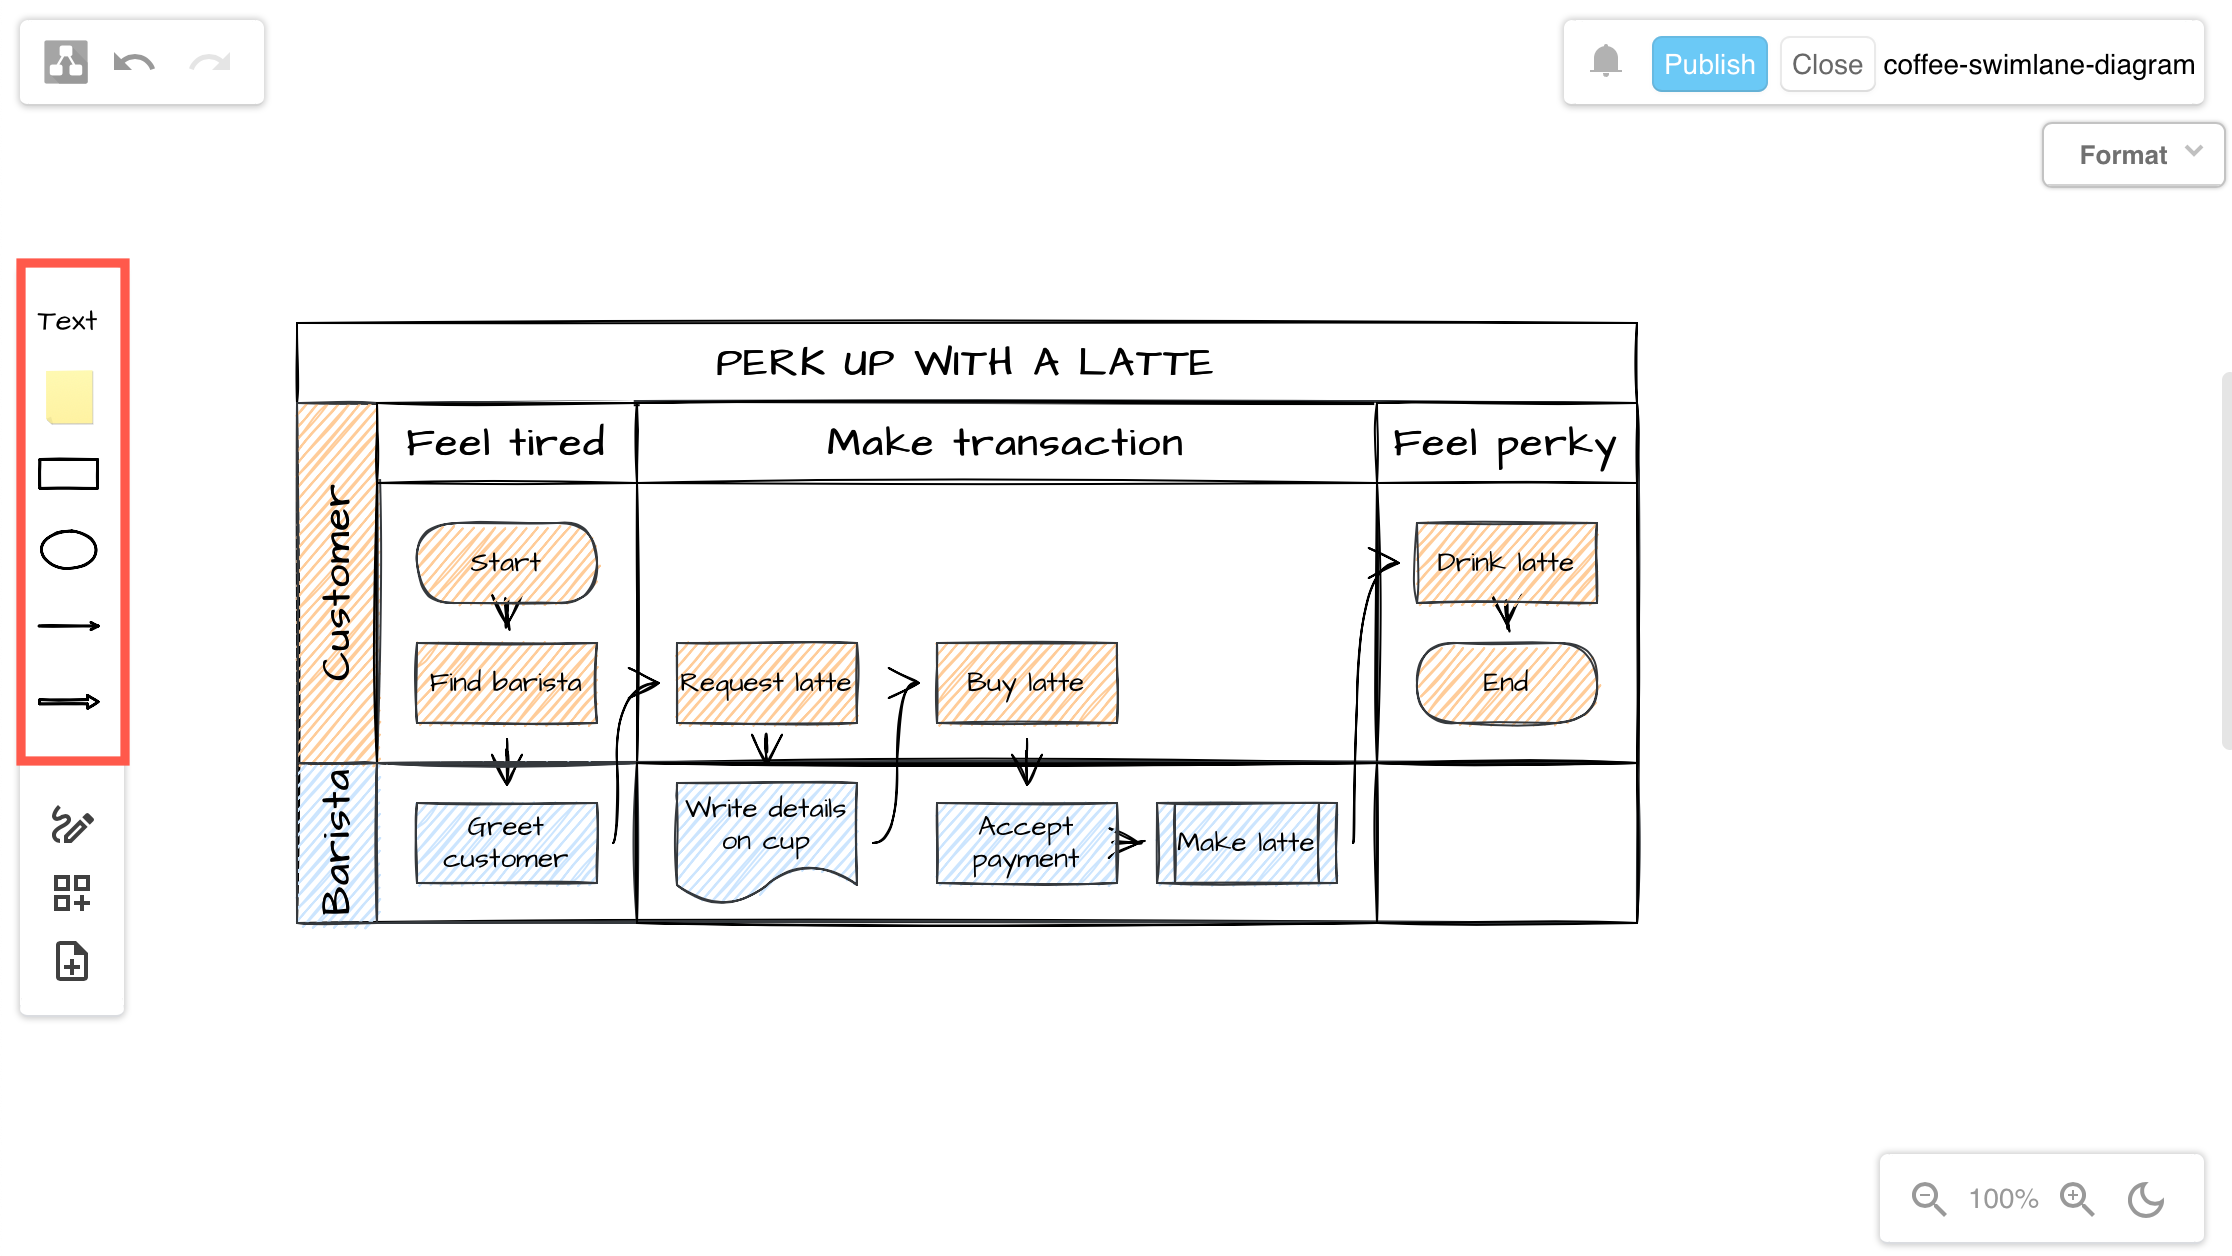
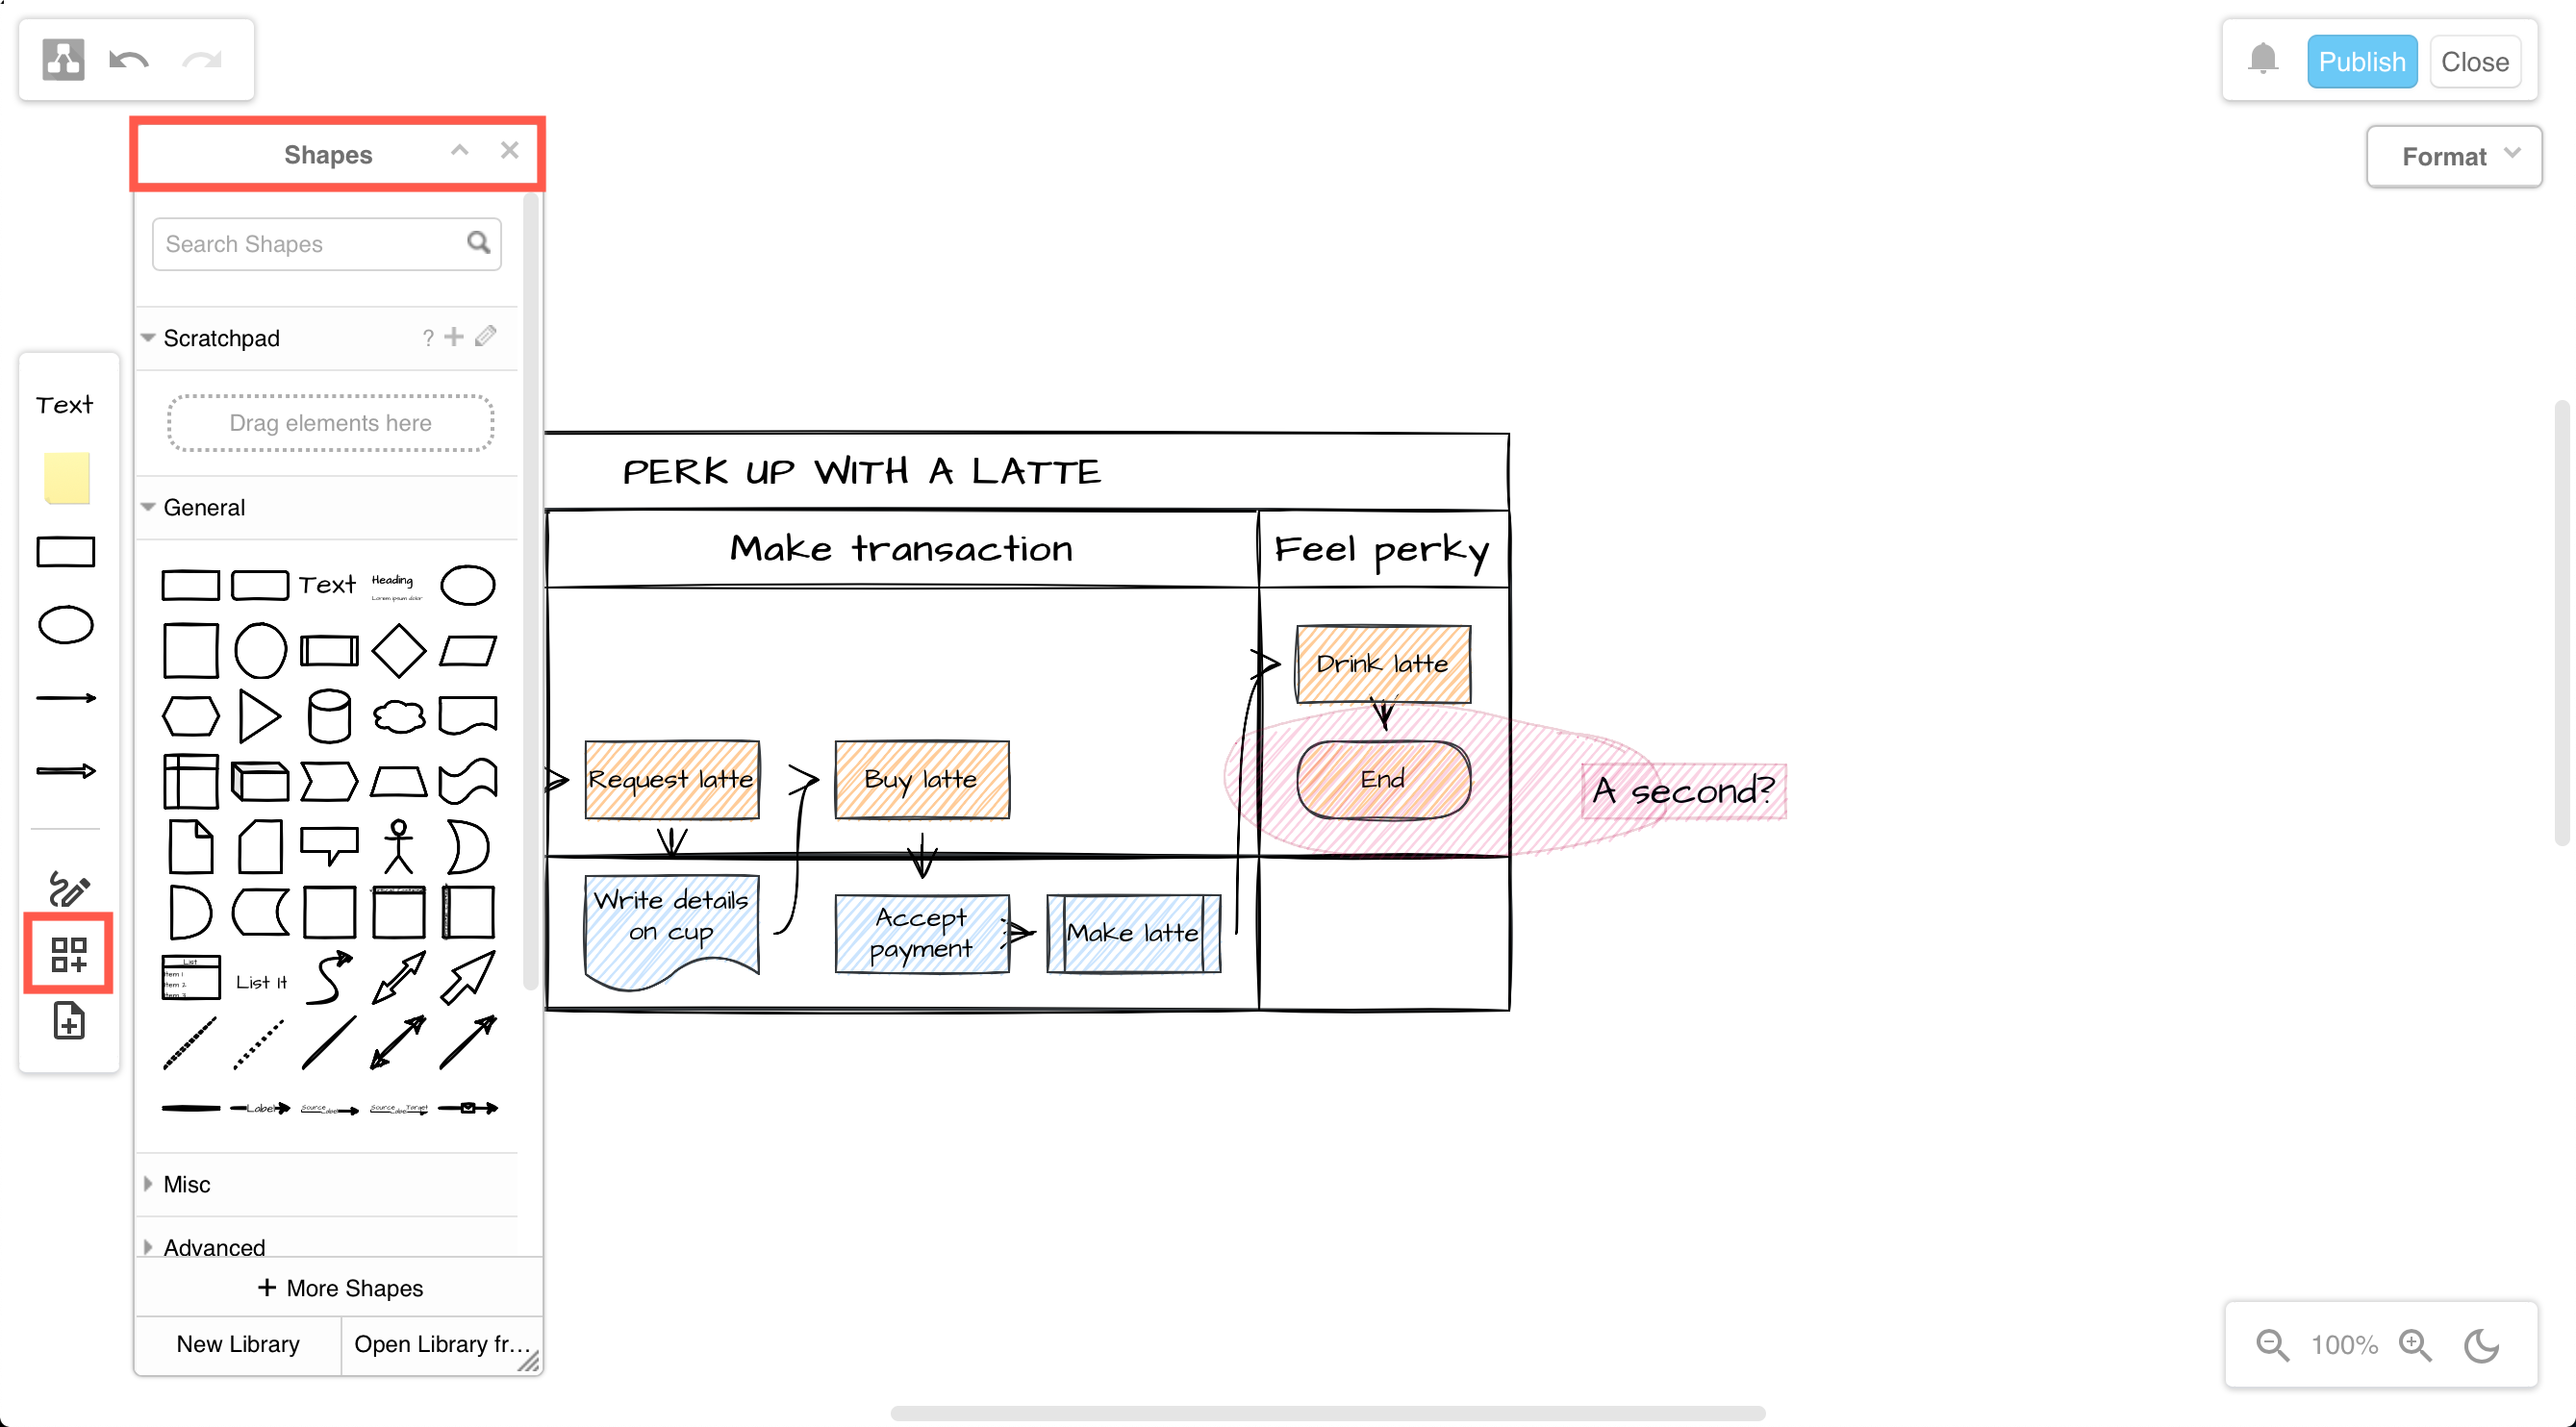
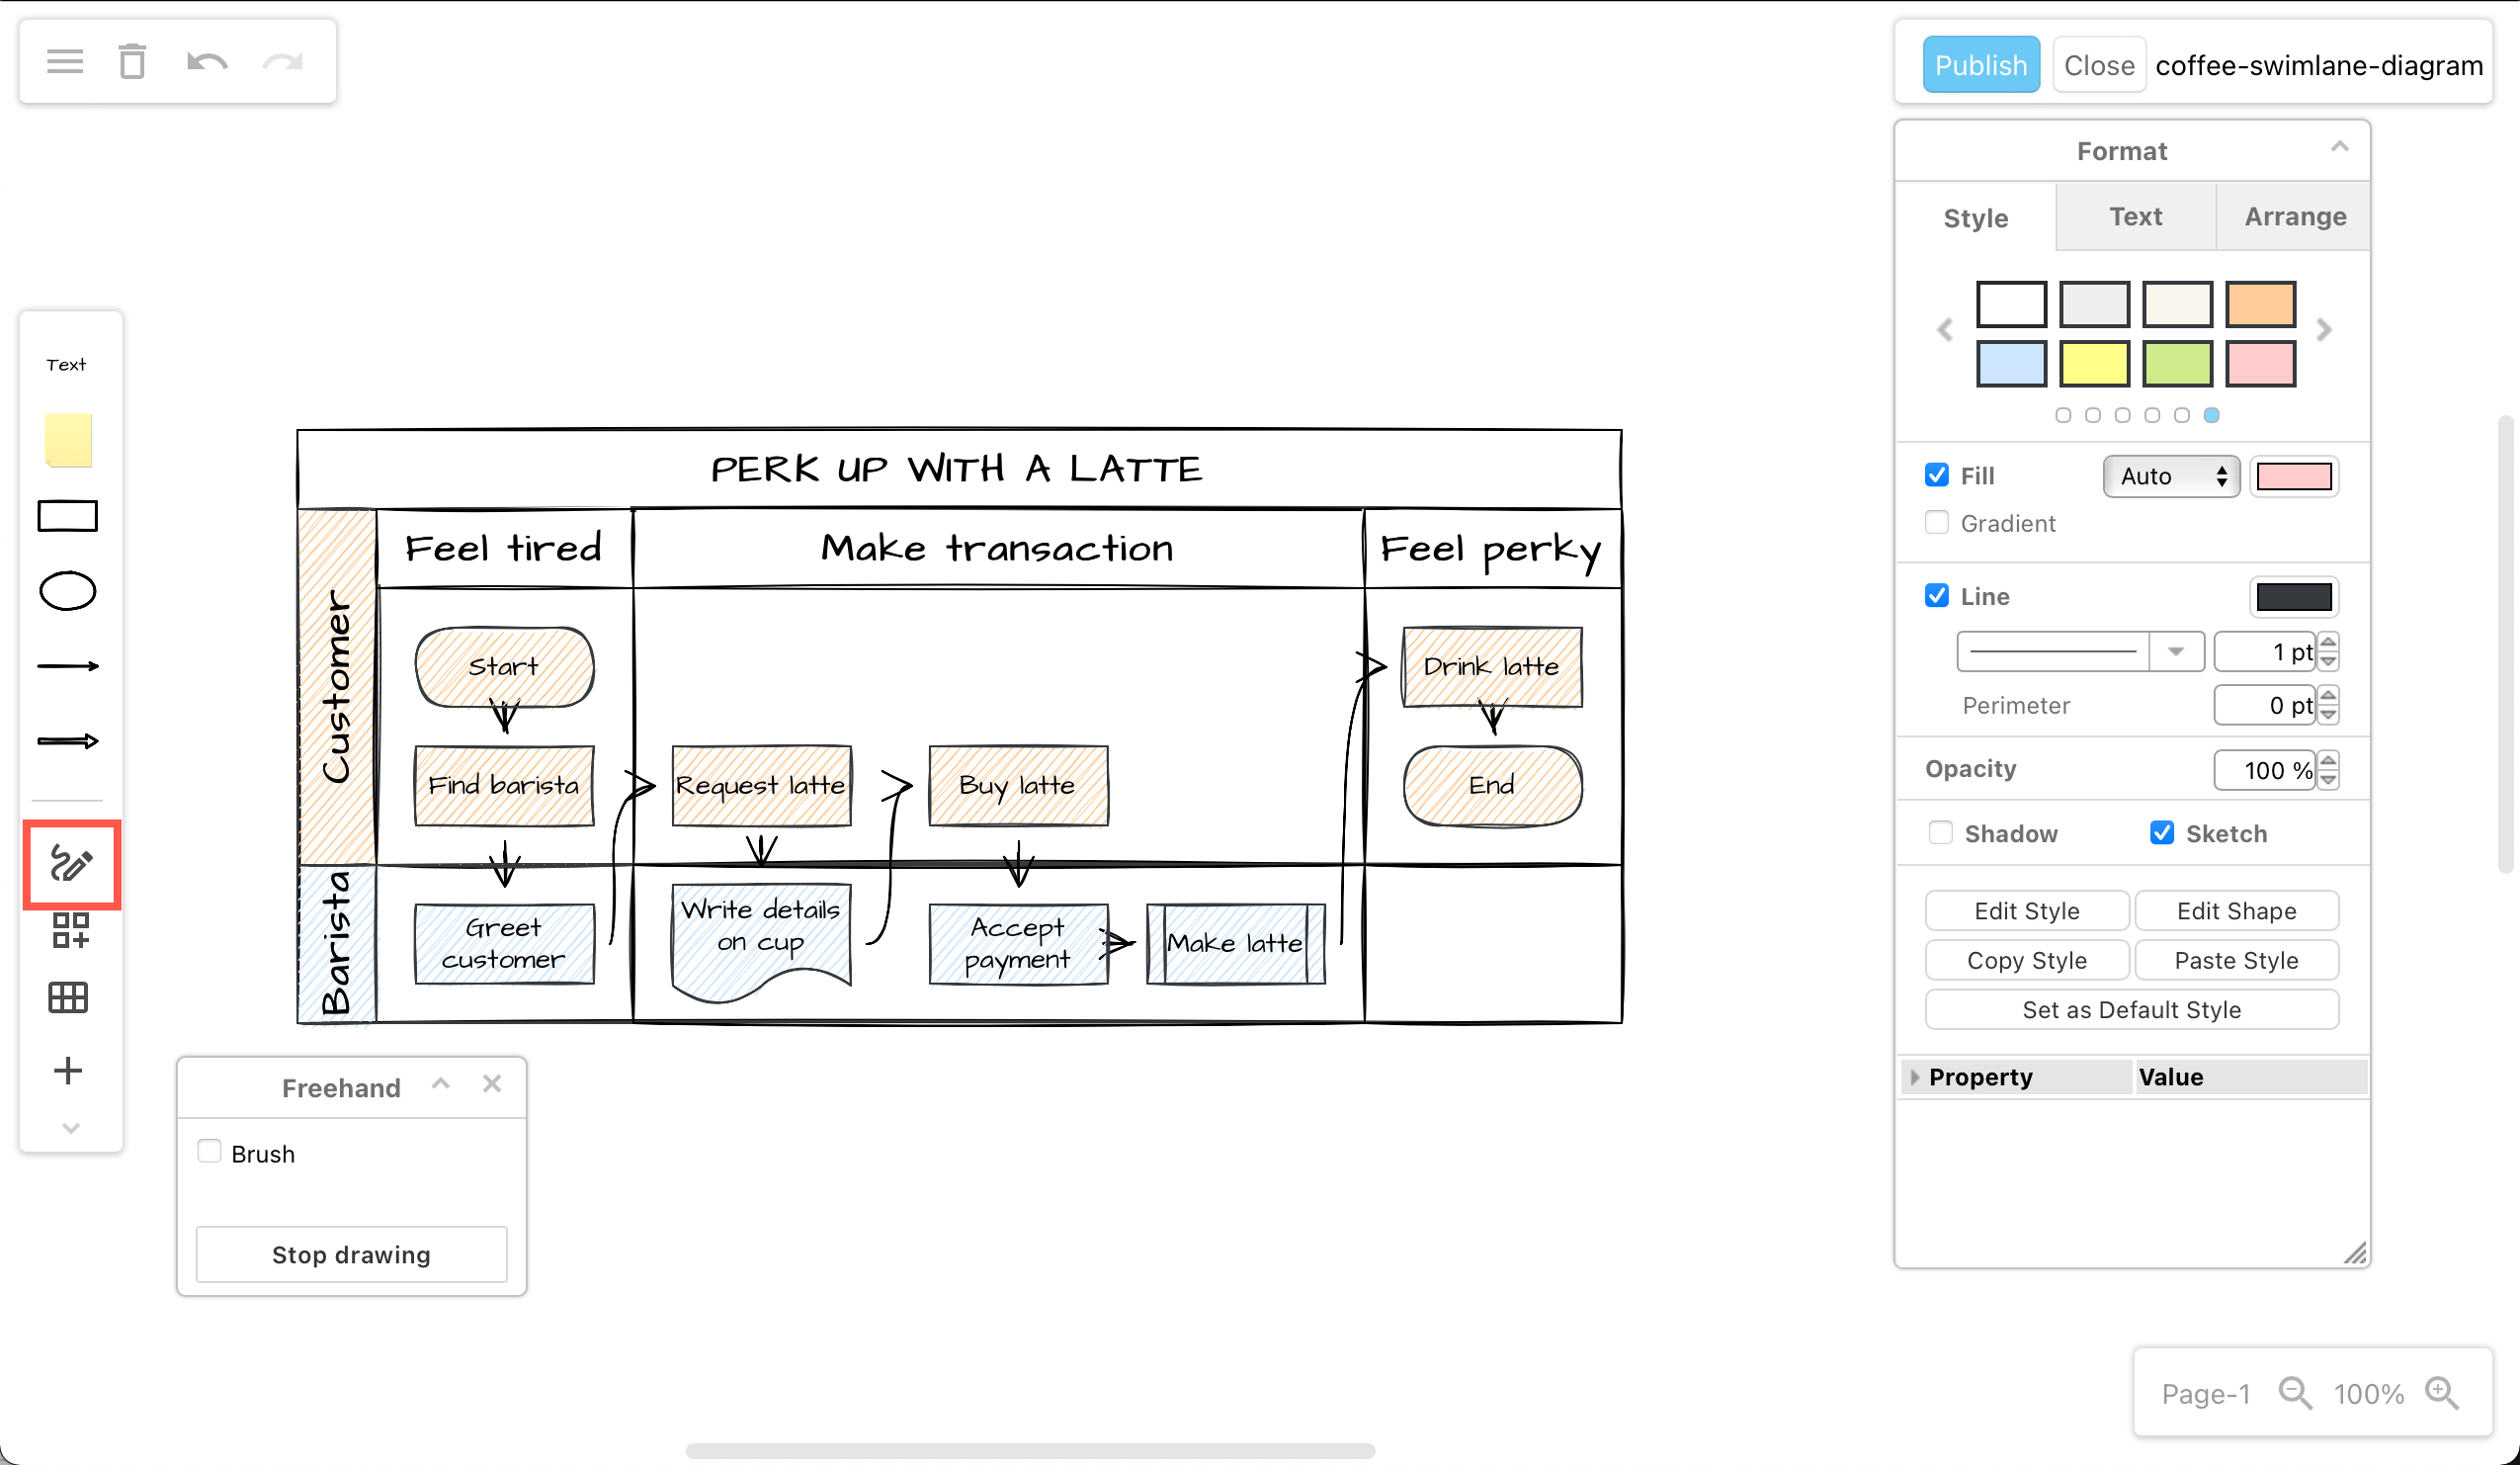
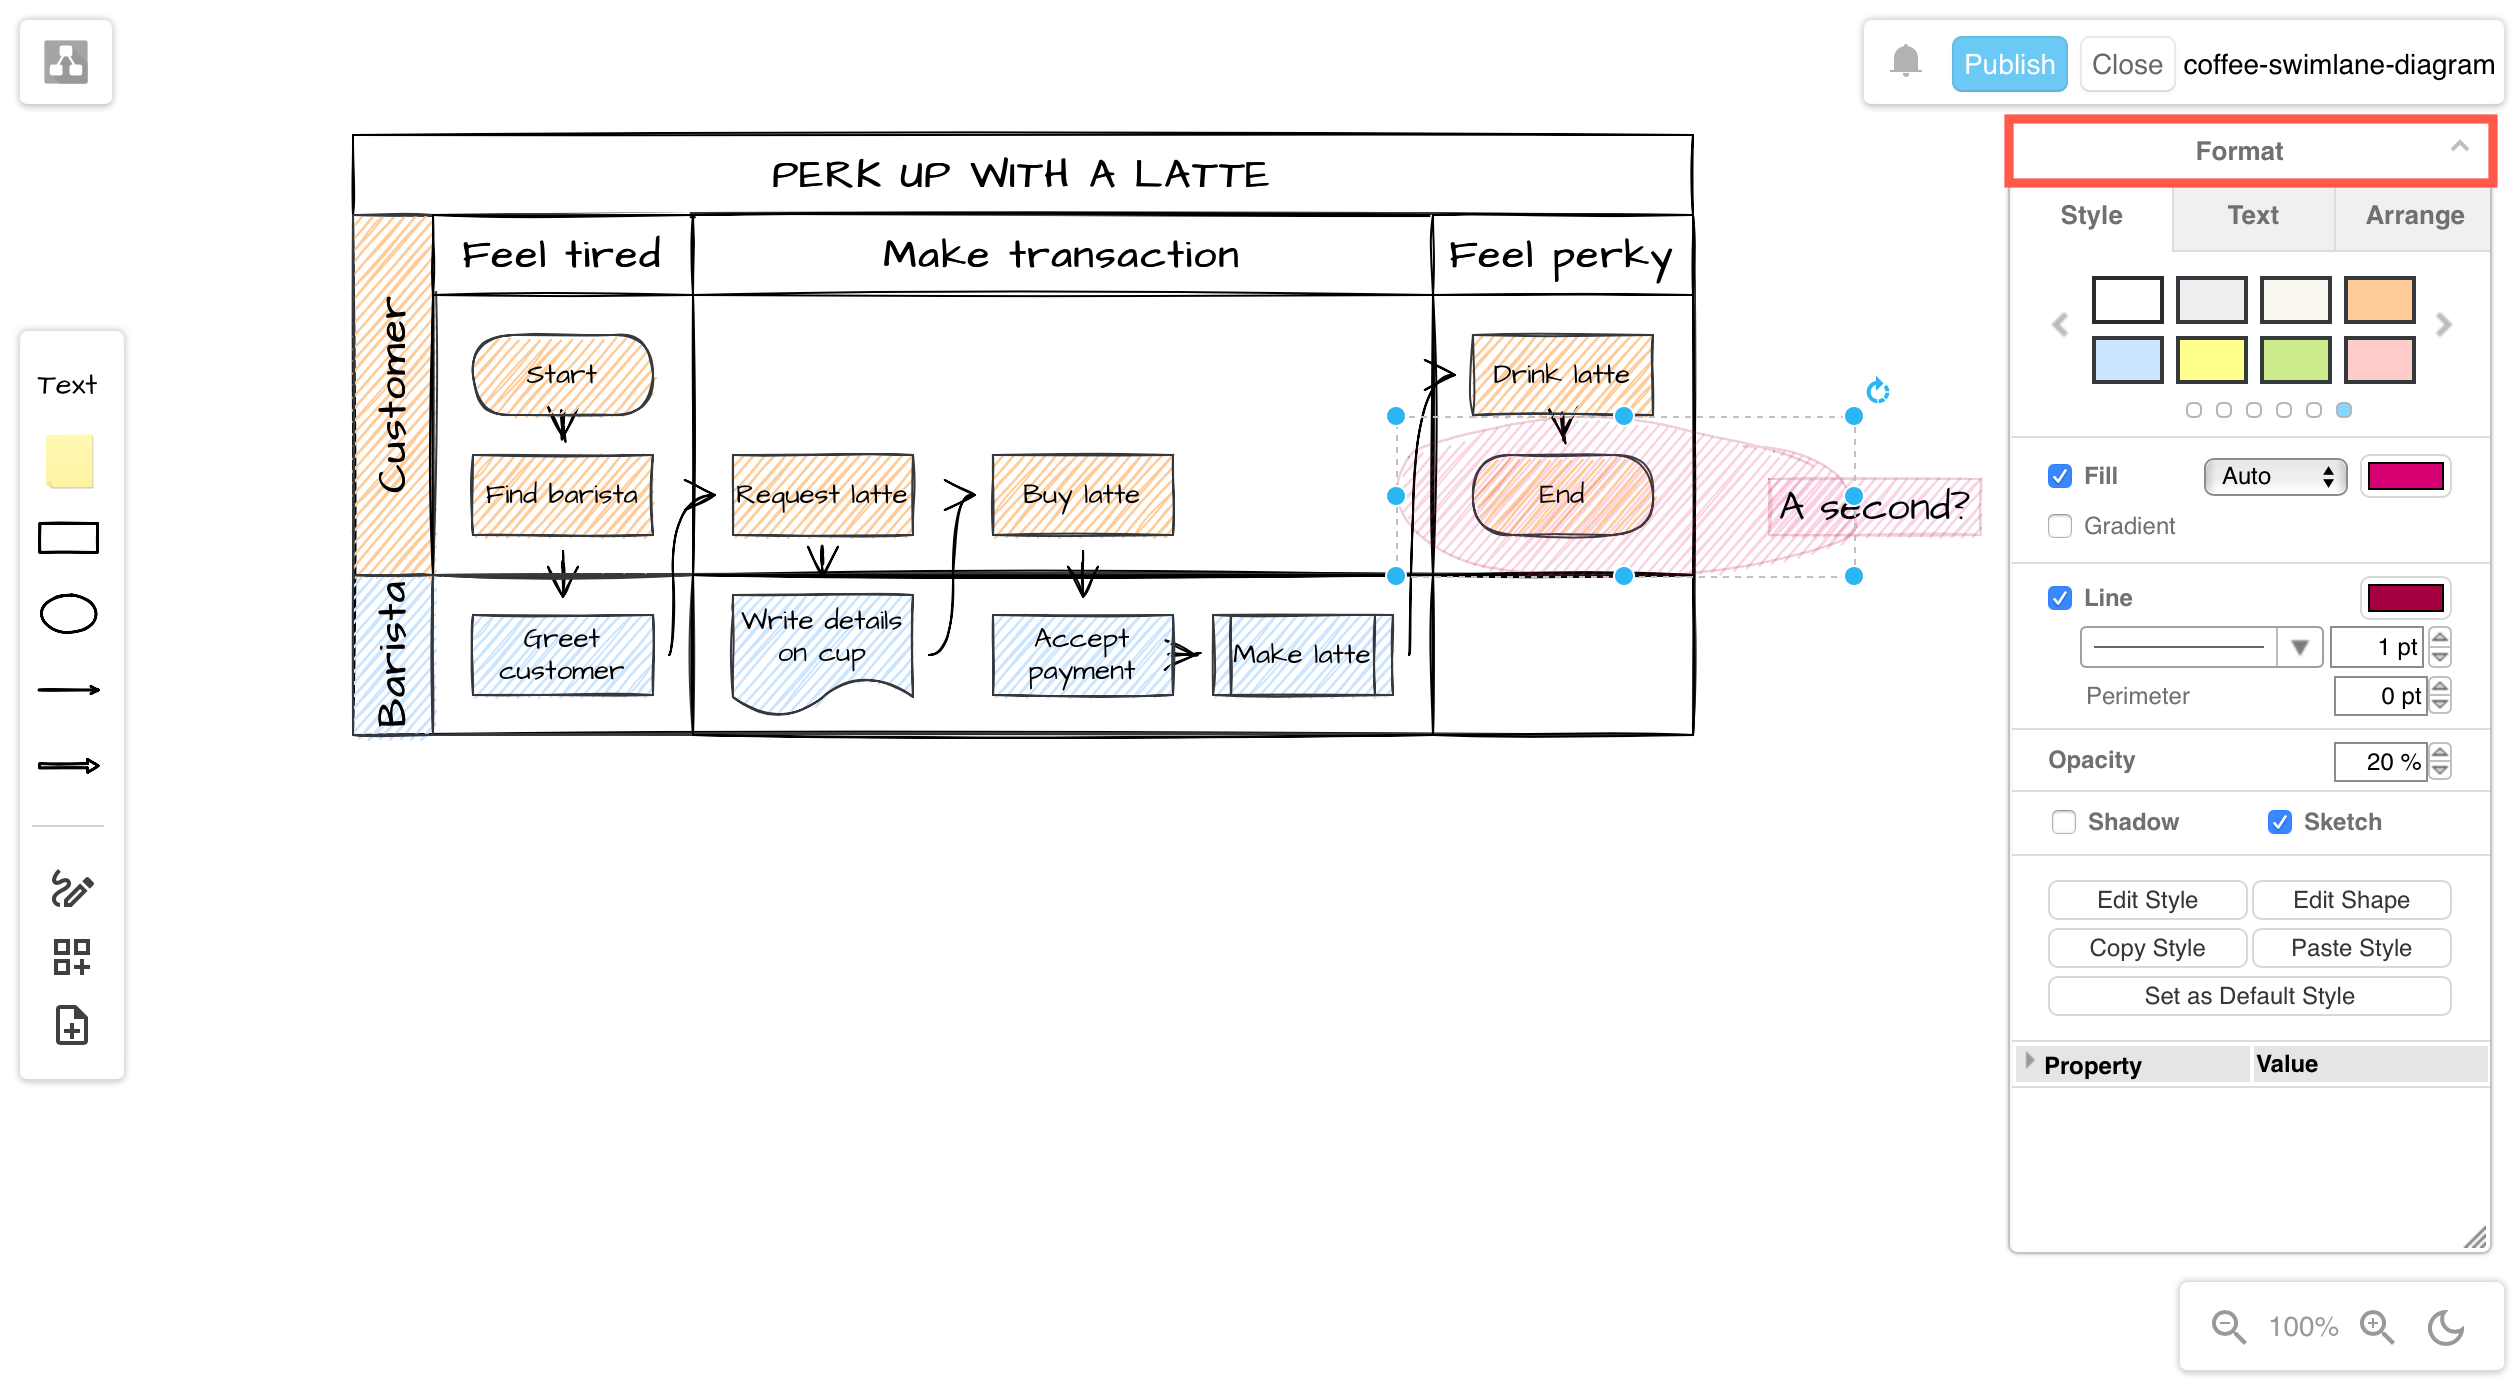
The Sketch editor theme, and the right-click context menu received a comprehensive overhaul. The tools and menus were simplified and reorganised to make it feel much more like a whiteboard you can sketch freely on. You can expand or collapse most of the panels, and move them to another location around the drawing canvas.

The freehand drawing tool was updated along with the whiteboard like editor theme.
Use the freehand drawing tool in a draw.io Board diagram to markup diagrams or draw shapes with your mouse

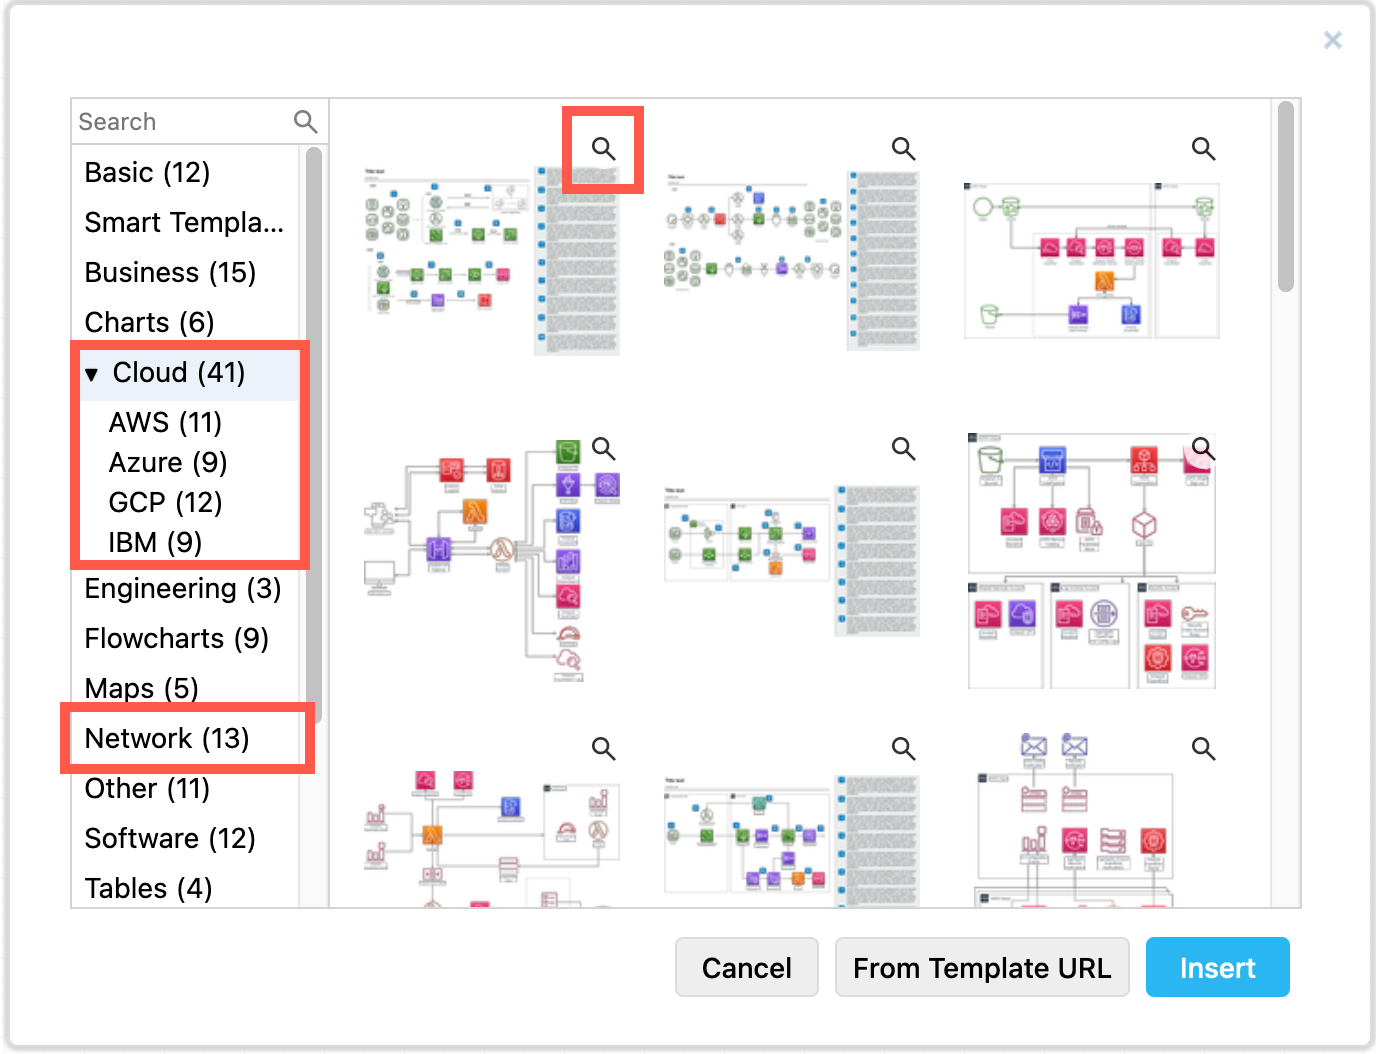
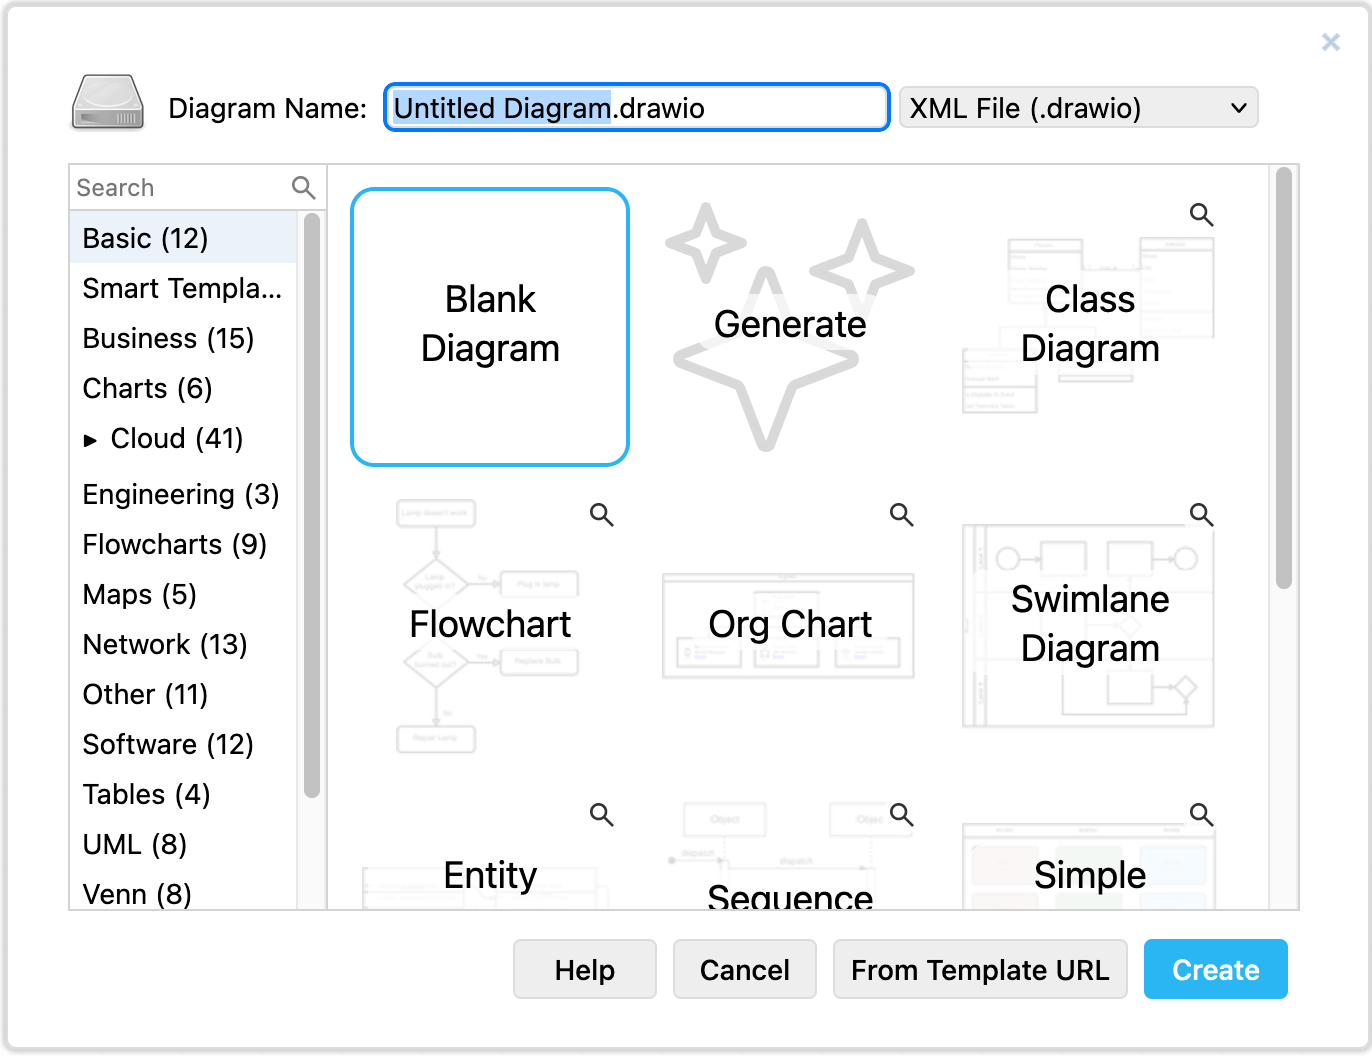
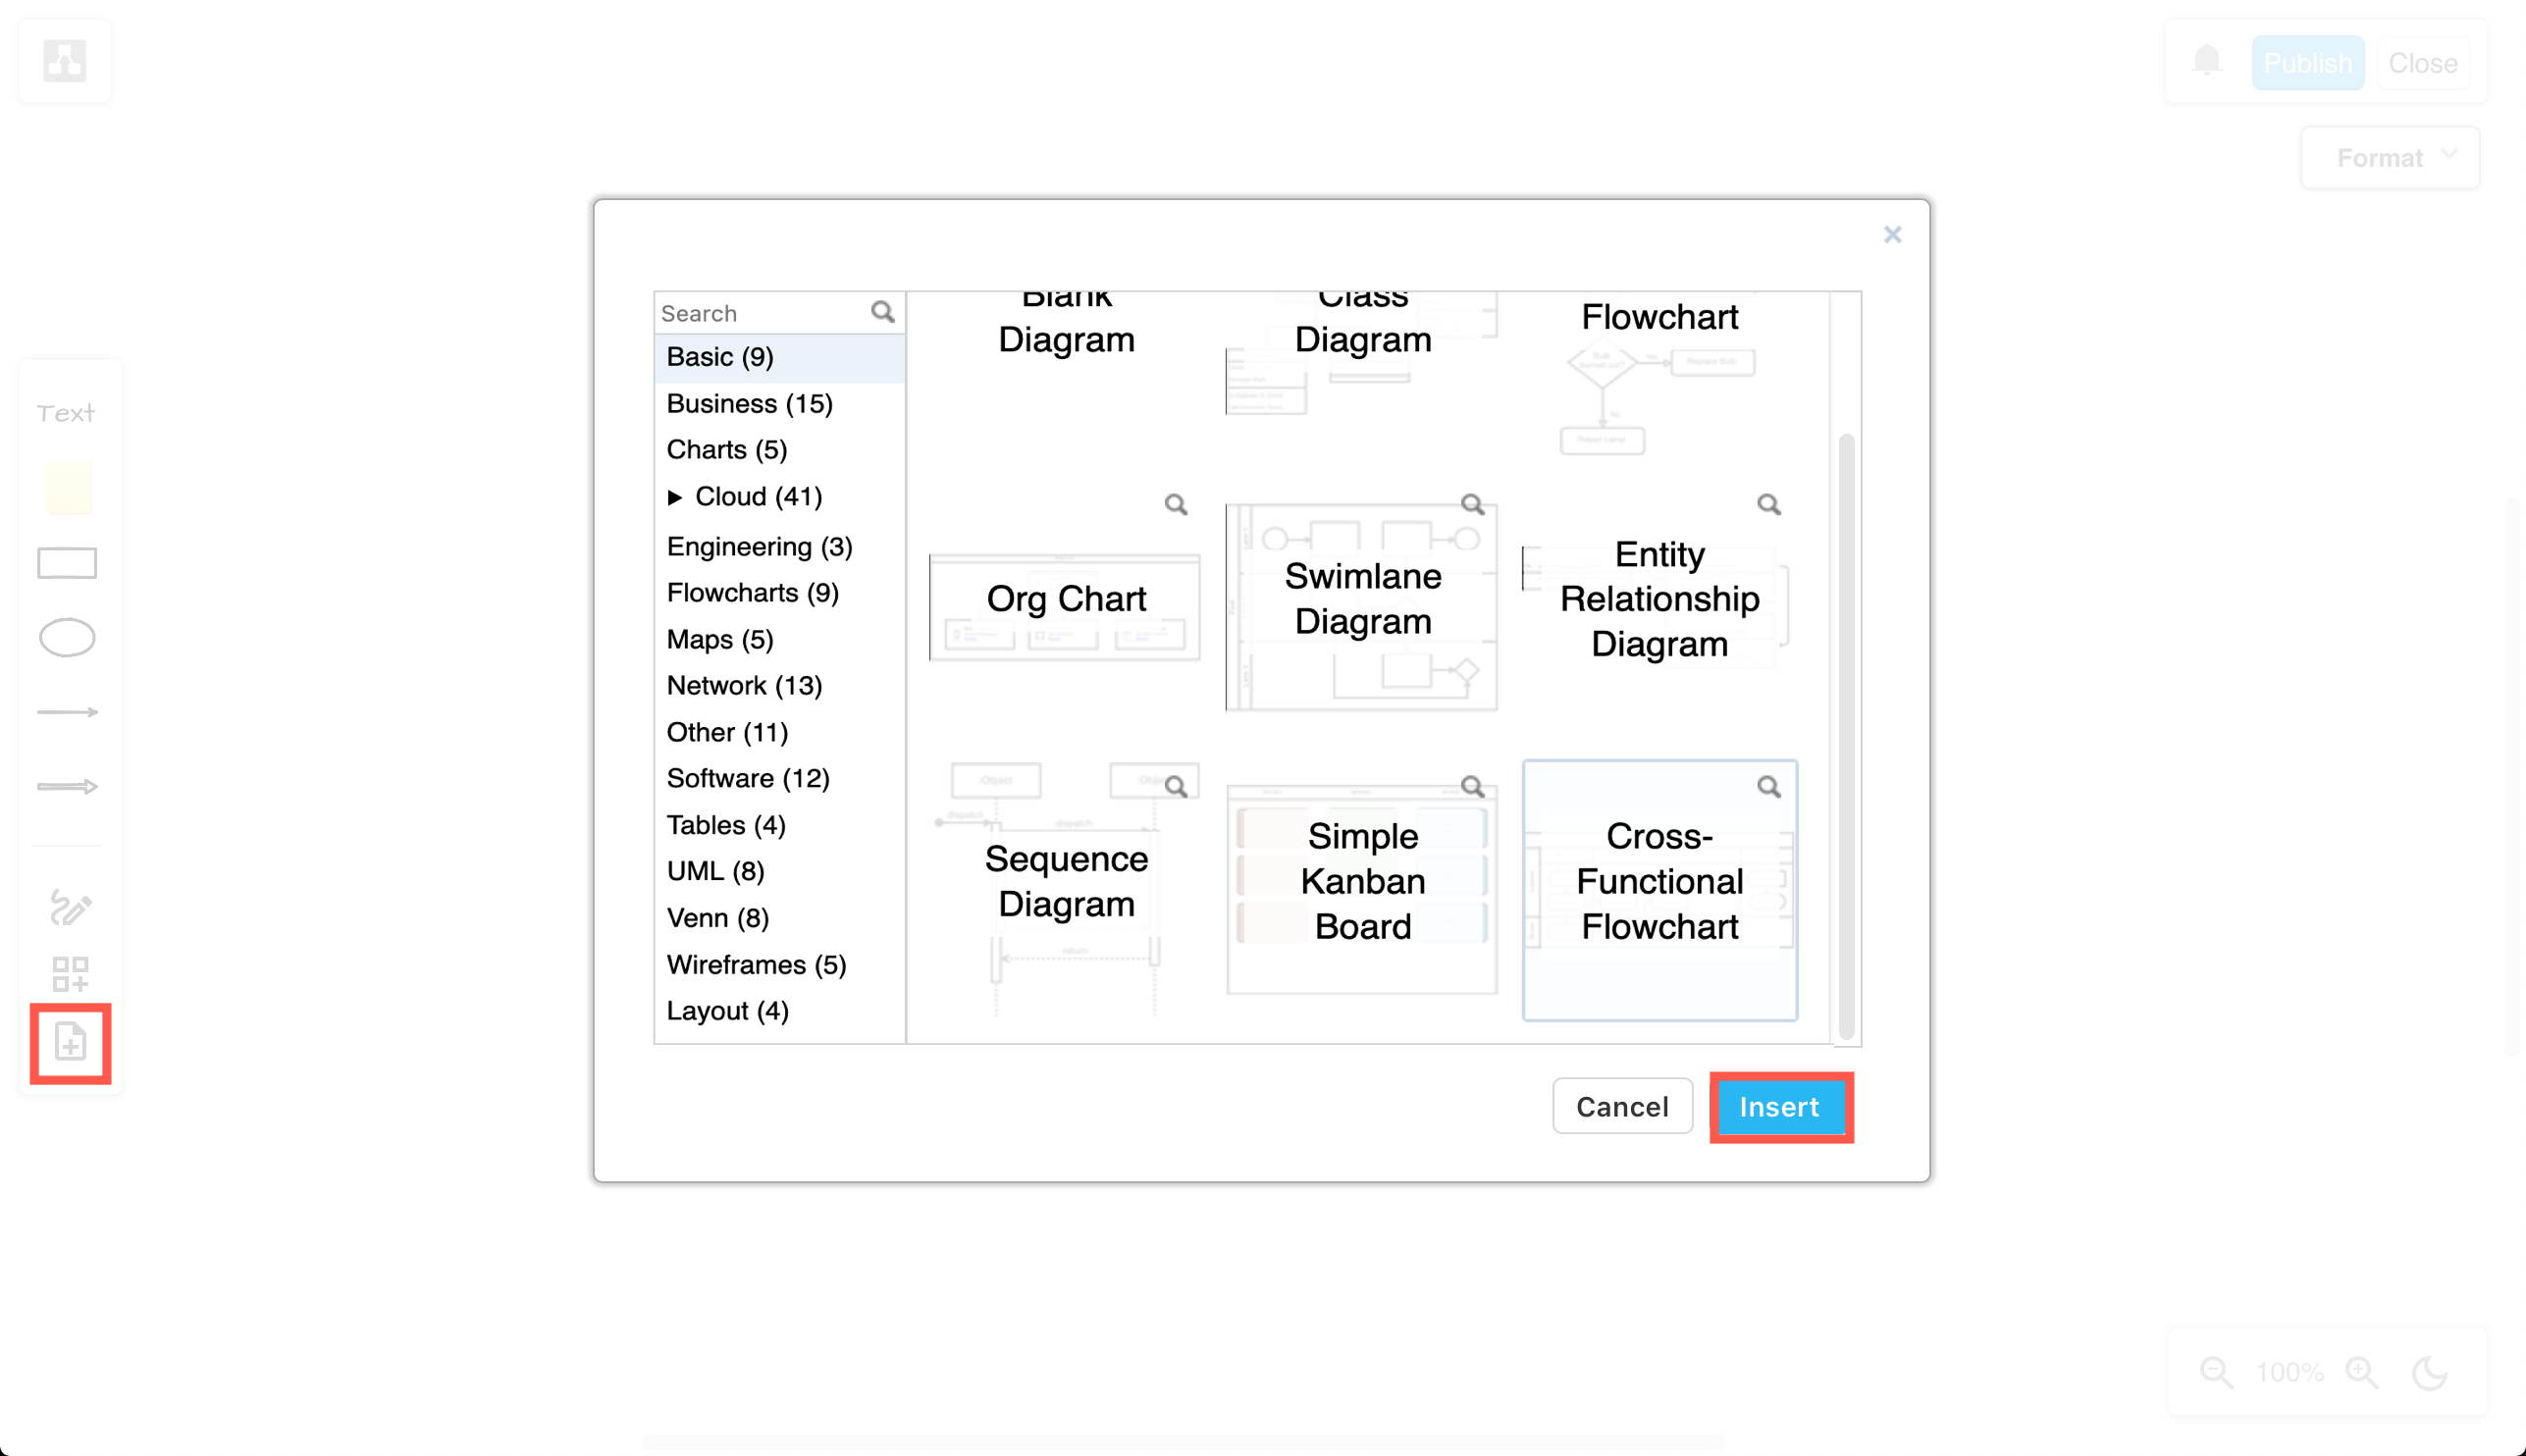
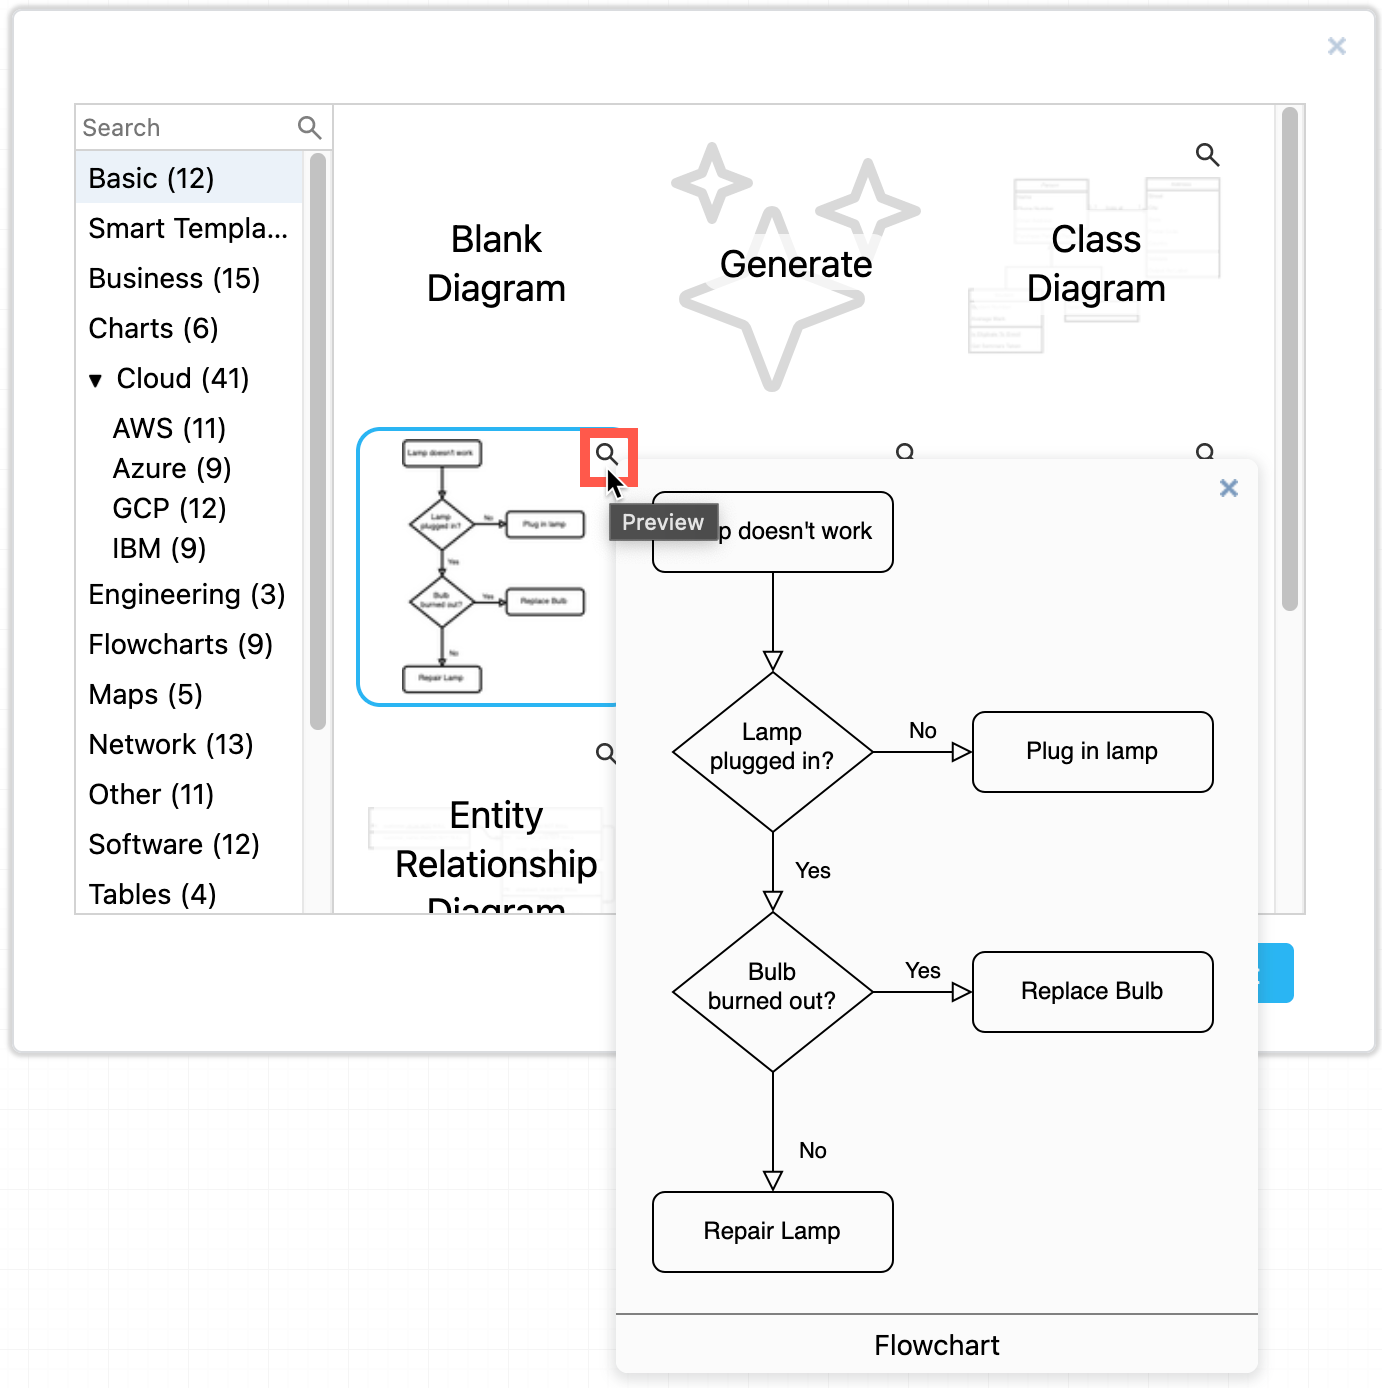
You can now search for templates and click on the magnifying glass in the top right of any template to see a larger preview. The draw.io template library was also expanded with more templates and template categories.
Hover over a template in draw.io to see a larger preview of it

In addition to moving diagram elements to the front or the back of an overlapping stack, you can step shapes and connectors forwards and backwards in the z-order stack using the Bring Forward and Send Backward buttons on the Arrange tab in the format panel.
Bring overlapping shapes to the front or send them to the back via the Arrange tab

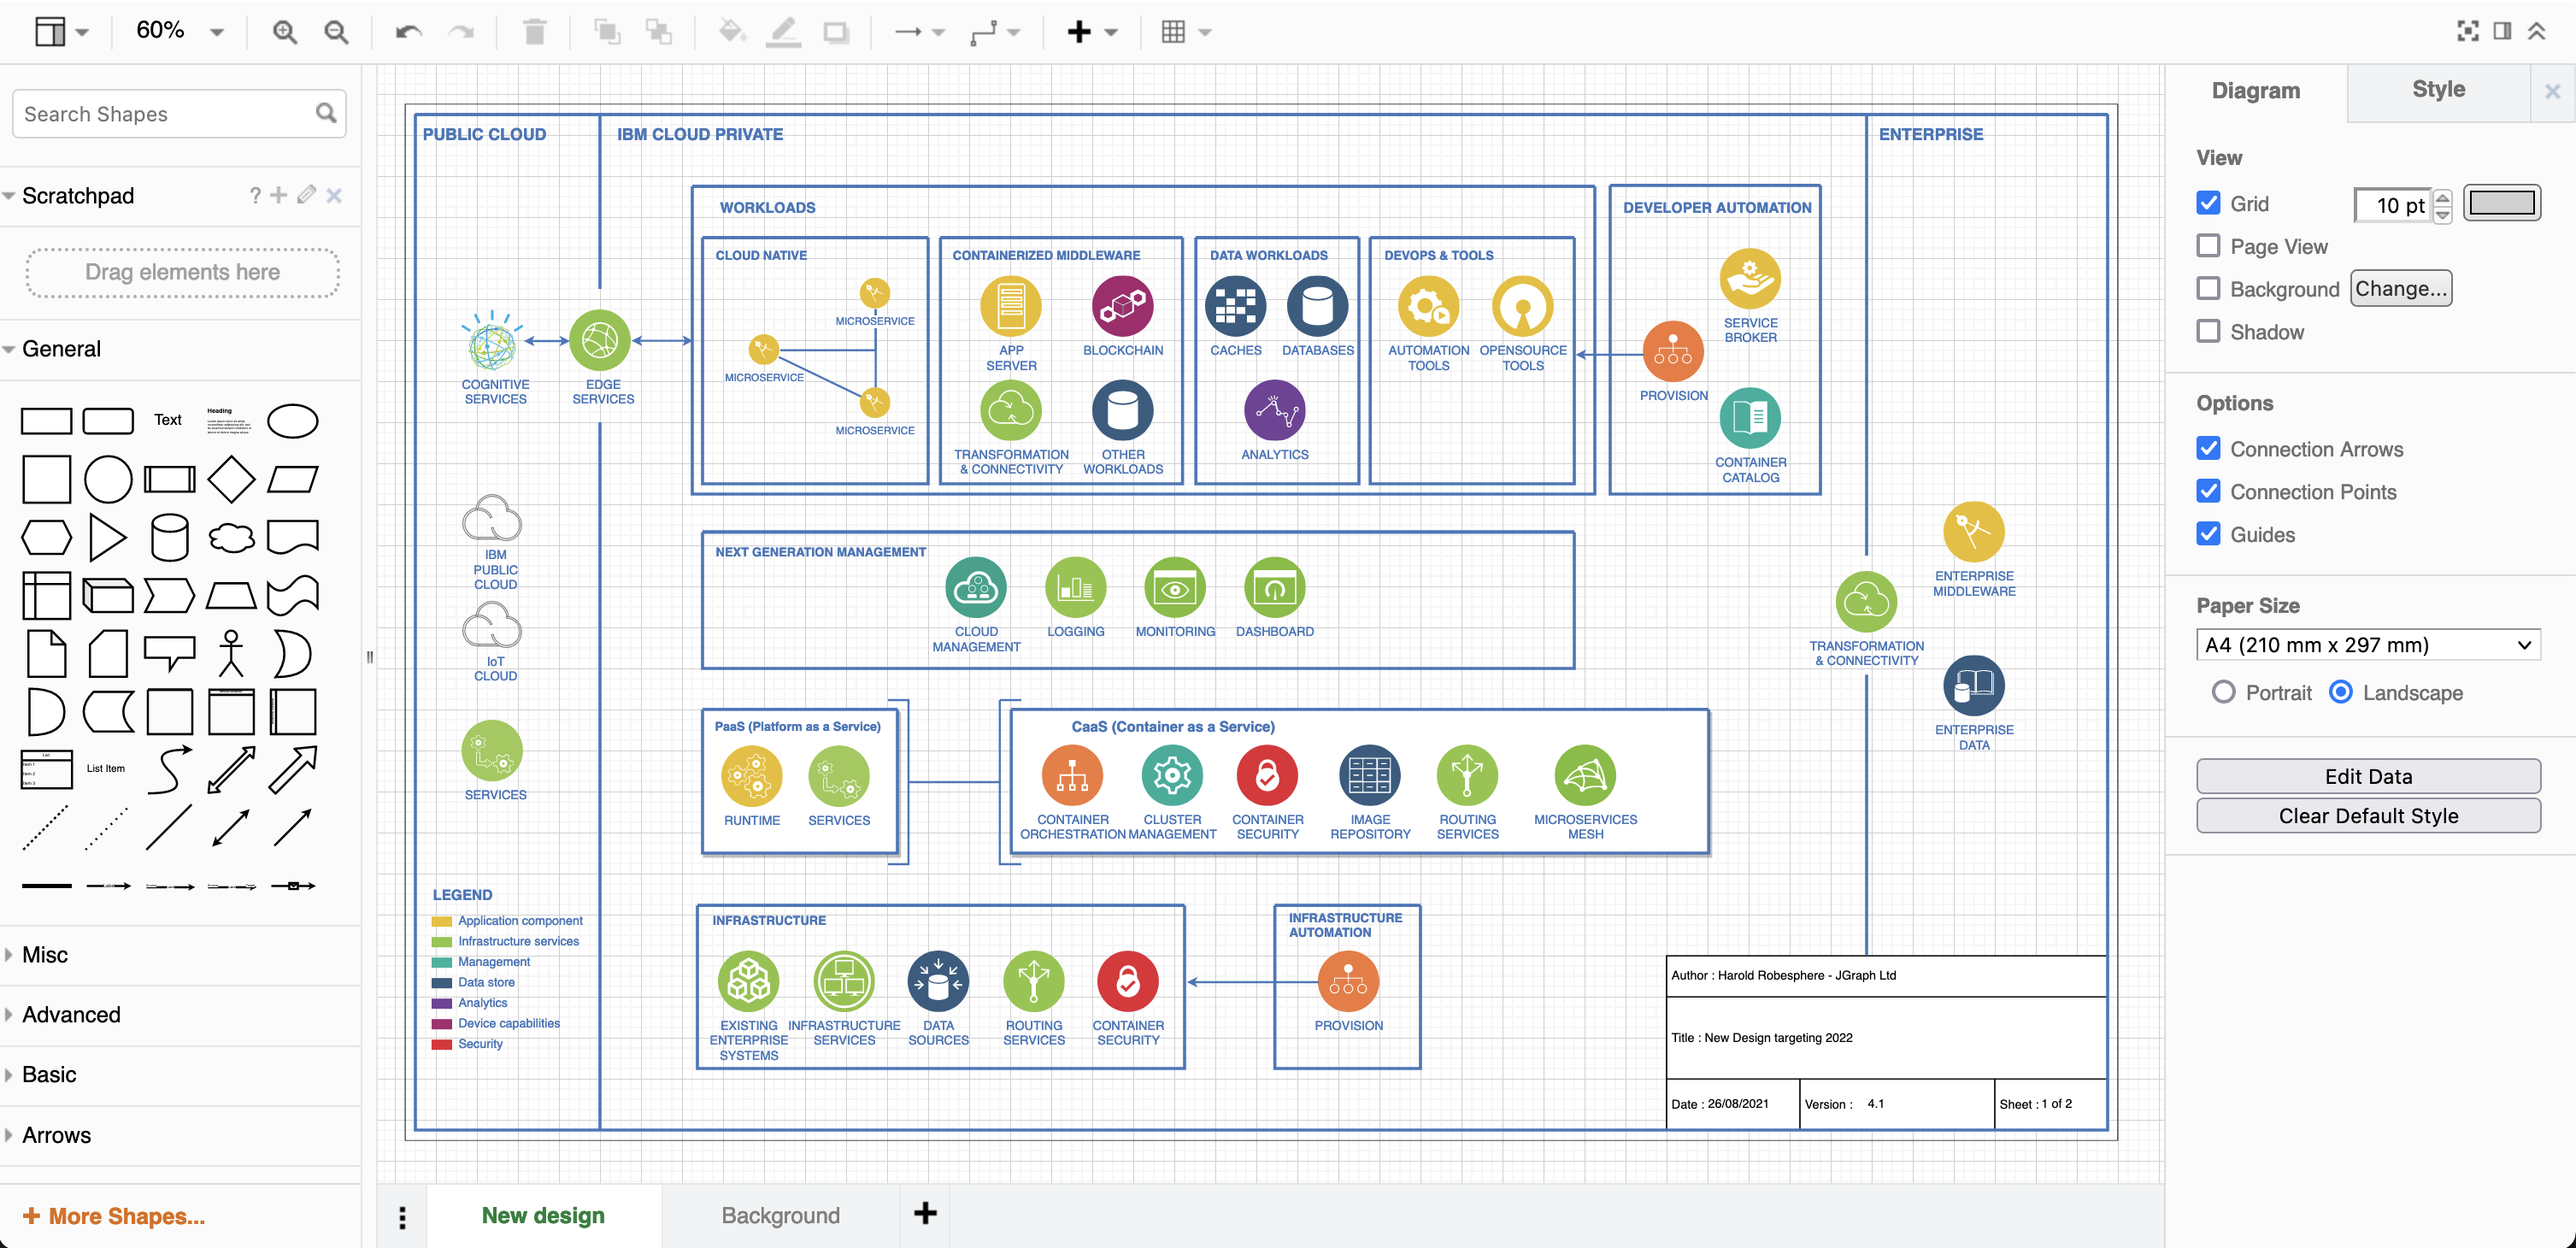
You can now use a diagram page as a background behind another diagram page. It will be printed along with the diagram, and is ideal for watermarking your diagrams, providing a common layout for mockups, or adding a template for diagram metadata on development documentation.
Diagram complete with background

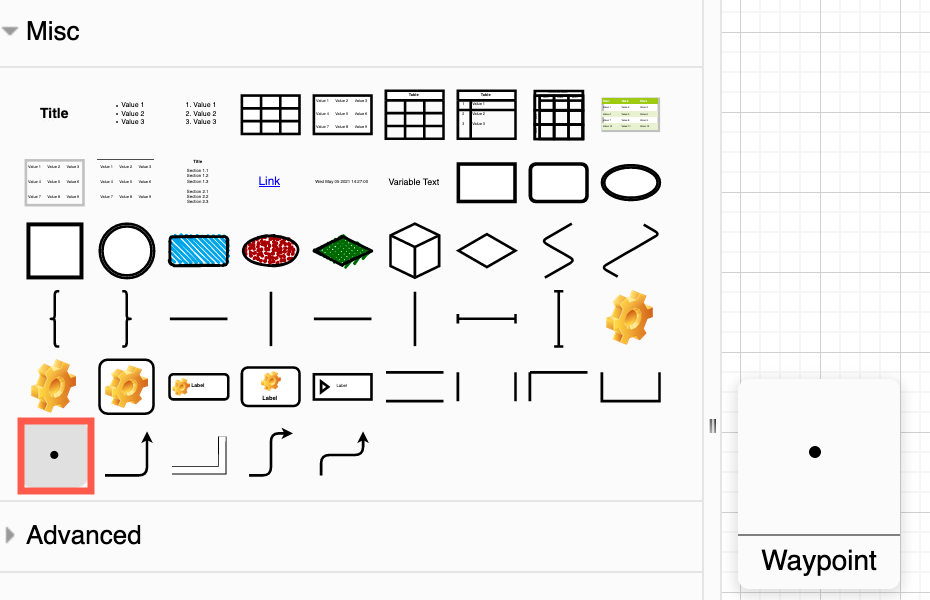
A waypoint shape is now available in the Misc shape library (part of the General collection). You can use the small waypoint shape to join connectors together, replacing overlapping connectors with the same target or source shape neatly and cleanly.
Drag the waypoint shape from the Misc shape library in draw.io Use waypoint shapes in draw.io to show contact points and enable line jumps to see where wires pass each other without connecting

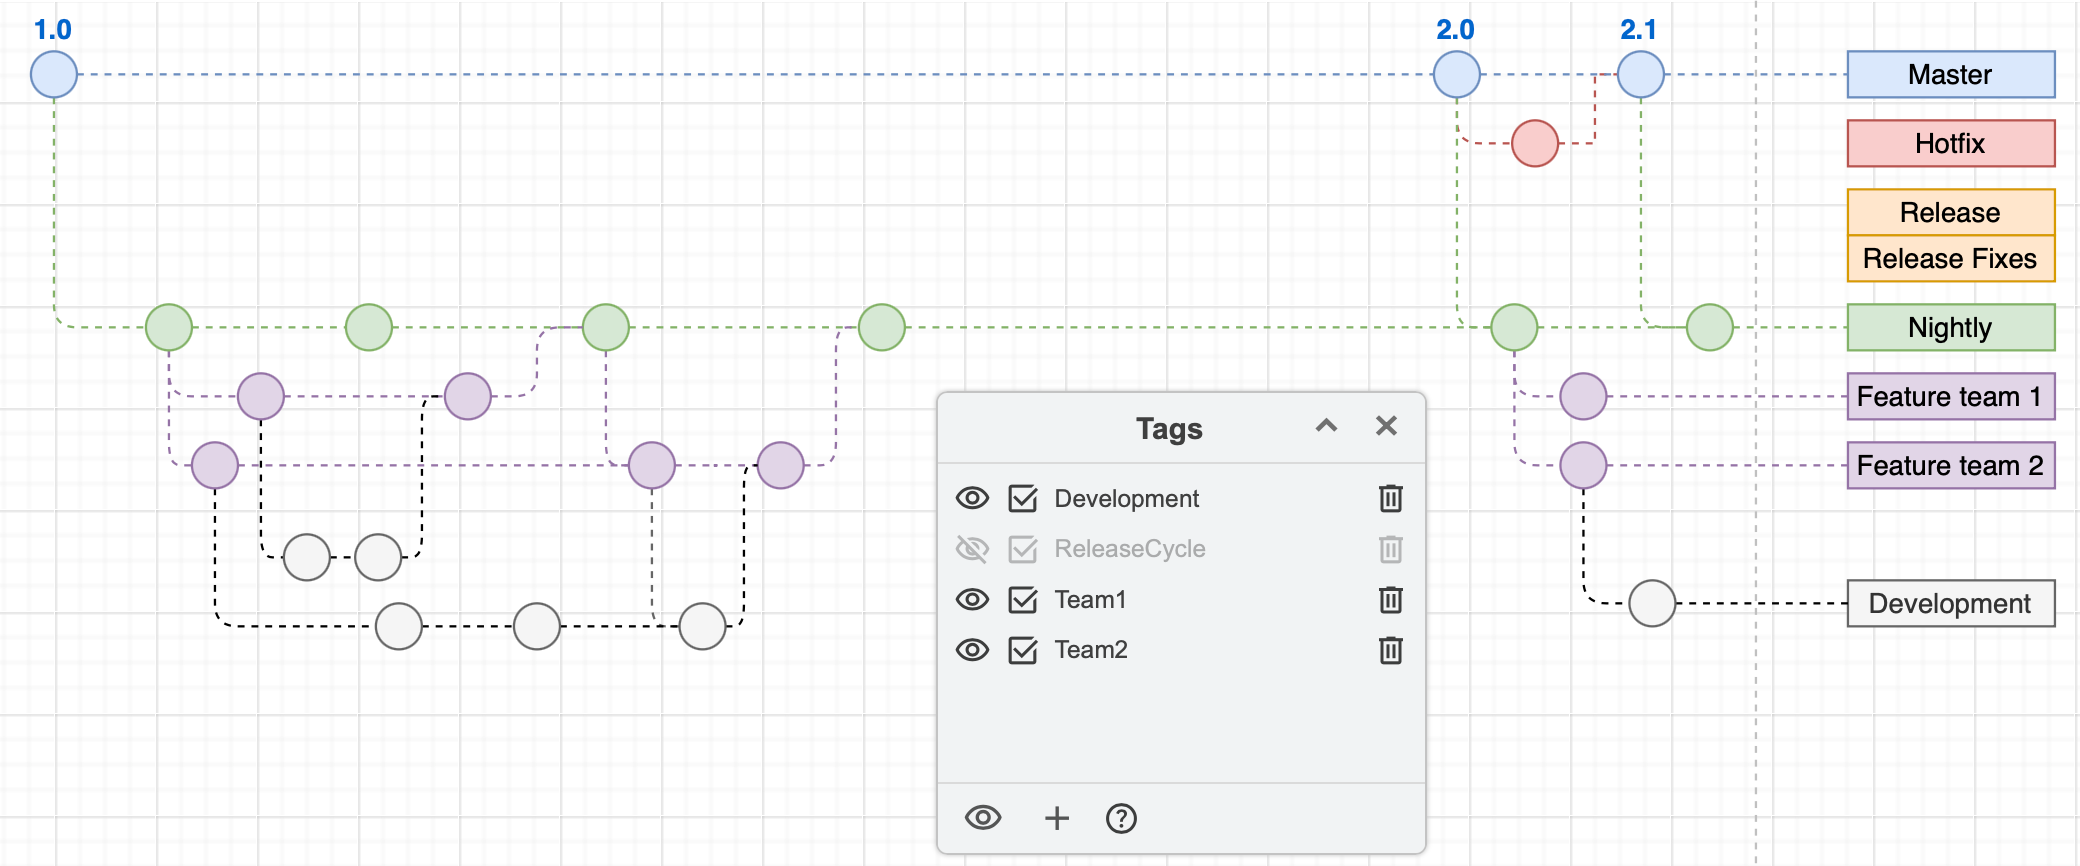
Tags have been brought into the draw.io editor as a core feature and the experimental tags plugin has been retired. Add one or more tags to shapes and connectors to group them without needing to place them on the same layer in your diagram.

Use the Tags dialog (View > Tags) to group, select, hide or display the tagged shapes.
Tags on shapes and connectors in diagrams allow you to quickly select, hide or display related shapes without them needing to be grouped or on a single layer

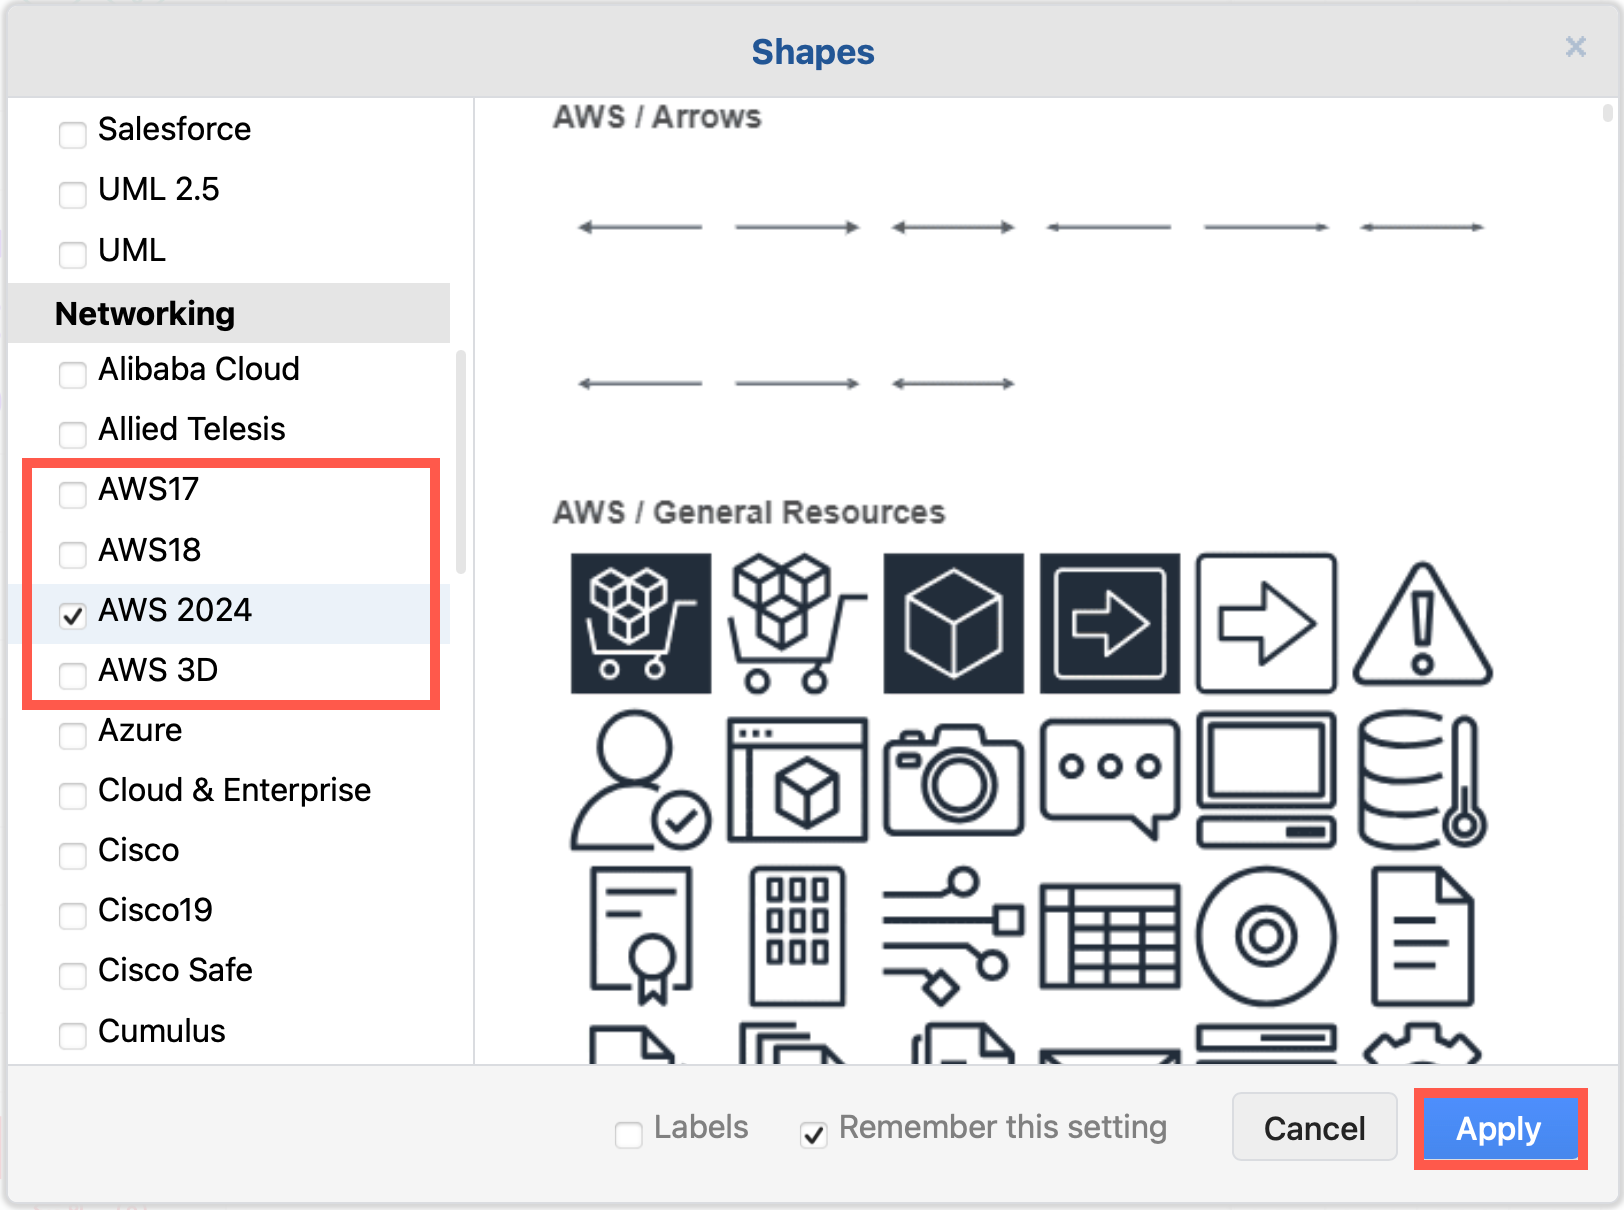
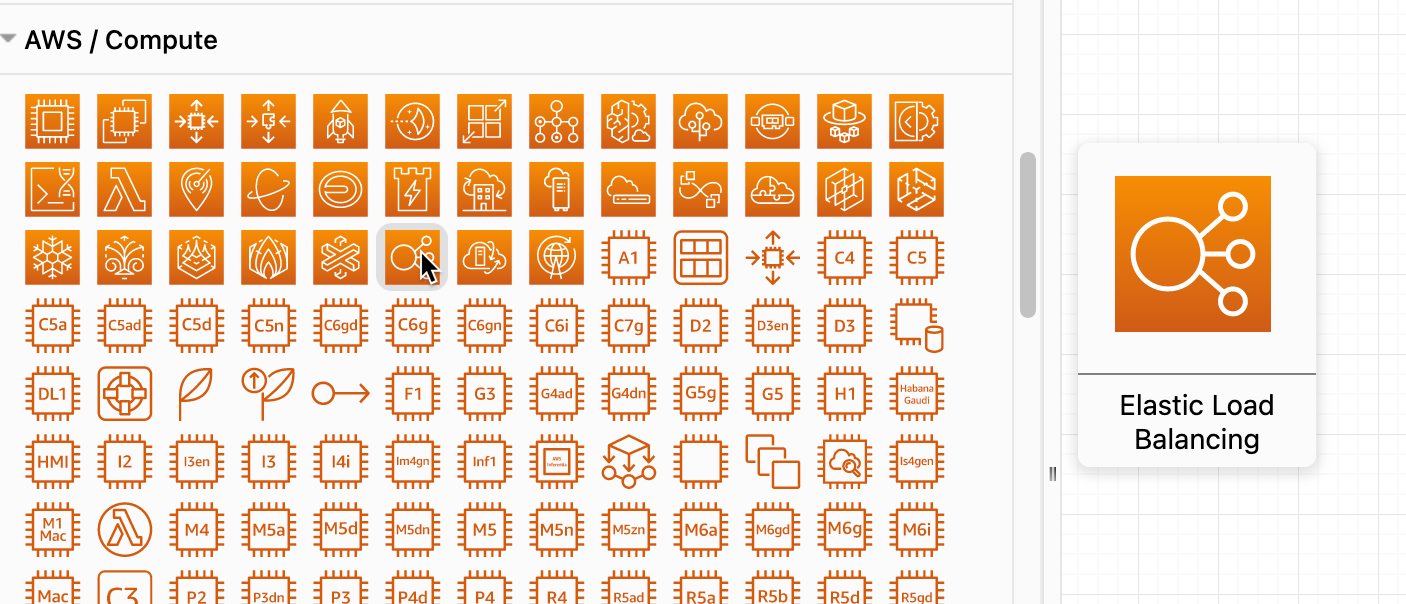
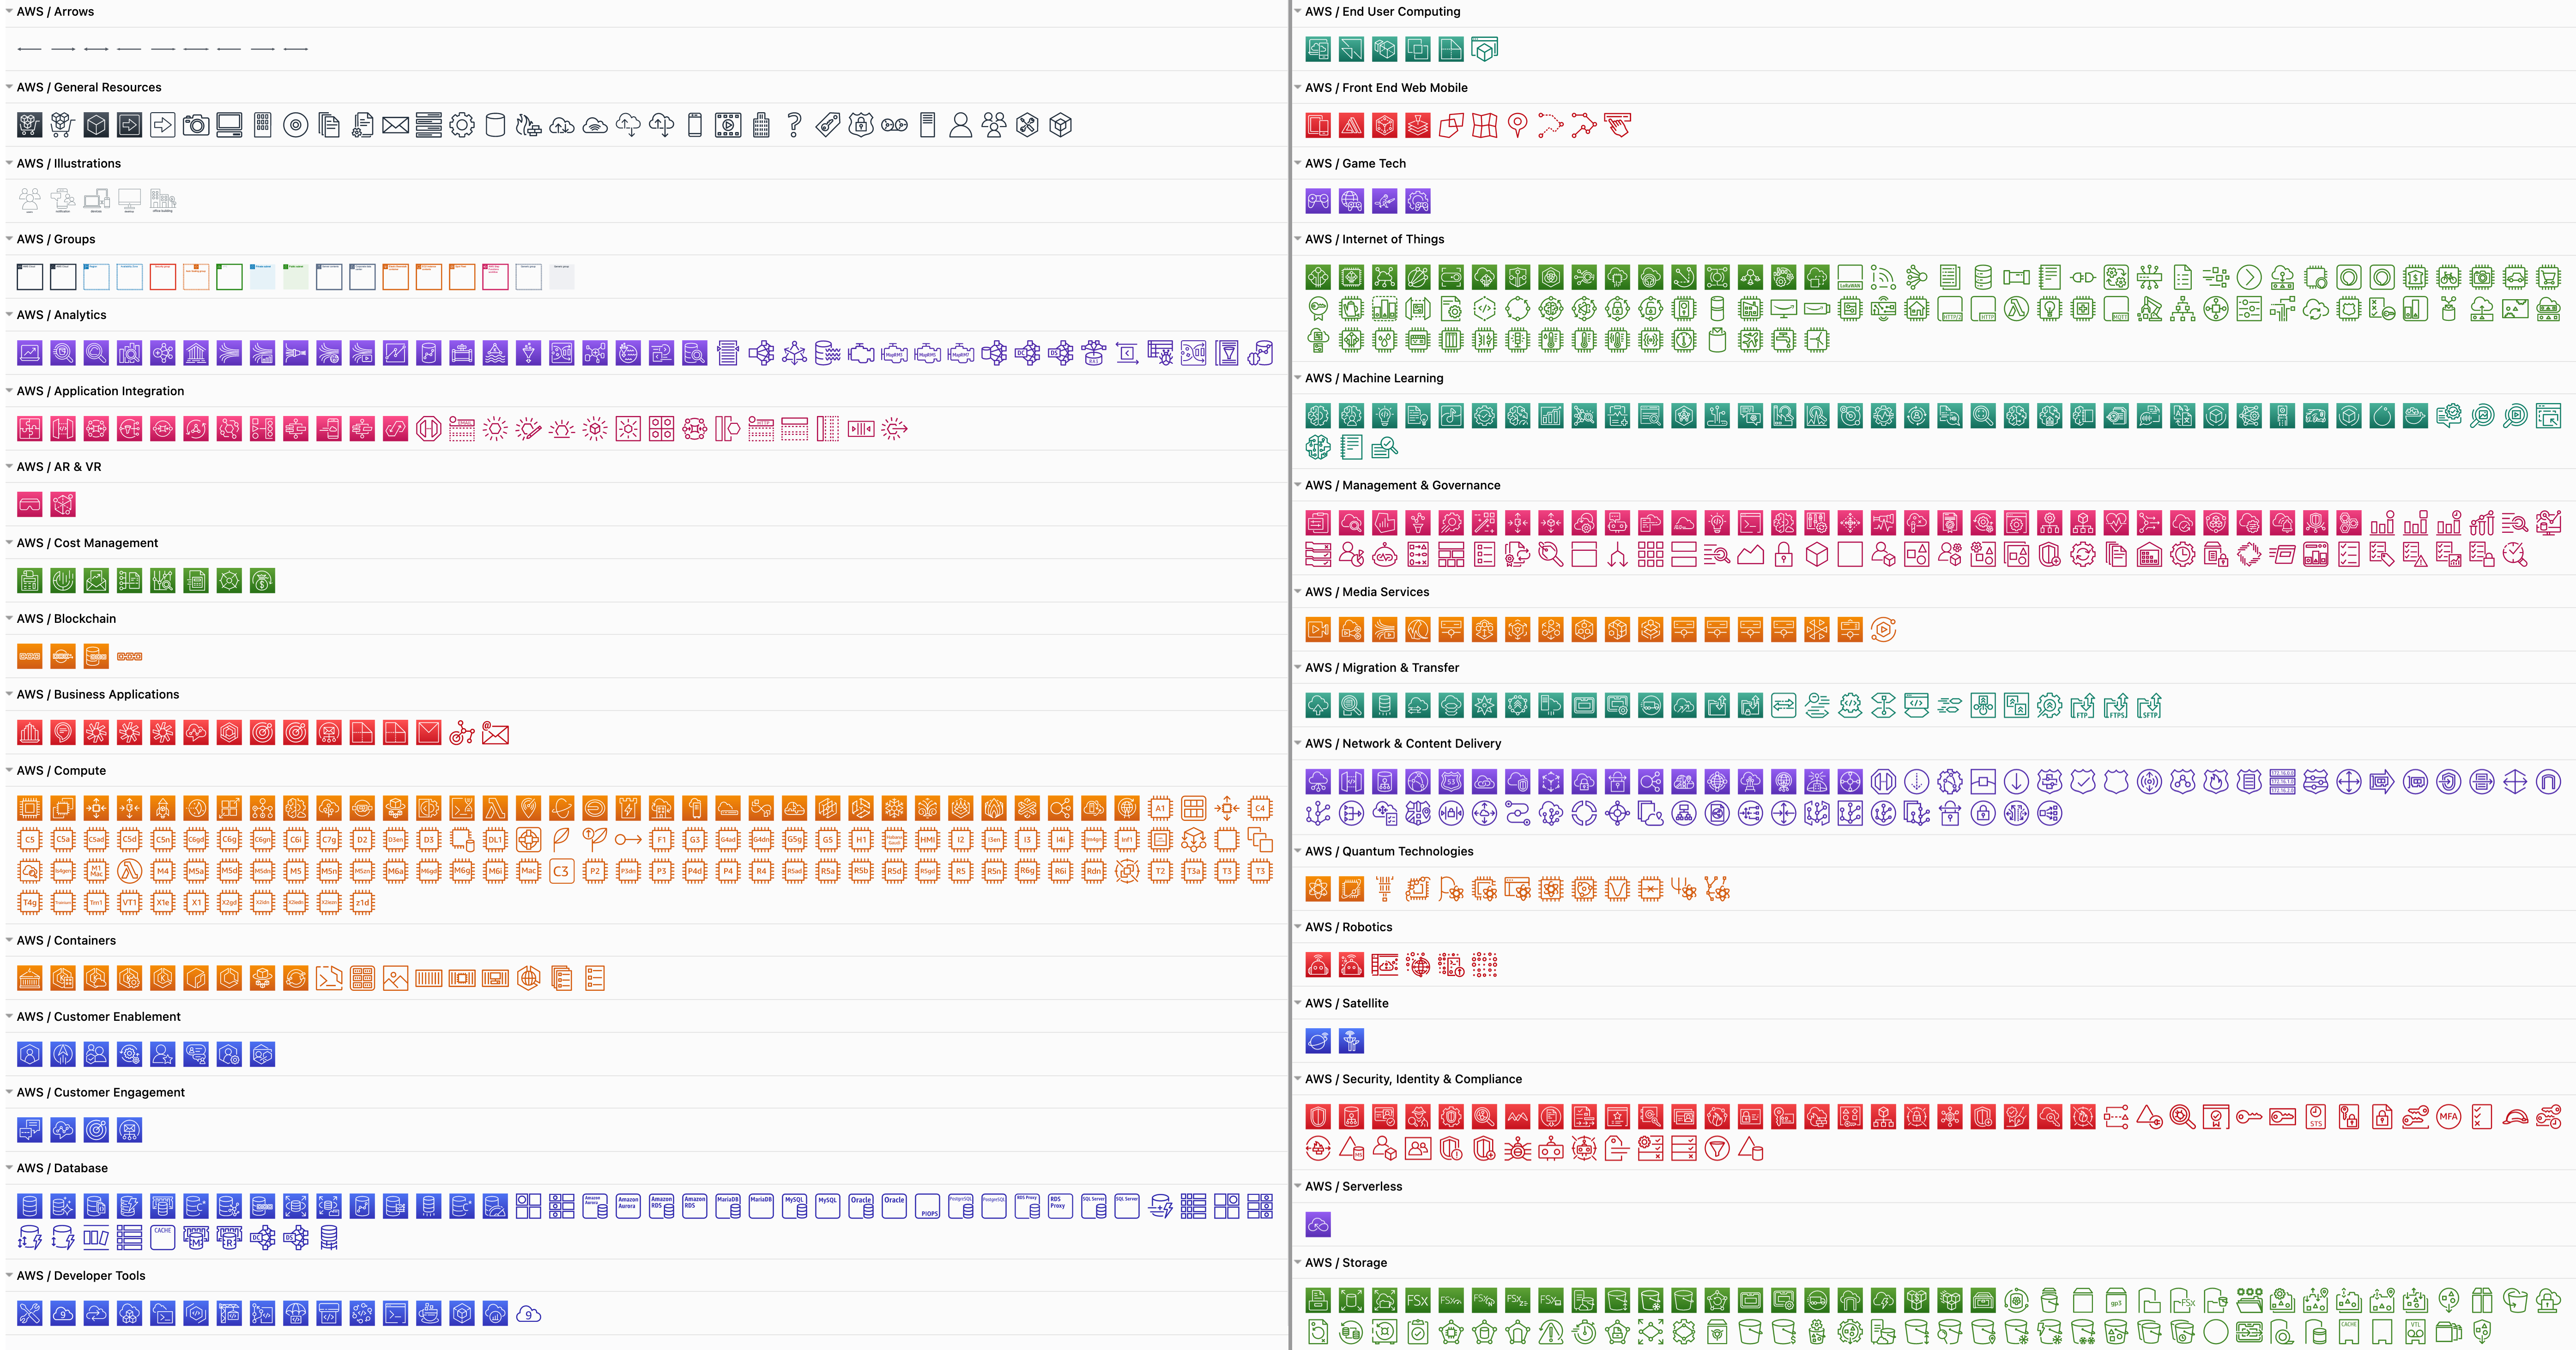
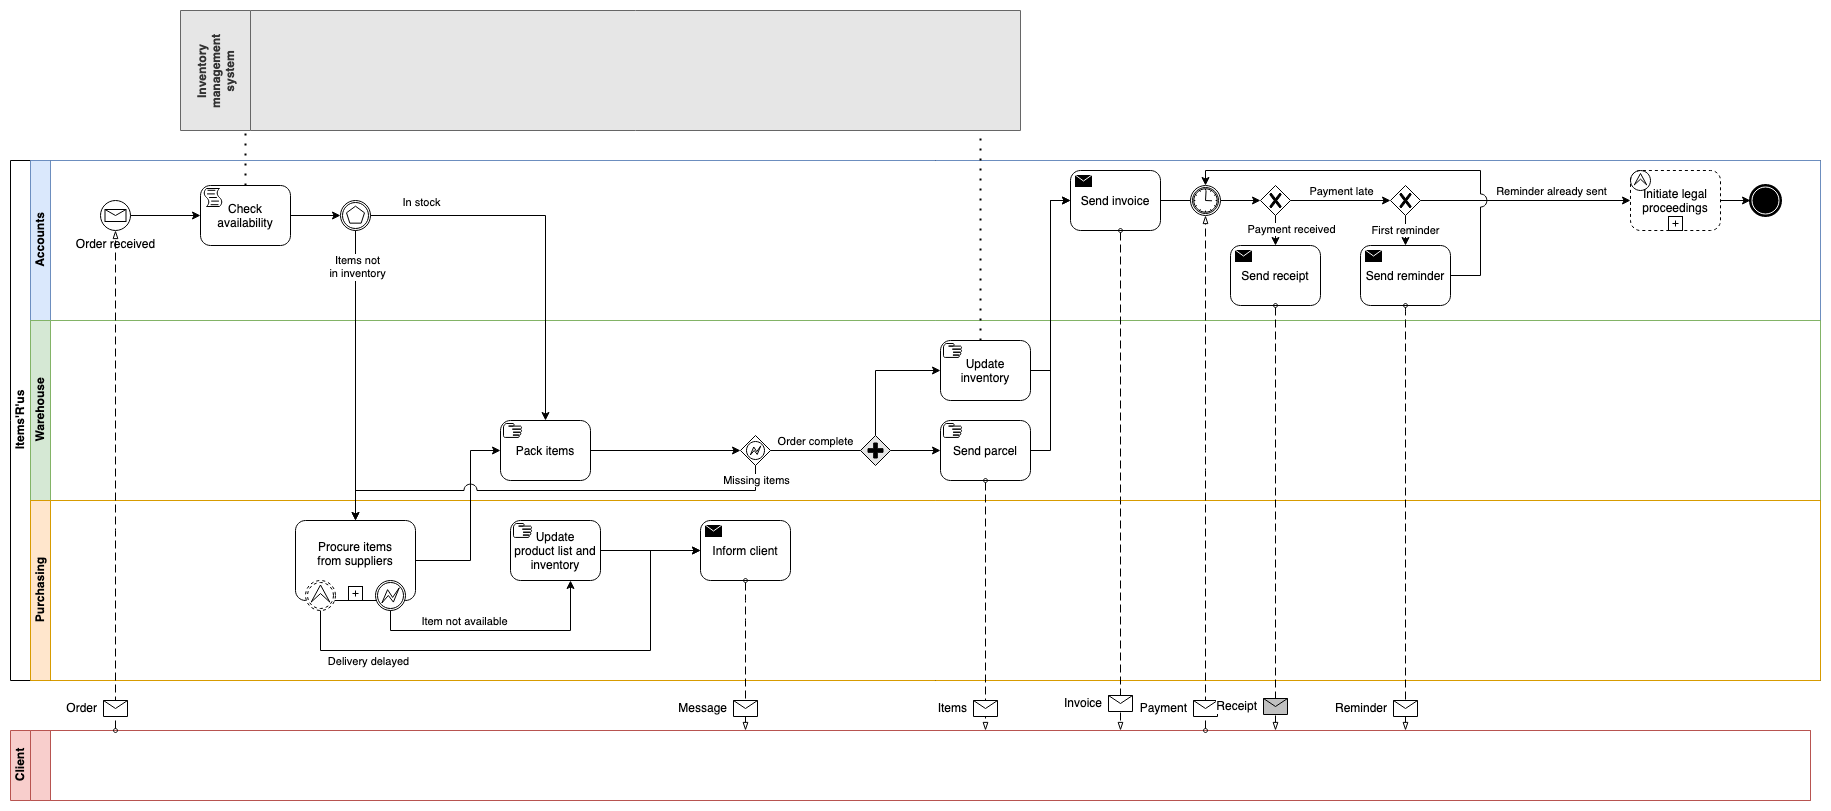
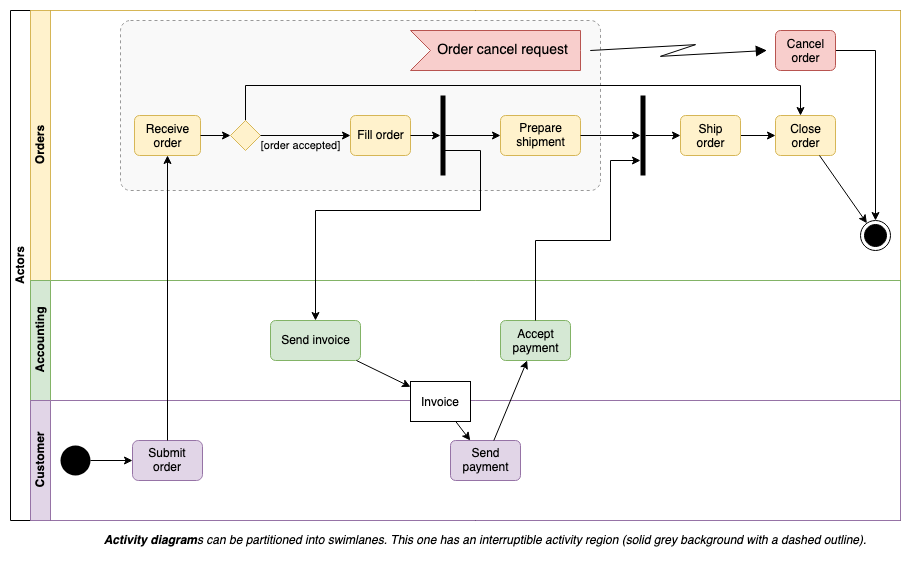
Several shape libraries saw new or updated stencils, including AWS, C4, GCP, BPMN 2.0, electrical and swimlane shapes.

Many more features have been updated, expanded, and some simplified. Additional interface translations have been completed, and existing translations refreshed - thank you to all of our translators!

And of course, a mountain of bugs have been squashed.

See the changelog in our drawio GitHub repository for full details of all of the releases.

Clear the draw.io cache to use the newest build

· 3 min read
draw.io
draw.io Team

Updates, bug fixes and new features are added to draw.io, both in our online editor and for various platforms regularly. It is likely that your browser will use a cached older version of the application by default. To use the newest build, you need to clear any features or diagram editor components in your browser that have been cached.

If you are experiencing odd behaviour in the diagram editor, or with your embedded images or imported fonts, try clearing the cache as an initial troubleshooting step. This makes sure that all diagram editor features and components are up to date.

Check which version of draw.io you are using

  1. Click Help and note the number at the bottom of the menu.
    Select Help in the draw.io menu to see which version you are currently using
  2. You can compare this number to the most recent VERSION number in our drawio repository on GitHub.
    Check our drawio repository on GitHub to see what the current version is

Using draw.io in Confluence Cloud or Jira Cloud?

Follow these instructions to find your draw.io app version and SEN in Confluence Cloud or in Jira Cloud.

Clear the draw.io cache

  1. Clear the cache:
  2. If you don't have app.diagrams.net open in another tab, click on Start App.
  3. If you do have a diagram open in app.diagrams.net or in one of the draw.io apps open in another browser tab, save your diagram first to not lose any data, then refresh that tab.

Once the diagram editor has been refreshed, you will see the most recent release.

What's new in draw.io

View the draw.io release notes on GitHub to see a list of the updates and bugfixes that have gone into each release.

Update draw.io Desktop

To update draw.io Desktop, in the menu, select Help > Check for Updates and follow the prompts.
Select Help in draw.io Desktop, then Check for Updates to update the application to the most recent build

Alternatively, visit download and install the latest version of our desktop app.

Learn more about using the standalone desktop version of draw.io

Import diagrams from Gliffy Online to draw.io

· 2 min read
draw.io
draw.io Team

Gliffy recently removed their free tier offering in their online version. This means if your trial version has expired, you will no longer be able to edit up to 5 diagrams that you have created, unless you start a paid subscription.

You can use our draw.io online editor to create an unlimited number of diagrams for free, without restrictions. Additionally, you can import your Gliffy diagrams.

How to import Gliffy diagrams

Prior to the removal of the free tier, 1st December 2021, open each diagram in turn in the Gliffy editor. Right click on the editor canvas and select "View diagram source"

The right-click menu in the Gliffy editor, with the view diagram source option selected

In the dialog that appears select the whole text and copy it.

The data model display dialog in Gliffy, showing the data representing the diagram

Open any text editor on your computer and paste the text in. Then save the file, using a .gliffy suffix to end the filename.

Repeat that until you have a file for each Gliffy diagram.

Next, go to app.diagrams.net and drag and drop the first file into the draw.io editor. Your diagram will be imported and you can click on the orange "unsaved diagram" warning to pick your save location.

The save option dialog in draw.io. At the top is a text field to type in the file name. Below are various storage options to select.

You can choose to save back to your computer or to one of the cloud storage options, Google Drive, OneDrive, Dropbox, GitHub or Gitlab.

If you're worried about trusting SaaS vendors with your data, when they can change usage terms at any time, use the draw.io desktop app. Note that the offline application cannot import Gliffy files, but once imported using our online app, you can open, edit and save your files in draw.io Desktop without limitations for free.